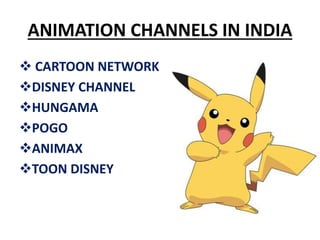
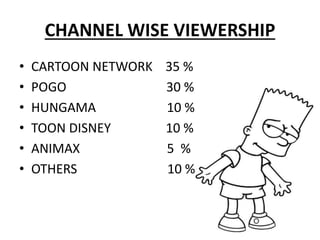
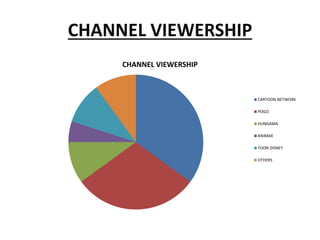
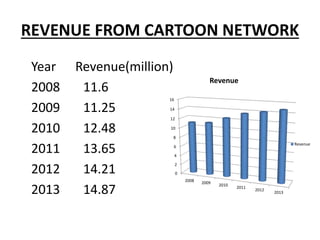
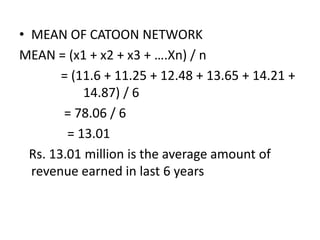
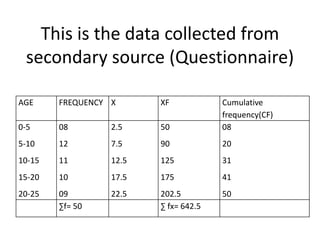
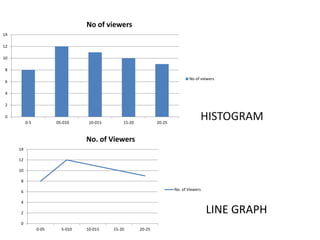
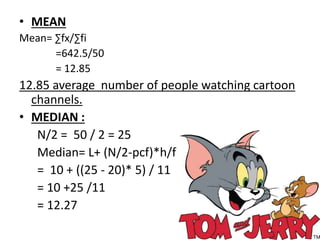
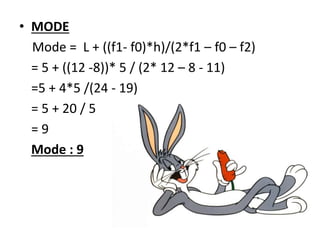
ITS CARTOON TIME’ : A
STUDY ON CARTOON
CHANNELS
ANIMATION CHANNELS IN INDIA
 CARTOON NETWORK
DISNEY CHANNEL
HUNGAMA
POGO
ANIMAX
TOON DISNEY
CHANNEL WISE VIEWERSHIP
• CARTOON NETWORK 35 %
• POGO 30 %
• HUNGAMA 10 %
• TOON DISNEY 10 %
• ANIMAX 5 %
• OTHERS 10 %
CHANNEL VIEWERSHIP
CHANNEL VIEWERSHIP
CARTOON NETWORK
POGO
HUNGAMA
ANIMAX
TOON DISNEY
OTHERS
REVENUE FROM CARTOON NETWORK
Year Revenue(million)
2008 11.6
2009 11.25
2010 12.48
2011 13.65
2012 14.21
2013 14.87
0
2
4
6
8
10
12
14
16
2008 2009
2010
2011
2012
2013
Revenue
Revenue
• MEAN OF CATOON NETWORK
MEAN = (x1 + x2 + x3 + ….Xn) / n
= (11.6 + 11.25 + 12.48 + 13.65 + 14.21 +
14.87) / 6
= 78.06 / 6
= 13.01
Rs. 13.01 million is the average amount of
revenue earned in last 6 years
This is the data collected from
secondary source (Questionnaire)
AGE FREQUENCY X XF Cumulative
frequency(CF)
0-5
5-10
10-15
15-20
20-25
08
12
11
10
09
2.5
7.5
12.5
17.5
22.5
50
90
125
175
202.5
08
20
31
41
50
∑f= 50 ∑ fx= 642.5
LINE GRAPH
HISTOGRAM0
2
4
6
8
10
12
14
0-5 05-010 10-015 15-20 20-25
No of viewers
No of viewers
0
2
4
6
8
10
12
14
0-05 5-010 10-015 15-20 20-25
No. of Viewers
No. of Viewers
• MEAN
Mean= ∑fx/∑fi
=642.5/50
= 12.85
12.85 average number of people watching cartoon
channels.
• MEDIAN :
N/2 = 50 / 2 = 25
Median= L+ (N/2-pcf)*h/f
= 10 + ((25 - 20)* 5) / 11
= 10 +25 /11
= 12.27
• MODE
Mode = L + ((f1- f0)*h)/(2*f1 – f0 – f2)
= 5 + ((12 -8))* 5 / (2* 12 – 8 - 11)
=5 + 4*5 /(24 - 19)
= 5 + 20 / 5
= 9
Mode : 9
Its cartoon time : Study On Cartoon Channel

Its cartoon time : Study On Cartoon Channel

  • 1.
    ITS CARTOON TIME’: A STUDY ON CARTOON CHANNELS
  • 2.
    ANIMATION CHANNELS ININDIA  CARTOON NETWORK DISNEY CHANNEL HUNGAMA POGO ANIMAX TOON DISNEY
  • 3.
    CHANNEL WISE VIEWERSHIP •CARTOON NETWORK 35 % • POGO 30 % • HUNGAMA 10 % • TOON DISNEY 10 % • ANIMAX 5 % • OTHERS 10 %
  • 4.
    CHANNEL VIEWERSHIP CHANNEL VIEWERSHIP CARTOONNETWORK POGO HUNGAMA ANIMAX TOON DISNEY OTHERS
  • 5.
    REVENUE FROM CARTOONNETWORK Year Revenue(million) 2008 11.6 2009 11.25 2010 12.48 2011 13.65 2012 14.21 2013 14.87 0 2 4 6 8 10 12 14 16 2008 2009 2010 2011 2012 2013 Revenue Revenue
  • 6.
    • MEAN OFCATOON NETWORK MEAN = (x1 + x2 + x3 + ….Xn) / n = (11.6 + 11.25 + 12.48 + 13.65 + 14.21 + 14.87) / 6 = 78.06 / 6 = 13.01 Rs. 13.01 million is the average amount of revenue earned in last 6 years
  • 7.
    This is thedata collected from secondary source (Questionnaire) AGE FREQUENCY X XF Cumulative frequency(CF) 0-5 5-10 10-15 15-20 20-25 08 12 11 10 09 2.5 7.5 12.5 17.5 22.5 50 90 125 175 202.5 08 20 31 41 50 ∑f= 50 ∑ fx= 642.5
  • 8.
    LINE GRAPH HISTOGRAM0 2 4 6 8 10 12 14 0-5 05-01010-015 15-20 20-25 No of viewers No of viewers 0 2 4 6 8 10 12 14 0-05 5-010 10-015 15-20 20-25 No. of Viewers No. of Viewers
  • 9.
    • MEAN Mean= ∑fx/∑fi =642.5/50 =12.85 12.85 average number of people watching cartoon channels. • MEDIAN : N/2 = 50 / 2 = 25 Median= L+ (N/2-pcf)*h/f = 10 + ((25 - 20)* 5) / 11 = 10 +25 /11 = 12.27
  • 10.
    • MODE Mode =L + ((f1- f0)*h)/(2*f1 – f0 – f2) = 5 + ((12 -8))* 5 / (2* 12 – 8 - 11) =5 + 4*5 /(24 - 19) = 5 + 20 / 5 = 9 Mode : 9