Download to read offline
![International Research Journal of Engineering and Technology (IRJET) e-ISSN: 2395-0056
Volume: 05 Issue: 06 | June 2018 www.irjet.net p-ISSN: 2395-0072
© 2018, IRJET | Impact Factor value: 7.211 | ISO 9001:2008 Certified Journal | Page 2859
PLANT DISEASE DETECTION AND CLASSIFICATION USING IMAGE
PROCESSING AND ARTIFICIAL NEURAL NETWORKS
Mr. Sanjay Mirchandani1, Mihir Pendse2, Prathamesh Rane3, Ashwini Vedula4
1Assistant Professor, Dept. of Electronics and Telecommunication Engineering, Vivekanand Education Society’s
Institute of Technology (VESIT), Maharashtra, India
2,3,4,Student, Dept. of Electronics and Telecommunication Engineering, Vivekanand Education Society’s Institute of
Technology (VESIT), Maharashtra, India
---------------------------------------------------------------------***---------------------------------------------------------------------
Abstract - Agricultural productivity is something on which
Indian economy highly depends. Thisis one of the reasonsthat
disease detection in plants plays an important role in
agricultural field, as having disease in plants is quite natural.
If proper care is not taken in this area then it causes serious
effects on plants and due to which respective product quality,
quantity or productivity is deteriorated. Detection of plant
disease through some automatic technique is beneficial as it
reduces a large work of monitoring in big farms of crops, and
at very early stage itself it detects the symptoms of diseasesi.e.
when they appear on plant leaves .Visually identifying plant
diseases is inefficient, difficult, time consuming, requires
expertise in plant diseases and continuous monitoring which
might be expensive in large farms. Therefore; afast,automatic
and accurate method to detect plant disease is of great
importance. Hence, image processing technique is employed
for the detection of plant diseases. The implementation of
these technologies will lead to improved productivity.
Key Words: Image Processing, K-means Clustering,
Artificial Neural Networks, Feed Forward Neural
Networks, Cascaded Feed Neural Networks
1. INTRODUCTION
In this paper a software solution for fast, accurate and
automatic detection and classification of plant diseases
through Image Processing is presented [1]. Identification of
the plant diseases is the key to preventing losses in the
quality and quantity of the agricultural product. Health
monitoring and disease detection of plant is critical for
sustainable agriculture. The typical methodofstudyingplant
disease is to rely on visually observable patternsontheplant
leaves. Visually identifying plant diseases is inefficient,
difficult, time consuming, requires expertise in plant
diseases and continuous monitoring which might be
expensive in large farms. Therefore; a fast, automatic and
accurate method to detect plant disease is of great
importance. Hence, image processing techniqueisemployed
for the detection of plant diseases. The implementation of
these technologies will lead to improved productivity India
has a diverse agricultural sector. Agriculture plays a vital
role in India’s economy and over 58 per cent of the rural
households depend on agriculture as their principal means
of livelihood. Research in agriculture is aimed towards
increase of productivity and quality of food. Three are two
main characteristics of plant-disease detection machine-
learning methods that must be achieved, they are:speedand
accuracy. In this study an automatic detection and
classification of leaf diseases has been introduced, this
method is based on K-means as a clustering procedure and
ANNs(Artificial Neural Networks) as a classifier tool using
some texture feature set .The aim of this work is threefold:
1) Identifying the infected object(s) based upon K-means
clustering.
2) Extracting the feature set of the infected Leaf images.
3) Detecting and classifying the type of disease using
ANNs(Artificial Neural Networks).
2. STEP-BY-STEP APPROACH
2.1 FLOWCHART
The Flowchart gives a brief idea of the various stages; which
include Image Acquisition, RGB to Gray conversion ,Median
filtering, K-means Clustering and disease detection using
Neural Networks. Feed forward back propogation and
Cascaded forward back propogation are the two types of
neural training networks used.We have collected about 38
images of various plant diseases which we are going to
detect as our dataset. The diseases are black spot disease,
yellow sigatoka disease, frog eye disease , powdery mildew
disease, tobacco ringspot disease, tomato plant disease and
valedensia leafspot disease.Pre-processing is done to
suppress unwanted image data and to enhance some
important image features. It includes RGB to Gray
conversion, image resizing and medianfiltering. Theinfected
part of the plant is then highlighted and made to differ from
the healthy part using K-means clustering algorithm. After
this various features of the diseased plant images are](https://image.slidesharecdn.com/irjet-v5i6537-180818062756/85/IRJET-Plant-Disease-Detection-and-Classification-using-Image-Processing-and-Artificial-Neural-Networks-1-320.jpg)
![International Research Journal of Engineering and Technology (IRJET) e-ISSN: 2395-0056
Volume: 05 Issue: 06 | June 2018 www.irjet.net p-ISSN: 2395-0072
© 2018, IRJET | Impact Factor value: 7.211 | ISO 9001:2008 Certified Journal | Page 2859
PLANT DISEASE DETECTION AND CLASSIFICATION USING IMAGE
PROCESSING AND ARTIFICIAL NEURAL NETWORKS
Mr. Sanjay Mirchandani1, Mihir Pendse2, Prathamesh Rane3, Ashwini Vedula4
1Assistant Professor, Dept. of Electronics and Telecommunication Engineering, Vivekanand Education Society’s
Institute of Technology (VESIT), Maharashtra, India
2,3,4,Student, Dept. of Electronics and Telecommunication Engineering, Vivekanand Education Society’s Institute of
Technology (VESIT), Maharashtra, India
---------------------------------------------------------------------***---------------------------------------------------------------------
Abstract - Agricultural productivity is something on which
Indian economy highly depends. Thisis one of the reasonsthat
disease detection in plants plays an important role in
agricultural field, as having disease in plants is quite natural.
If proper care is not taken in this area then it causes serious
effects on plants and due to which respective product quality,
quantity or productivity is deteriorated. Detection of plant
disease through some automatic technique is beneficial as it
reduces a large work of monitoring in big farms of crops, and
at very early stage itself it detects the symptoms of diseasesi.e.
when they appear on plant leaves .Visually identifying plant
diseases is inefficient, difficult, time consuming, requires
expertise in plant diseases and continuous monitoring which
might be expensive in large farms. Therefore; afast,automatic
and accurate method to detect plant disease is of great
importance. Hence, image processing technique is employed
for the detection of plant diseases. The implementation of
these technologies will lead to improved productivity.
Key Words: Image Processing, K-means Clustering,
Artificial Neural Networks, Feed Forward Neural
Networks, Cascaded Feed Neural Networks
1. INTRODUCTION
In this paper a software solution for fast, accurate and
automatic detection and classification of plant diseases
through Image Processing is presented [1]. Identification of
the plant diseases is the key to preventing losses in the
quality and quantity of the agricultural product. Health
monitoring and disease detection of plant is critical for
sustainable agriculture. The typical methodofstudyingplant
disease is to rely on visually observable patternsontheplant
leaves. Visually identifying plant diseases is inefficient,
difficult, time consuming, requires expertise in plant
diseases and continuous monitoring which might be
expensive in large farms. Therefore; a fast, automatic and
accurate method to detect plant disease is of great
importance. Hence, image processing techniqueisemployed
for the detection of plant diseases. The implementation of
these technologies will lead to improved productivity India
has a diverse agricultural sector. Agriculture plays a vital
role in India’s economy and over 58 per cent of the rural
households depend on agriculture as their principal means
of livelihood. Research in agriculture is aimed towards
increase of productivity and quality of food. Three are two
main characteristics of plant-disease detection machine-
learning methods that must be achieved, they are:speedand
accuracy. In this study an automatic detection and
classification of leaf diseases has been introduced, this
method is based on K-means as a clustering procedure and
ANNs(Artificial Neural Networks) as a classifier tool using
some texture feature set .The aim of this work is threefold:
1) Identifying the infected object(s) based upon K-means
clustering.
2) Extracting the feature set of the infected Leaf images.
3) Detecting and classifying the type of disease using
ANNs(Artificial Neural Networks).
2. STEP-BY-STEP APPROACH
2.1 FLOWCHART
The Flowchart gives a brief idea of the various stages; which
include Image Acquisition, RGB to Gray conversion ,Median
filtering, K-means Clustering and disease detection using
Neural Networks. Feed forward back propogation and
Cascaded forward back propogation are the two types of
neural training networks used.We have collected about 38
images of various plant diseases which we are going to
detect as our dataset. The diseases are black spot disease,
yellow sigatoka disease, frog eye disease , powdery mildew
disease, tobacco ringspot disease, tomato plant disease and
valedensia leafspot disease.Pre-processing is done to
suppress unwanted image data and to enhance some
important image features. It includes RGB to Gray
conversion, image resizing and medianfiltering. Theinfected
part of the plant is then highlighted and made to differ from
the healthy part using K-means clustering algorithm. After
this various features of the diseased plant images are](https://image.slidesharecdn.com/irjet-v5i6537-180818062756/75/IRJET-Plant-Disease-Detection-and-Classification-using-Image-Processing-and-Artificial-Neural-Networks-1-2048.jpg)
![International Research Journal of Engineering and Technology (IRJET) e-ISSN: 2395-0056
Volume: 05 Issue: 06 | June 2018 www.irjet.net p-ISSN: 2395-0072
© 2018, IRJET | Impact Factor value: 7.211 | ISO 9001:2008 Certified Journal | Page 2860
extracted which include : Energy, Entropy, Co-variance,
Standard deviation and Background intensityaverage.These
various feature values serve as an input to the neural
network which detects the appropriate disease.
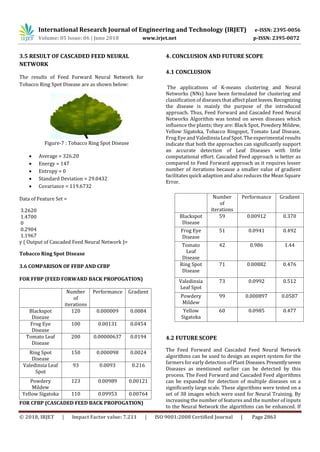
Figure -1: Process Flowchart
2.2 PREPROCESSING
The main aim of Pre-processing is to suppress unwanted
image data and to enhance some importantimagefeatures.It
includes RGB to Gray conversion, image resizingandmedian
filtering. Here colour image is converted to gray scale image
to make the image device independent. The image is then
resized to a size of 256*256. Then median filtering is
performed on the image to remove the noise.
2.3 K-MEANS CLUSTERING
K-means clustering is a type of unsupervised learning,
which is used when you have unlabelled data (i.e., data
without defined categories or groups)[10].The goal of
this algorithm is to find groups in the data, with the
number of groups represented by the variable K. The
algorithm works iteratively to assign each data pointto
one of K groups based on the features thatareprovided.
Data points are clustered based on feature similarity.
Algorithm :
The Κ-means clustering algorithm uses iterative
refinement to produce a final result. The algorithm
inputs are the number of clusters Κ and the data set.
The data set is a collection of features for each data
point. The algorithms starts with initial estimates
for the Κ centroids, which can either be randomly
generated or randomly selected from the data set.
The algorithm then iterates between two steps:
1. Data assignment step: Each centroids defines one
of the clusters. In this step, each data point is
assigned to its nearest centroid, based on the
squared Euclidean distance. More formally, if ci is
the collection of centroids in set C, then each data
point x is assigned to a cluster based on
Where dist( · ) is the standard (L2) Euclidean
distance.
2. Centroid update step: In this step, the centroids
are recomputed. This is done by taking the mean of
all data points assigned to that centroid's cluster.
The algorithm iterates between steps one and two
until a stopping criteria is met (i.e., no data points
change clusters, the sum of the distances is
minimized, or some maximum number of iterations
is reached).This algorithm is guaranteed to
converge to a result. The result may be a local
optimum (i.e. not necessarily the best possible
outcome), meaning that assessing more than one
run of the algorithm with randomized starting
centroids may give a better outcome.
2.4 ARTIFICIAL NEURAL NETWORKS
Figure-2: Artificial Neural Networks](https://image.slidesharecdn.com/irjet-v5i6537-180818062756/85/IRJET-Plant-Disease-Detection-and-Classification-using-Image-Processing-and-Artificial-Neural-Networks-2-320.jpg)
![International Research Journal of Engineering and Technology (IRJET) e-ISSN: 2395-0056
Volume: 05 Issue: 06 | June 2018 www.irjet.net p-ISSN: 2395-0072
© 2018, IRJET | Impact Factor value: 7.211 | ISO 9001:2008 Certified Journal | Page 2861
Artificial Neural Network is a computing system made up of
a number of simple, highly interconnected processing
elements, which process information by their dynamic state
response to external inputs. ANNs(Artificial Neural
Networks) are composed of multiple nodes, which imitate
biological neurons of human brain. The neurons are
connected by links and they interact with each other. The
nodes can take input data and perform simple operationson
the data. The result of these operations is passed to other
neurons. The output at each node is called its activation or
node value. Each link is associated with weight. ANNs are
capable of learning, which takes place by altering weight
values. Here we have used a multiple hidden layer network.
This reduces load on neural network and improves its
performance. The number of hidden layers taken is 2.
The two types of Neural Networks used are:
1. Feed Forward Back Propagating Neural
Network:
A feed forward neural network isan artificialneuralnetwork
wherein connections between the units do not form a cycle.
As such, it is different from recurrent neural networks[12].
The feed forward neural network was the first and simplest
type of artificial neural network devised. In thisnetwork,the
information moves in only one direction, forward, from the
input nodes, through the hidden nodes (if any) and to the
output nodes. There are no cycles or loops in the network.
Multi-layer networks use a variety of learning techniques,
the most popular being back-propagation. Here, the output
values are compared with the correct answertocomputethe
value of some predefined error-function. By various
techniques, the error is then fed back through the network.
Using this information, the algorithm adjusts the weights of
each connection in order to reduce the value of the error
function by some small amount. After repeating this process
for a sufficiently large number of trainingcycles,thenetwork
will usually converge to some state where the error of the
calculations is small. In this case, one would say that the
network has learned a certain target function. Back
Propagation network is considered to be quintessential
Neural Network. Back Propagation is the trainingorlearning
algorithm rather than the network itself. To train the
network we need to give the output called the Target for a
particular input. The input and its corresponding target are
called a Training Pair. Once the network is trained, it will
provide the desired output for any of the input patterns.The
network is first initialized by setting up all its weights to be
small random numbers – say between –1 and +1. Next, the
input pattern is applied and the output is calculated this is
called the forward pass. The calculation gives an output
which is completely different to what is expected (the
Target), since all the weights are random. We then calculate
the Error of each neuron, which isessentially:Target-Actual
Output. This error isthen used mathematically tochangethe
weights in such a way that the error will get smaller.Inother
words, the Output of each neuron will get closer to itsTarget
(this part is called the reverse pass). The process isrepeated
again and again until the error isminimal. The neurons have
a sigmoid activation function. The network keepstrainingall
the patterns repeatedly until the total error falls to some
pre-determined low target value and then it stops. Whenthe
network has fully trained, the Validation Set error reaches a
minimum. When the network isovertraining (becoming too
accurate) the validation set error starts rising.
2. Cascaded Feed Back Propagating Neural Network:
Cascaded Forward models are similar to feed-forward
networks, but include a weight connection fromthe input to
each layer and from each layer to the successive layers.
While two-layer feed forward networkscanpotentiallylearn
virtually any input-output relationship, feed-forward
networks with more layers might learn complex
relationships more quickly. The function : newcf creates
cascade-forward networks. For example, a three layer
network has connections from layer 1 to layer 2, layer 2 to
layer 3, and layer 1 to layer 3. The three-layer network also
has connections from the input to all three layers. The
additional connections might improvethespeedatwhichthe
network learns the desired relationship. CF artificial
intelligence model is similar to feed forward back
propagation neural network in using the back propagation
algorithm for weights updating, but the main symptom of
this network is that each layer of neurons related to all
previous layer of neurons .Tan-sigmoid transferfunction,log
- sigmoid transfer function and pure linear threshold
functions were used to reach the optimized status. The
performance of cascade forward back propagation and feed
forward back propagation were evaluated using Root Mean
Square Error (RMSE).
3. RESULTS AND DISCUSSION
3.1 RESULTS OF K-MEANS CLUSTERING
The figure below shows the original image, the gray scale
representation of same. Also the median filtered image can
be seen. The K-means clustered image is present which
clearly separates the infected part of leaf from the healthy
part.The clustering is performed on the basis of the pixel
intensity values.](https://image.slidesharecdn.com/irjet-v5i6537-180818062756/85/IRJET-Plant-Disease-Detection-and-Classification-using-Image-Processing-and-Artificial-Neural-Networks-3-320.jpg)
![International Research Journal of Engineering and Technology (IRJET) e-ISSN: 2395-0056
Volume: 05 Issue: 06 | June 2018 www.irjet.net p-ISSN: 2395-0072
© 2018, IRJET | Impact Factor value: 7.211 | ISO 9001:2008 Certified Journal | Page 2864
this technique is developed into a sophisticated interface in
the form of a Website or Android Application itmayproveto
be great asset to the agricultural sector. In the future this
methodology can be integrated with other yet to be
developed methods for disease identification and
classification. The use of other algorithms can be exploredto
enhance the efficiency of the system in future.
REFERENCES
[1] Al-Hiary, S. Bani-Ahmad, M. Reyalat, M. Braik and Z.
ALRahamneh, “Fast and Accurate Detection and
Classification of Plant Diseases”, International
Journal of Computer Applications (0975 – 8887)
Volume 17– No.1, March 2011.
[2] Al-Bashish, D. M. Braik and S. Bani-Ahmad, 2011
Detection and classification of leaf diseasesusingK-
means-based segmentation and neural-networks-
based classification. Inform. Technol. J., 10: 267-
275. DOI: 10.3923/itj.2011.267.275.
[3] https://www.britannica.com/editor/TheEditos-of-
Encyclopaedia-Britannica/4419.
[4] Biological management of Yellow Sigatoka Disease
of banana caused by Mycospharella Musicola by
V.Shanthiya.
[5] https://www.pioneer.com/home/site/us/agronoy/
cropmanagement/soybeaninsect-disease/frogeye
leaf-spot.
[6] Detection of Diseases in Different Plants Using
Digital Image Processing by K.Gowthami,
M.Pratyusha, B.Somasekhar.
[7] Disease Detection Using Different Algorithms by
Trimi Neha Tete (Department of Electrical &
Electronics) and Sushma Kamlu.
[8] Color Space Transformations Philippe Colantoni
and Al 2004.
[9] The Component Median Filter for Noise Removal in
Digital Images Harish 1 and M.R.Gowtham2
1Department of Electronics and Communication
Engineering, Priyadarshini College of Engineering,
NELLORE – 524 004, A. P., INDIA
[10] R.Nathan,” Spatial Frequency Filtering,” in Picture
Processing and Psychopictrotics,B.S .Lipkin and
A.Roswnfeld,Eds., Academic Press, New York
[11] https://www.datascience.com/blog/k-means-
clustering.
[12] https://towardsdatascience.com/activation-
functions-and-its-types-which-isbetter-
a9a5310cc8f.
[13] The Influence of the Sigmoid Function Parameters
on the Speed of Back propagation Learning Jun Han
Claudio Moraga Research Group
Computational Intelligence Dept. of Computer
Science, University of D
[14] https://brilliant.org/wiki/feedforward-neural-
networks/Performance Measures, Consistency,and
Power for Artificial Neural Network Models* J. M.
TWOMEY AND A. E. SMITH+ Department of
Industrial Engineering, University of Pittsburgh
1031 Benedum Hall, Pittsburgh, PA 15261, U.S.A.](https://image.slidesharecdn.com/irjet-v5i6537-180818062756/85/IRJET-Plant-Disease-Detection-and-Classification-using-Image-Processing-and-Artificial-Neural-Networks-6-320.jpg)

This document describes a method for detecting and classifying plant diseases using image processing and artificial neural networks. The method involves preprocessing images through grayscaling, resizing and filtering. K-means clustering is used to segment infected leaf regions. Features are extracted from segmented images and fed into feedforward and cascaded feedforward neural networks for disease classification. The method achieved accurate classification of several common plant diseases with fewer iterations and better performance than traditional feedforward backpropagation neural networks. This automatic disease detection approach could help improve agricultural productivity by facilitating early detection on large farms.