Download to read offline
![International Research Journal of Engineering and Technology (IRJET) e-ISSN: 2395-0056
Volume: 05 Issue: 03 | Mar-2018 www.irjet.net p-ISSN: 2395-0072
© 2018, IRJET | Impact Factor value: 6.171 | ISO 9001:2008 Certified Journal | Page 3309
(LASOM) that can be used for estimating the density
distribution of one variable conditioned on another. LASOM
is able to compress the large amounts of data by not storing
commonly occurring images and by storing onlythefeatures
that are required for discriminating one geographicalregion
from another. It removes noise by removing features that
occur very rarely and it gives us the ability to discover the
similarities and differences between different regions.
1.1 Goals and Objectives
Geo-tagging allows user to visualize and manage photo
collection in many ways.
Using a collection of over a million geo-tagged pictures,
we build location.
Probability maps for commonly used images tags over
the entire globe.
It is easy to find out location, where the photo is taken.
2. LITERATURE SURVEY
The Self-Organizing Map (SOM) algorithm [1] is a well-
known method, which provides both data reduction and
projection in an integrated framework. Using regular 2D
grids asneural structures for the SOM training ,visualization
form of the maps, component planes, and distance
distributions comprise basic methods visual for exploration
of data using SOM processing [2]. SOM-based VisualAnalysis
to date has considered different application domains,
including financial data analysis based on multivariate data
models [3], analysis of web click stream data using Markov
Chain models [4], trajectory oriented data [5], or time-
oriented data [6].Image Sorter [7] proposed to visually
analyze collections of images by training a SOM over color
features extracted from the images. We herefollowthatidea,
in that we analyze geo-spatial heat maps of sentimentscores
using SOM of respective color features as well. When
considering geo-referenced data with SOM, basically two
approaches exist. First, in the joint data model, one single
data representation is formed by combining spatial and
other multivariate data into a single vector representation
which is input to the SOM method. Examples include [10],
where a joint vector representation for both geo-location
and demo graphic data was formed for census data analysis.
More methods can be found in [11].
3. EXISTING SYSTEM
In the earliest system the problem was to identify the actual
location of an image means they were not provide the
accurate result of location only produced the predicted
result. Content understanding in imageshasbeenstudiedfor
decades in the vision research community.Recently, the
research community increasingly turns to metadata and
picture taking context solve the semantic understanding
problem. Important metadata can be collected also as a
result of user participation.
Photo sharing websites such as Flickr have witnessed as
urge of collaborative tagging from users. When an image is
manually tagged, the user associates annotations with the
image that are descriptive and maycarryinformationrelated
to the locationof the image. In some cases, therelationshipis
direct: An image tagged “Chicago” isquite probablycaptured
in the Illinois city. However, in other cases the relationshipis
more subtle but still informative. For example, an image
tagged “snow” is not likely to have been captured near the
equator. Other tags, such as “smile”, contain little
information regarding the locationof the image capture.The
benefit of user tags is clear from Fig. 1. Even if you think you
know the location of an image from the content, the tags
collectively can provide valuable information. If we jumped
to the conclusion that this statue is in NYC, we would be
drawing a reasonable but incorrect conclusion. While
location hasbeen used for image understanding; the inverse
problem of inferring location from image content is still
novel and difficult.
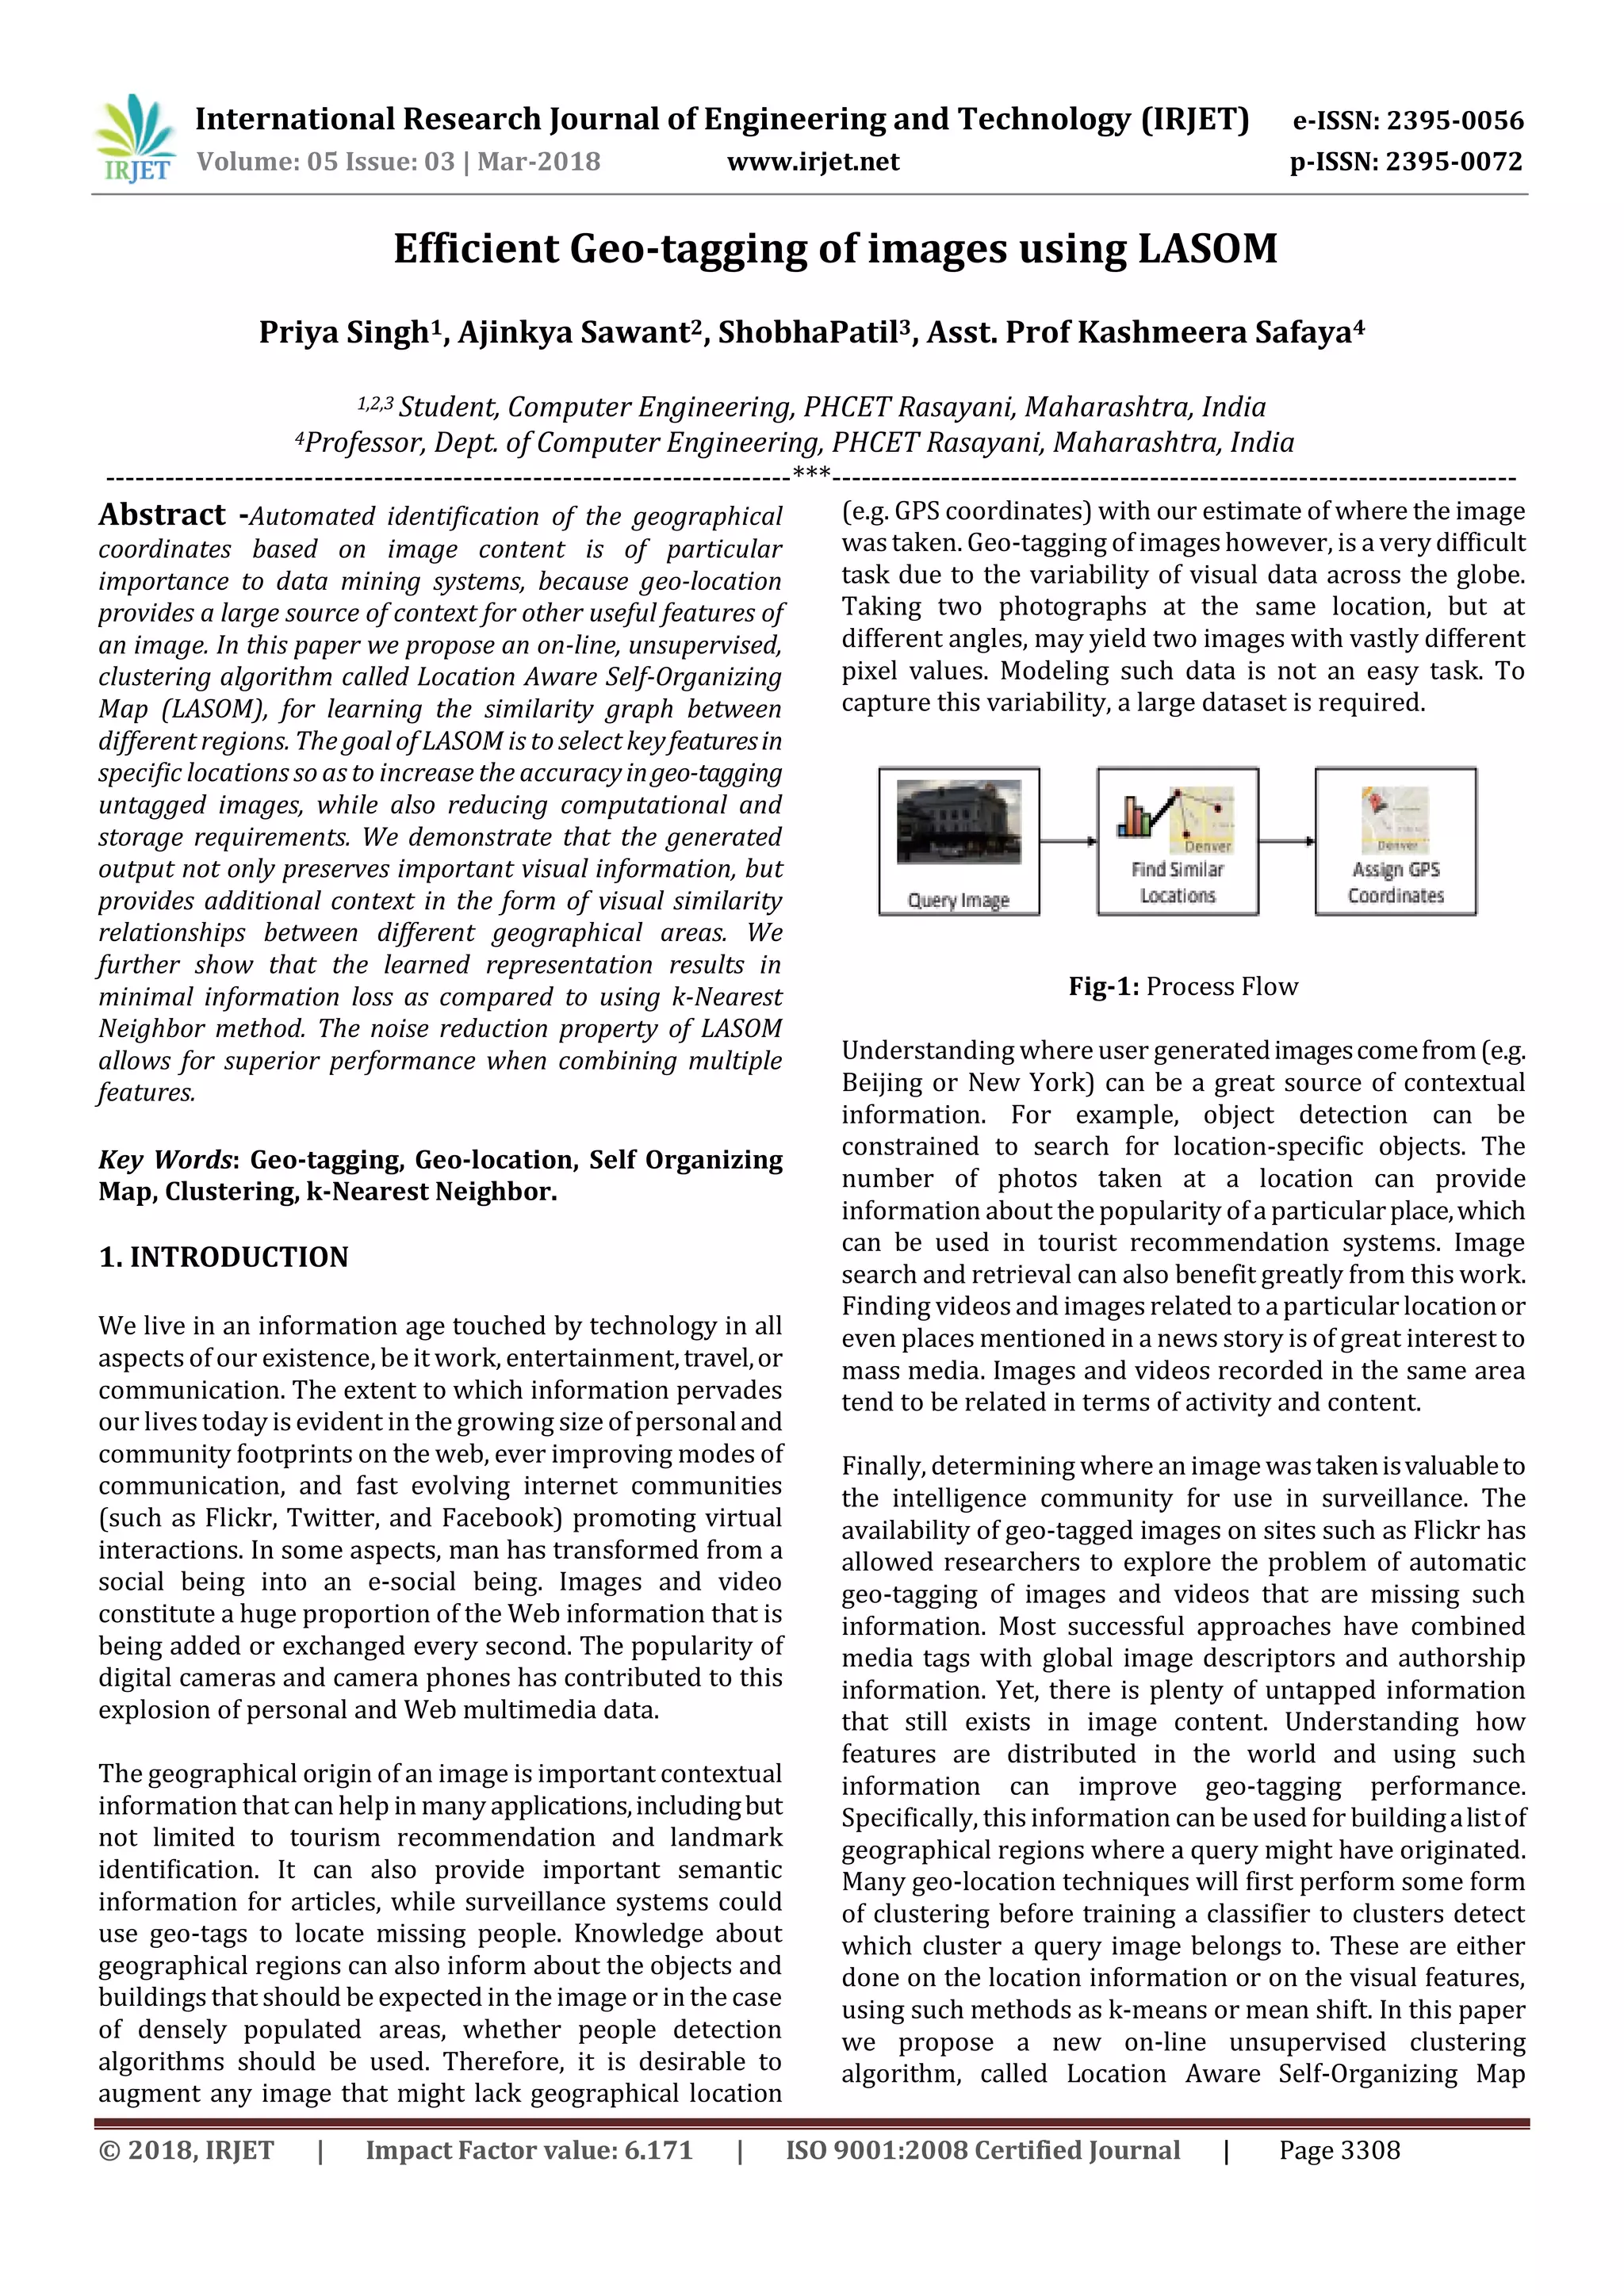
4. IMPLEMENTED SYSTEM
In this paper the user will provide the images for finding the
location in the maps. The Geo-tagging phenomenon used
here the images in a particular location in the maps. More
specifically we want to find arg max. Calculating thisdirectly
is very difficult, due to the large variability of visual data at
each possible location. We discuss the details of a new on-
line, unsupervised clustering algorithm that compresses
large databases by only keeping the information requiredto
identify a specific location. Location Aware Self-Organizing
Map LASOM is a specialized algorithm for learning the
distribution of one feature conditioned on another one.
Spatial constraints will be used to learn the distribution of
visual features at particular geographical locations. To
evaluate LASOM dataset and features. The spatial
distribution of images, while the training set is noisy and
contains a number of distant training samples(Best viewed
zoomed in and in color).Intuitively, this process can be seen
as moving a codebook vector in feature space until the
center (i.e. average) of that space isfound. This movementis
constrained by neighboring nodes. In this entire processcan
be seen as spatial binning of visual information, where the
bin centers do not have to be determined a-priori, and are
based on the visual variability in a particular region (i.e.
more codebooks are dedicated to highly variable
areas).Querying LASOM in this process assign a location to
an untagged image. The code vector represents a region in
feature space. To provide better estimates, the queryfeature
is once again compared to code vector and all its immediate
neighboring nodes and the weight are normalized for
calculating the location. Experiments showed that using an
exponential with a base of resulted in superior performance.](https://image.slidesharecdn.com/irjet-v5i3780-190204040745/75/IRJET-Efficient-Geo-tagging-of-images-using-LASOM-2-2048.jpg)
![International Research Journal of Engineering and Technology (IRJET) e-ISSN: 2395-0056
Volume: 05 Issue: 03 | Mar-2018 www.irjet.net p-ISSN: 2395-0072
© 2018, IRJET | Impact Factor value: 6.171 | ISO 9001:2008 Certified Journal | Page 3310
Fig-2: System Architecture
4. FUTURE SCOPE
Other applications consolidate large scale dataset of geo-
tagged information to produce map that indicate where
things are in the world taken asimage. We expectfuturegeo-
tagging driven research and applications to develop in
several directions, including dealing with large scale data,
fusion of multi-modality information.
5. CONCLUSIONS
We have proposed geo-tagging in large no. of data with the
use of LASOM. The goal of LASOM is to select key features in
specific locations so as to increase the accuracy in geo-
tagging untagged images, while also reducingcomputational
and storage requirements. We demonstrate that the
generated map not only preserves important visual
information, but provides additional context in the form of
visual similarity relationships between different
geographical areas. We show how this information can be
used to improve geo-tagging results when using large
databases. We further show that the learned representation
results in minimal Information loss as compared to using k
Nearest Neighbor method. The noise reduction property of
LASOM allows for superior performance when combining
multiple features.
6. REFERENCES
[1] T. Kohonen, Self-Organizing Maps.Springer-Verlag,2001.
[2] J. Vesanto, “SOM-based data visualization methods,”
Intelligent Data Analysis, vol. 3, no. 2, pp. 111–126, 1999.
[3] G. J. Deboeck and T. K. Kohonen, Eds., Visual Explorations
in Finance: with Self-Organizing Maps. Springer, 1998.
[4] J. Wei, Z. Shen, N. Sundaresan, and K.-L.Ma,“Visualcluster
exploration of web clickstream data,” in IEEE VAST, 2012,
pp. 3–12.
[5] T. Schreck, J. Bernard, T. von Landesberger, and J.
Kohlhammer, “Visual cluster analysis of trajectory datawith
interactive kohonenmaps,” Information Visualization,vol.8,
no. 1, pp. 14–29, 2009. [Online]. Available:
http://dx.doi.org/10.1057/ivs.2008.29
[6] J. Bernard, J. Brase, D. Fellner, O. Koepler, J. Kohlhammer,
T. Ruppert, T. Schreck, and I. Sens, “A visual digital library
approach for timeorientedscientific primary data,” Springer
International Journal of Digital Libraries, ECDL 2010 Special
Issue, pp. 111–123, 2011.
[7] K. U. Barthel, “Improved image retrieval using automatic
image sorting and semi-automatic generation of image
semantics,” Image Analysis for Multimedia Interactive
Services, International Workshop on, vol. 0, pp. 227–230,
2008.
[8] N. Andrienko and G. Andrienko, Exploratory Analysis of
Spatial and Temporal Data: A Systematic Approach.
Springer-Verlag, 2005.
[9] A. M. MacEachren, How Maps Work - Representation,
Visualization, and Design.Guilford Press, 2004.
[10] F. Bao, V. Lobo, and M. Painho, “The self-organizingmap,
the geosom, and relevant variants for geosciences,”
Computers & Geosciences, vol. 31, no. 2, pp. 155 – 163,2005,
geospatial Research in Europe: AGILE 2003.
[11] P. Agarwal and A. Skupin, Eds., Self-Organising Maps:
Applications in Geographic InformationScience.Wiley,2008.
[12] D. Guo, J. Chen, A. M. MacEachren, and K. Liao, “A
visualization system for space-time and multivariate
patterns (VIS-STAMP),” IEEE Transactions on Visualization
and Computer Graphics, vol. 12, no. 6, pp. 1461–1474, 2006.
[13] A. R. Zamir and M. Shah. Image geo-localization based
onmultiplenearest neighbor feature matching using
generalizedgraphs. TPAMI, 2014.
[14] C. Zhang, J. Gao, O. Wang, P. Georgel, R. Yang, J. Davis, J.
Frahm, and M. Pollefeys. Personal photograph enhancement
using internet photo collections.TVCG, 2014.](https://image.slidesharecdn.com/irjet-v5i3780-190204040745/75/IRJET-Efficient-Geo-tagging-of-images-using-LASOM-3-2048.jpg)

This document presents a new algorithm called Location Aware Self-Organizing Map (LASOM) for efficient geo-tagging of images. LASOM is an unsupervised clustering algorithm that learns the similarity graph between different geographical regions. The goal of LASOM is to select key features in specific locations to increase geo-tagging accuracy while reducing computational requirements. It demonstrates that LASOM preserves important visual information and provides context of visual similarities between regions. LASOM results in minimal information loss compared to k-Nearest Neighbor methods and allows superior performance when combining multiple features due to its noise reduction property.

![[IJET-V1I3P9] Authors :Velu.S, Baskar.K, Kumaresan.A, Suruthi.K](https://cdn.slidesharecdn.com/ss_thumbnails/ijet-v1i3p9-150603165341-lva1-app6892-thumbnail.jpg?width=640&height=640&fit=bounds)