1. IRB I
Infrastruct
ture Develo
opers Ltd.
Q1FY Results Update
Y13 s Aug 07, 20
012
Key S
Stock Data IRB Infrastructur Developers Ltd, one of the large and mos experienc
re est st ced
BOT players in th country has posted Q
he Q1FY13 result above our expectation
ts r n.
Sector Infra
CMP `125.1 For Q
Q1FY13, IRB has posted a good set of number abov our and street expectatio
ve on.
52wk High/Low `210.1/10
00.1 Top-lline grew mu
uch higher th
han expectat tion led by s
strong execution in ongoing
Marke Cap
et `41.58bn proje
ects.
($751.9mn)
6m Av daily vol
vg. 3888272 Executive Sum
mmary
BSE S
Sensex 17412.3
Reco ‘Buy’ Healthy quar
H rterly results Consolidated Revenue grew 22.3 to `979.8
s: es 3% 8Cr
Targe Price
et `167.1 YoY and 15.5 QoQ. Ope
Y 5% erating margins grew 29.2 YoY and 11.7% QoQ to
2% Q
Stock Codes
k `425.5Cr. How
` wever, PAT grew 5.7% Y YoY and 17.9 QoQ to `
9% `141.8Cr. The
ere
Bloom
mberg Codes: IRB IN w expansion of 231 bps in operating margins to 43
was 3.4% where a contraction of
as n
Reuters code: IRBI.BO 150
1 bps in PA margins. S
AT Stable input co led to ope
ost erating marigin expansion.
ns
BSE C
Code: 532947 Orderbook P
O Position: Tota Orderbook stands at `7
al k 7785Cr of wh hich `5745Cr is
r
NSE C
Code: IRB construction o
c orderbook. Th company did not bagged any order for the quar
he r rter
Face V
Value: `10
which led to reduction in orderbook to `5745Cr. T
w o There are con ncerns over t
the
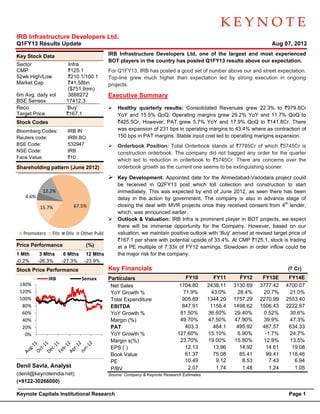
Share
eholding patt
tern (June 20
012) orderbook gro
o owth as the cu
urrent one see
ems to be ext
tinguishing so
ooner.
Key
K Development: Appointed date for the Ahmeda
r abad-Vadodara project could
be
b received in Q2FY13 post which toll collection and const
n truction to sttart
12.2% im
mmediately. TThis was exp
pected by end of June 20
d 012, as seen there has be een
4.6
6% delay in the a
d action by govvernment. Th company is also in ad
he dvance stage of
15.7% 67.5% closing the de with MVR projects onc they receiv consent from 4th lend
c eal R ce ved der,
which, was an
w nnounced earrlier.
Outlook & Va
O aluation: IRB Infra is prom
B minent player in BOT projects, we expect
r
th
here will be immense op pportunity for the Compan However, based on o
ny. our
Pro
omoters FIIs DIIs Othe
er Publ valuation, we maintain positive outlook w ‘Buy’ arri
v with ived at revise target price of
ed e
`167.1 per share with pote
` ential upside o 33.4%. At C
of CMP `125.1, stock is trading
Price Performance (%
%) at
a a PE multip of 7.33x of FY12 earn
ple own in order inflow could be
nings. Slowdo
1 Mth 3 Mths 6 Mths 12 Mths
2 th major risk for the company.
he
-0.2% -26.3% -27.3% -23
3.9%
Stock Price Performance
k Key Financials
y s (` Cr
r)
IRB Sensex Particulars FY10 FY11 FY12 FY
Y13E FY144E
140%
% Net Sales 1704.80 2438.11
2 3130.69 37777.42 4700.07
120%
% YoY Growth %
Y 71.9% 43.0% 28.4%
2 200.7% 21.0
0%
100%
% Tota Expenditure
al e 905.89 1344.20 1757.29 22700.99 2553.40
80%
% EBITTDA 847.91 1158.4 1498.62 15066.43 2222.67
60%
% YoY Growth %
Y 81.50% 36.60%
3 29
9.40% 0.5
52% 30.6
6%
40%
% Marrgin (%) 49.70% 47.50%
4 47
7.90% 399.9% 47.3
3%
20%
% PATT 403.3 464.1 495.92 4877.57 634.33
0%
% YoY Growth %
Y 127.60%
1 15.10%
1 6.90%
6 -1.7% 7%
24.7
Marrgin s(%) 23.70% 19.00%
1 15
5.80% 122.9% 13.5
5%
EPS (`)
S 12.13 13.96 14.92 144.61 19.08
Boo Value
ok 61.37 75.08 85.41 999.41 118.46
PE 10.49 9.12 8.53 7.43
7 6.94
Denil Savla, Ana
l alyst P/BVV 2.07 1.74 1.48 1.24 1.05
(denil@
@keynoteindia.net) Source Company & K
e: Keynote Research Estimates
h
(+9122-30266000)
Keyno Capitals Institutional Research
ote Page 1
e
2. Our Analysis
Impr
rovement in e
execution of E&C busine
f ess
Project
ts Work done
Appoointed date to be received in short peri on Ahmed
o d iod dabad-Vadod dara project aand
Q4FY12 Q1 1FY13 work to start imme
k ediately. In Q
Q1FY13, as exxpected, majoority of the co
ontribution came
Deoli
Jaipur-D 55% 70% from Jaipur-Deoli and Talegao on-Amravati. E
E&C division posted highe than expect
er ted
Talegaoon-Amravati 55% 65% improovement in eexecution. 70% constructio on Jaipur-
% on -Deoli and 65 construct
5% tion
Amritsa
ar- 40% 50% on Talegaon-Amr ravati complete whereas 5 50% and 38% of the cons
% struction work is
k
Tumkur r-Chittradurg 30% 38% comp pleted on Pathankot-Amrit tsar and Tummkur-Chittradrug respectiv vely. We expect
25% growth in th E&C business in FY13 due to the execution of Ahmedaba
he e ad-
Vadoodara project to start in Q2FY13.
ss tion of `3.68C per day
Gros toll collect Cr
Gross toll collection grew by 19.2% y-o-y and to `33
y 31.8Cr in Q1FY13, prima
arily
inclus
sion and toll hike (6.0%) o Tumkur-Ch
of hitradurga. Gr
rowth on q-o- was muted to
-q d
2.6% mainly on ac
% ccount of slow
wdown in traff growth lead by slowdow in economy.
fic wn
Proje wise toll revenue grow
ect wth (` C
Cr)
Proje
ects Q1FY12 Q4FY12
Q Q1FY13 Y--o-Y Q-o--Q
TBB - 4 Mumbra 15.61 16.63 17.21
1 10
0.2% 3.5%
Kharpada 2.35 2.22 2.39 1.7% 7.7%
Naga Karmala Te
ar embhurni 3.74 3.49 2.65 -29
9.1% -24.1%
Moho Mandrup K
ol Kamptee 1.99 2.05 2.07 4.0%
4 1.0%
Pune Solapur
e 4.35 4.45 4.66 7.1%
7 4.7%
Pune Nashik
e 5.58 5.75 5.58 0.0%
0 -3.0%
Mumbai Pune 98.59 99.45 10
03.49 5.0%
5 4.1%
Than Ghodbandu
ne ur 7.04 7.79 7.90 12
2.2% 1.4%
Surat Dahisar
t 94.16 106.49 10
06.39 13
3.0% -0.1%
Bharuch Surat 33.55 37.39 38.15
3 13
3.7% 2.0%
Tumk Chitradurg
kur ga 11.40 37.70 41.30
4 262
2.3% 9.5%
Gros Toll Reven
ss nues 278.4 323.4 331.8
3 19
9.2% 2.6
6%
Less: Government Share 42.01 66.80 80.37
8 91
1.3% 20.3
3%
Net T Revenue
Toll es 211.49 256.60 25
51.42 18
8.9% -2.0%
Sourc Company a Keynote Ca
ce: and apitals Institutio
onal Research
Rese in Interest rates:
et
There was revision in the in
e nterest rate f Surat-Dah
for hisar and Bh
haruch-Surat to
floating rate of 11.5% and 10.5 respective from 12%. Overall the interest rate w
5% ely will
come down as the ECB loan of `700Cr ou of the total debt where th interest rates
e ere ut he
are lo
ower as comp pared to the d
domestic loan
ns.
Toll c
collection fro Kolhapur City project is yet to be started
om r e
The t collection from Kolhao city would start only in Q2FY13 as expected. T
toll n our d n s The
s r revenue in the range of `35-40Cr.
Company expects first full year operational r e
Keyno Capitals Institutional Research
ote Page 2
3. terly Results P&L
Quart s (` Cr)
)
Partic
culars Q1FY12
Q Q4
4FY12 Q1FY13 Y-o-Y
Y Q-o-
-Q FY11 FY12
2 Y-o-Y
Net Saales 801.33
8 84
48.00 97
79.78 22
2.3% 15.5
5% 2438.11 3130.69
9 28.4%
Total Expenditure 471.89
4 467.14 55
54.30 17
7.5% 18.7
7% 1344.19 1757.21 30.7%
PBIDT (Excl OI)
T 329.44
3 380.86 42
25.48 29
9.2% 11.7
7% 1093.92 8
1373.48 25.6%
Other Income 28.21 33.18 32.48
3 15
5.1% -2.1% 64.49 125.22
2 94.2%
Operaating Profit 357.65
3 414.04 45
57.96 28
8.0% 10.6
6% 1158.41 1498.70
0 29.4%
Interest 117.43
1 14
49.96 15
54.02 31
1.2% 2.7
7% 357.21 550.50
0 54.1%
PBDT T 240.22
2 264.08 30
03.94 26
6.5% 15.1% 801.20 948.20
0 18.3%
Depreeciation 60.23 101.56 10
08.60 80
0.3% 6.9
9% 225.36 297.01 31.8%
PBT 179.99
1 162.52 19
95.34 8.5%
8 20.2% 575.84 651.19
9 13.1%
Tax 44.26 45.17
4 55.68
5 25
5.8% 23.3
3% 111.75 155.19
9 38.9%
PAT 135.73
1 117.35 13
39.66 2.9%
2 19.0
0% 464.09 496.00
0 6.9%
Less Minority Inte
erest 1.56 -3.00 -2.18
- -239
9.7% -27.3
3% 11.71 0.01 -99.9%
Net P
PAT 134.17
1 12
20.35 14
41.84 5.7%
5 17.9
9% 452.38 495.99
9 9.6%
Source Company an Keynote Cap
e: nd pitals Institution Research
nal
Partic
culars Q1FY12
Q Q4
4FY12 Q1F
FY13 Y-o
o-Y Q-o-
-Q FY11
1 FY12 Y-o-Y
EBIDT Margins
TA 41.11%
4 44
4.91% 43.
.43% 231 bps ‐150 bps 44.87%% 43.87% 100bps
PAT MMargins 16.74%
1 14
4.19% 14.
.48% ‐227 bps 28 bps 18.55%% 15.84% 271bps
EPS ((Annualized) 16.15 14.48 17.07
1 13.611 14.92
CMP 126.00 126.00
1 12
26.00 113.055 113.05
PE 7.80 8.70 7.38 8.31
1 7.58
Source Company an Keynote Cap
e: nd pitals Institution Research
nal
Acqu
uisition of MV Infra & To
VR ollways Ltd – Operationa BOT
al
MVR Infra acqusit
R tion was annoounced in the last quarter. Out of five lenders of MVR
R
pproved yet and remaining one is expec
Infra, four have ap
, g cted shortly. IRB expects
to complete the accquisition process during 2
2QFY2013.
Goa Kundapur
For the recently bagged Goa K Kundapur proj ject IRB is aw
waiting for LO from NHAI
OA I.
As thhere were on two bidders the bid has to go to the Board for approval
nly o l.
Thereefore it is not considered in orderbook.
n
Con
ncerns & R
Risks
Slow
wdown in Ord Inflow:
der
The c
company’s co rderbook stan at `5745C executable over next 2-3
onstruction or nds Cr 3
years The execu
s. ution is going at faster p
g pace. If such pace contin
nued then the
e
comppany may hav shortfall of orders.
ve f
Prommoters Allege for Murde Case:
ed er
Any update on th murder ca probe on Promoters i yet to com which may
he ase is me y
affec the company’s performance. Howev
ct ver, the prom
moter is read to undergo
dy o
polyg
graph test.
Keyno Capitals Institutional Research
ote Page 3
4. Valu
uations:
We h have valued the company on SOTP me ethodology. A BOT projec are valued
All cts d
separately on FCFE basis, EP business o PE multip and land b
PC on ple bank on Bookk
value We have not valued it Sindhadurg Airport pro
e. ts oject, Integrat
ted Township
p
Deve elopment projject and Hote business a these are a very nasce stage and
el as at ent d
we la of clarity a well. With given the expected growth in revenue & earnings a
ack as at
the ra of 25.2% & 21.0% for the year FY1
ate 13E & FY14E respectively we arrive a
E y, at
fair value of `167.17 per s share. We maintain pos sitive outlook with ‘Buyy’
recommmendation cconsidering th potential u
he upside of 33.4
4%.
Cost of Value per
Proj
jects Valuation NPV
Equity share
Than Biwandi By
ne ypass FCFE 14.4% 240.7 7.2
Kharpada FCFE 14.4% 27.5 0.8
Naga - Karmala - Tembhurni
ar FCFE 14.4% 48.6 1.5
Moho kurul- Man
ol- ndrup FCFE 14.4% 42.1 1.3
Pune Solapur
e- FCFE 14.4% 88.7 2.7
Pune - Nashik
e FCFE 14.4% 148.8 4.5
Mum
mbai – Pune FCFE 14.4% 748.0 22.5
Than - Godbandur
ne FCFE 14.4% 110.8 3.3
Bharuch - Surat FCFE 14.4% 462.7 13.9
Surat – Dahisar
t FCFE 14.4% 143.8 4.3
Kolha
apur City FCFE 16.3% 63.7 1.9
Patha
ankot – Amrit
tsar FCFE 16.3% 127.2 3.8
Jaipu – Deoli
ur FCFE 16.3% 330.7 9.9
Taleg
gaon – Amrav
vati FCFE 16.3% 82.8 2.5
Tumk – Chitradu
kur urg FCFE 16.3% 544.9 16.4
Total of BOT 3210.9 96.6
EPC P/E 6x 2183.9 65.7
Land Bank
d BV 1x 158.4 4.8
Total 5553.1 167.1
Keyno Capitals Institutional Research
ote Page 4
5. olidated P&L
Conso L `Cr)
(` Conso
olidated Ratios
Particulars FY10 FY
Y11 FY12 FY13E FY1
14E Turnov Ratios
ver FY10 FY11 FY12 FY13E FY1
14E
Net Sa
ales 1704.8 243
38.1 3133.0 3920.5 474
44.0
Total A
Assets Turnover 0.3 0.4 0.
.4 0.4 0.5
Total E
Expenses 905.8 134
44.2 1763.7 2331.7 264
41.5
Fixed A
Assets Turnove
er 0.4 0.4 0.
.4 0.5 0.5
PBIDT (Excl OI)
T 799.0 109
93.9 1369.4 1588.8 210
02.5
Other Income 48.9 64.5
6 125.2 101.5 11
15.0 Net sales to net WC 2.6 -10.5 36.
.3 9.0 7.2
ating Profit
Opera 847.9 115
58.4 1494.6 1690.3 221
17.5
Net Wo
orking Capital D
Days 142.6 -34.9 10.
.1 40.6 5
50.5
Interes
st 249.4 35
57.2 546.4 629.5 74
41.7
Invento Turnover
ory 10.0 14.9 19.
.3 18.0 2
22.0
PBDT 598.5 80
01.2 948.2 1060.8 147
75.8
Deprec
ciation 181.9 22
25.4 297.0 330.7 62
20.4 Invento Days
ory 36.4 24.5 18.
.9 20.3 1
16.6
PBT 416.6 57
75.8 651.2 730.2 85
55.4
Advanc Turnover
ces 3.9 5.7 6.
.4 5.6 6.1
Tax 13.3 111.7 155.2 160.3 24
46.0
403.3 64.1
46 496.0 569.8 60
09.4 Advanc Days
ces 93.8 64.2 56.
.8 65.0 6
60.0
Profit After Tax
% of S
Sales 23.7% 19.
.0% 15.8% 14.5% 12.8% Debtors Turnover
s 57.4 61.5 222.
.7 146.0 24
43.3
Growth (%)
h 127.6% 15
5.1% 6.9% 14.9% 6.9%
6
Debtors Days
s 6.4 5.9 1.
.6 2.5 1.5
olidated Balan Sheet
Conso nce (`
`Cr) Credito Turnover
ors 5.7 0.7 0.
.7 0.9 0.9
Particu
ulars FY10 FY11
F FY12 FY13E FY1
14E 63.9 525.2 492.
.6 413.0 38
86.7
Credito Days
ors
Net-wo
orth 2039.9 24
432.6 2856.7 3415.2 401
13.3 Valuati
ion Ratios (x) FY10 FY11 FY12 FY13E FY1
14E
Minorit Interest
ty 77.9 89.6 112.3 118.0 13
34.0
26.7 23.2 25.9 27.2 33.4
3 EPS (x) 12.1 14.0 14.9 17.1 18.3
Deferre Liabilities
ed
Total D
Debt 2915.2 369.0
33 5464.9 5946.9 634
47.3 Book V
Value Per Share 61.4 73.2 85.9 102.7 12
20.7
Total L
Liabilities 5059.7 59
914.4 8459.7 9507.3 1052
28.1
PE ( x
x) 10.4 9.1 8.5
5 7.4 6
6.9
Total F
Fixed Assets 4347.6 58
869.6 7999.5 8401.6 906
63.4
P/BV (x)s 2.1 1.7 1.5
5 1.2 1
1.0
Investm
ments 45.1 55.1 14.0 20.0 22.0
2
Cash a Bank
and 510.2 200.0
12 1820.8 2150.6 245
59.6 EV/EB
BIDTA (x) 7.8 5.7 4.4 3.9 3.0
Net Cu
urrent Assets 666.1 -2
232.9 86.4 435.7 65
56.2 Marke Cap/Sales (x
et x) 2.5 1.7 1.4 1.1 0.9
Other A
Assets 0.0 222.7
2 359.9 650.0 78
86.5
Return Ratios (%)
n FY10 FY11 FY12 FY13E FY1
14E
Total A
Assets 5059.7 59
914.4 8459.7 9507.3 1052
28.1
ROCE 13.2% 15.8% 14.2% 14.3% 15.
% .2%
Book V
Value 61.37 73.18
7 85.94 102.74 120
0.74
ROE 19.8% 19.1% 17.4% 16.7% 15.
% .2%
Conso
olidated Cas Flow
sh `Cr)
(`
Margin (%)
ns FY10 FY11 FY12 FY13E FY1
14E
Particu
ulars FY10 FY11
F FY12 FY13E FY1
14E
PBT 416.6 575.8
5 651.2 730.2 85
55.4 PBIDTA
A 49.7% 47.5% 47.9% 43.1% 46.
% .7%
Add: D
Depreciation 181.9 225.4
2 297.0 330.7 62
20.4 PBT 24.4% 23.6% 20.8% 18.6% 18.
% .0%
Add: In
nterest 214.4 257.3
2 399.9 527.9 74
41.7
PAT 23.7% 19.0% 15.8% 14.5% 12.
% .8%
Less: T Paid
Tax 81.2 146.3 158.7 160.3 246
6.00
Cash f
from Operatin
ng 903.3 10
069.8 1110.3 1464.3 207
78.0 Other R
Ratios FY10 FY11 FY12 FY13E FY1
14E
Cash f
from Investing -1022.3 -23
g 372.8 -2672.9 -3200.0 -355
58.5 Payout Ratio (%) 12.4% 10.7% 21.4% 11.7% 10.
% .9%
Cash f
from Financin
ng 142.6 13
341.1 1757.9 1850.0 165
50.0 Interest Cover (x)
t 2.7 2.6 2.
.2 2.2 2.2
Net Ca Flow
ash 23.6 38.1 195.3 114.3 16
69.5
EPS Growth (%) 127.6% 15.1% 6.9% 14.9%
% 6.
.9%
Openin Cash
ng 98.8 122.4 160.5 355.8 47
70.0
Closin Cash
ng 122.4 160.5
1 355.8 470.0 63
39.6 PEG (%
%) -56.1% -13.1% -6.4% -13.0%
% -6.
.5%
(E: Key
ynote Capitals Institutional Re
esearch Estima
ates)
Keyno Capitals Institutional Research
ote Page 5
6. Institution Equity Team
nal
Rakesh Chaudhary (CEO ) rakesh@keynote
ecapitals.net +91
+ 22 30266000
Analy
ysts / Associa
ates
Denil Savla de
enil@keynotein
ndia.net +9 22 3026 6060
91
Deep Kolhe
pak de
eepak@keynot
tecapitals.net +9122 3026 6058
+
Rohan Admane ro
ohan@keynote
eindia.net +9 22 2269 6059
91
Rajes Sinha
sh ra
ajesh@keynote
ecapitals.net +91
+ 22 30266058
Mamt Singh
ta mamta.singh@k
m keynotecapitals
s.net +91 22 3026 6060
Technical Analyst
Sanja Bhatia
ay sa
anjay@keynote
ecapitals.net +91 22 3026 6047
Dealing / Sales
Nilesh Dhruv
h nil
lesh@keynotei
india.net +91 22 3026 6040
KEYNO
OTE CAPITA
ALS LTD.
Member
Stock Exchang Mumbai (IN 010930556)
ge, NB )
Nation Stock Excha
nal ange of India L (INB 23093
Ltd. 30539)
Over the Counter Exchange of India Ltd. (INB 2009
930535)
Central Depository Se
ervices Ltd. (IN-DP-CDSL-1522-2001)
Address
The Ruby, 9th F
T Floor, Senapati Bapat Marg, D
Dadar (W), Mumbai – 400 028
Tel. : +9122-302666000 • www.keeynotecapitals.c
com
DISCL LAIMER
• This report has been prepared and issued by Keyn
s d note Capitals Limited, based so olely on public innformation and sources believe to be reliable
ed e.
• Neith the informat
her tion nor any opinion expressed herein, constitu
d utes an offer, or an invitation to make an offer, to buy or sell a securities or any
r o , any r
option futures or oth derivatives related to such securities and a
ns, her also for the purp
pose of trading aactivities.
• Keyn note Capitals Limited makes no guarantee, re
n epresentation or warranty, exp press or implied and accepts no responsibility or liability as to the
o o
accuracy or complete eness or correct tness of the info
ormation in this report.
• Keynote Capitals a its affiliates and their respe
and ective officers, d
directors and employees may hold positions in any securitie mentioned in this
es n
Repor (or in any rela
rt ated investment) and may from time to time add to or dispose of any securitie or investment
es ts.
• Keyn note Capitals m also have pr
may roprietary tradin positions in securities covere in this report or in related ins
ng ed struments.
• An a affiliate of Keyn
note Capitals Limited may also perform or se to perform broking, investment banking a
o eek and other bank king services for the
company under cove erage.
• If ‘Bu ‘Sell’, or ‘Ho recommend
uy’, old’ dation is made in this Report, such recommend dation or view o opinion expre
or essed on investm ments in this Re
eport
is not intended to co
t onstitute investm
ment advice and should not be intended or t treated as a substitute for nec cessary review or validation or any
r
profes ssional advice. The views exp pressed in this Report are tho of the analy which are s
ose yst subject to chang and do not represent to be an
ge
authority on the subje Keynote Ca
ect. apitals may or m not subscrib to any and/ o all the views e
may be or expressed herei in.
• The opinions presen nted herein are liable to change without any no
e otice.
• Thou due care ha been taken in the preparatio of this report, Keynote Capit
ugh as n on , tals limited or an of its director officers or em
ny rs, mployees shall b in
be
any w be responsib for any loss arising from the use thereof.
way ble e
• Investors are advise to apply their judgment befo acting on the contents of this report.
ed r ore e
• This report or any p
s portion hereof may not be reprin
m nted, sold or reddistributed witho the written co
out onsent of Keyno Capitals Lim
ote mited.
Keyno Capitals Institutional Research
ote Page 6