Iran nuke saga uk ez in update brief note
•
0 likes•1,705 views
Iran Nuke Deal, UK economic Update, Global Economic Update, EZ Economic Update, India Economic Update, India Iran Oil Import
Report
Share
Report
Share
Download to read offline

Recommended
Daily mcx newsletter 19 dec 2013
The document provides a daily newsletter on commodities including gold, silver, copper, crude oil, and natural gas. It notes that prices of gold and silver dropped as the US Federal Reserve announced a tapering of its bond-buying stimulus program. Copper surplus is expected to widen in 2014 due to increased production. Crude oil and natural gas prices are consolidating with strategies to buy on dips provided.
The real television
The document discusses television usage statistics in the United States. It states that the average American watches over 4 hours of TV per day, totaling over 9 years of TV watching in a lifetime. It provides data on TV ownership and viewing habits, such as the average household having 2 TV sets on for 6.5 hours per day, and two-thirds of Americans watching TV during dinner. The document examines the economic impact of this TV viewing, valuing the hours watched annually at over $1.25 trillion based on average wages.
Raleigh, north carolina
This document compares the monthly budgets of two individuals, Julian and Max, living in Raleigh, North Carolina. It outlines their incomes, housing costs, healthcare premiums, utilities, food, transportation, and other expenses. While Julian has a higher salary of $60,000, Max is able to save more each month with a salary of $45,000 due to lower housing and transportation costs. The document concludes that budgeting and prioritizing expenses is important for living a stable financial life.
Crude oil prices analysis
- Brent crude oil spot prices decreased by $3/b to $74/b in June, though it was the third consecutive month averaging over $70/b. The price decline was driven by expectations that OPEC and other producers would increase supply.
- Crude oil production in India during June 2018 was 3.17% lower than target and 3.39% lower than June 2017. Production during April-June 2018 was also lower than target and the previous year.
- While oil prices reached record highs in 2008 and were over $100/b in 2014, prices approaching $270/b by 2020 now seem unlikely due to increased shale oil production. However, as people adapt, higher prices than
2010 Fuel Outlook
According to data from the Energy Information Administration's Short-Term Energy Outlook, the average cost of diesel fuel in 2009 was $2.46 per gallon. Their estimate for the average cost of diesel fuel in 2010 is $2.84 per gallon, representing an estimated fuel inflation rate of 15.44% over 2009 prices. The data was prepared by Michael Hudson from the cited source and contact information.
Gold performance and outlook
Gold prices plunged to $1293.80 due to a large sell order that overwhelmed the market on the last day of the month. The decline in gold appeared isolated, as other markets were stable or rising. The report recommends selling gold below $1380, with targets of $1275 and $1255. Technical analysis identifies $1280 as a pivotal price that could determine short-term direction, with an immediate test of this level expected.
Global Financial Forecast
The document provides a global economic forecast for 2011. It notes that GDP growth softened in Q1 due to higher gas prices negatively impacting consumer spending and confidence. While job growth was strong in the first two months of the year, it weakened in May, raising doubts about further hiring. The forecast assumes current economic weakness is a temporary issue and growth will pick up in the second half of the year. Fiscal tightening and household deleveraging will limit medium-term growth.
Jim Williams, WTRG
The document discusses global LNG trade and supply sources. It notes that total world LNG imports are currently 33.5 Bcf/day, with Asia accounting for 23.4 Bcf/day, led by Japan at 10.5 Bcf/day. It also lists the major LNG exporters, including Qatar at 10.1 Bcf/day, Australia at 5.5 Bcf/day, and Indonesia at 2.1 Bcf/day. The US currently exports 0.4 Bcf/day but export capacity is expected to triple in the next two years.
Dealth of dollar How real it is - Rupesh Gaikwad, Shreyak Shah, Suvrat Dayal,...
The US dollar declined in value for several reasons, including the Vietnam War, doubts in international markets, and countries needing dollar reserves to purchase oil from OPEC after 1971. Iraq later started selling oil in euros instead of dollars. While the US invasion of Iraq in 2003 reversed this change, the dollar has continued sliding due to concerns over the large US budget deficit and trade imbalance. Foreign purchases of US treasury securities and stocks have helped stabilize the dollar since early 2009, though its value remains dependent on global risk appetite and returns on dollar-denominated assets.
Construction Realtor Flyer
This document provides information about U.S. Bank's construction to permanent financing program for real estate agents, including expanding to 90% LTV. It offers one closing, disbursement of construction funds, interest only payments during construction, and modification to a fully amortizing ARM upon completion. Eligible properties and LTVs are listed for primary residences up to $3 million and second homes up to $1.5 million. The agent states their experience in construction financing and readiness to explain U.S. Bank's product options.
Daily mcx report
Gold prices ended marginally higher despite rising earlier in the session as equities gained, diminishing demand for safe haven assets. However, gold was supported by concerns about global growth and potential US interest rate cuts. Crude oil prices increased over 1.9% due to expectations of lower US inventories and ongoing OPEC+ production cuts supporting prices through 2020. Base metal prices were mixed with nickel gaining the most as weak global manufacturing data dampened demand, though no new US-China tariffs eased slowdown concerns.
Mcx daily report 14 aug
Gold prices fell below $1,200 per ounce for the first time since March 2017 as the strengthening US dollar boosted demand for safe-haven assets. Copper prices continued to be pressured by the threat of strike action at some of the world's largest copper mines. Nickel prices were expected to continue their weak performance as LME nickel lost gains from the previous week. Oil prices dipped due to concerns over the broader economic impact of Turkey's currency crisis and rising US dollar, though sanctions on Iran provided some support.
Inflation watch 10.25.11
While some prices declined in August and September, inflation remains a concern. Consumer prices are rising for many necessities like food, housing, and transportation. While overall inflation is within the target range of 1-2% and 2-4%, some prices are increasing at a considerable rate and approaching the upper bounds of those ranges. The Federal Reserve must balance keeping interest rates low to stimulate the economy with raising them to combat inflation.
Recent news..
The document contains summaries of recent news articles:
1) The Indian government plans to give more funds to Rural Regional Banks and treat them equally to commercial banks.
2) The Planning Commission favors a uniform gas price for power and fertilizer sectors, contrary to an independent recommendation for different prices.
3) There is an urgent need for clarity on new banking rules to avoid prolonged uncertainty that could harm the global economic recovery.
4) The EPFO declared a 9.5% return on employees' provident funds for 2010-2011, leaving expectations behind but giving employees a higher return than previous years.
Commodity Markets Analysis & Updates
Gold gained as the dollar declined, making gold more attractive as a safe haven investment. Trading may remain volatile ahead of the upcoming Federal Reserve meeting. Crude oil traded near $82/barrel as a weaker dollar boosted commodity demand, while an unexpected drop in US gasoline stockpiles also provided support. Copper rebounded from recent losses as the dollar resumed its decline, and on concerns about potential supply disruptions at a major Chilean copper mine.
April 9 | Session 1 | GBIH
This document discusses historical gold prices and provides predictions for future prices. It analyzes factors that influence gold prices like inflation, currency fluctuations, and interest rates. The document predicts gold prices will continue rising in 2021 and beyond due to monetary stimulus increasing inflation and weakening currencies. Analysts expect gold to act as a hedge against volatility and inflation. While gold saw record highs in 2020, some technical indicators now point to a potential trend reversal in the near future.
Inflation Watch: November 2011
- Inflation moderated or declined in October for measures like the consumer price index, gold prices, and producer price indexes, though prices remain higher than a year ago.
- While overall and core consumer prices remain within the Fed's target range of 1-2% and 2-4% respectively, they are approaching the upper bounds.
- The relaxation in price growth in October means the Fed will likely continue its low-rate policy committed through mid-2013.
Weekly news 7
1) Regulators must provide clarity on new banking rules urgently to avoid prolonged uncertainty that could hamper economic recovery.
2) The Planning Commission has recommended a uniform gas price for power and fertilizer sectors, contrary to another recommendation for different rates.
3) The Indian government plans to allocate more state funds to Rural Regional Banks to boost their business.
Debt crisis
The US debt crisis arose from a lack of economic growth following the 2008 financial crisis, leading to widening gaps between government outlays and revenues. By 2011, the debt exceeded $14 trillion and approached the debt ceiling, risking default. To address this, Congress agreed to raise the ceiling while implementing plans to increase taxes and cut over $1 trillion in spending. Currently, the US debt totals over $15 trillion and foreign countries like China and Japan own large portions, with China owning over $1 trillion in treasury bonds.
Lending in 2010
The presentation talks about some of the recent and upcoming changes in Real Estate and Mortgage Industry.
An Overview of The 2020 Long-Term Budget Outlook
The document is a presentation by the Congressional Budget Office (CBO) Director Phillip L. Swagel to the Prosperity Caucus on October 1, 2020 providing an overview of the CBO's 2020 Long-Term Budget Outlook. The presentation examines projections for federal debt levels and the budget deficit through 2050 under current policies and explores the size of policy changes needed to reduce debt to certain targets. It also analyzes the impact on debt projections of varying assumptions around factors like population growth, economic growth, spending levels, and interest rates.
Daily comex report of 21 september 2017 by epic research
Epic Research is a leading financial advisory firm. We offer various financial services and a daily report on different segments of market. So that the traders and investors can get the overview of market's performance and updates.
Gaurapad loyalty promo event
This document outlines the eligibility and qualification requirements for two categories of a promotion. Category 1 is for directors levels 1-3, where participants must have received an advancement award as a director by June 2014 and maintain the director level for 3 consecutive months from August to November. Category 2 is for ambassador level 1 and above, where participants must have received an advancement award at the ambassador level or higher and maintain that level for 3 consecutive months from August 2014 to January 2015. The terms and conditions specify requirements like providing a valid visa one month before international travel and that prizes are subject to availability and may differ from pictures shown.
Daily mcx newsletter 25 apr 2014
Are you in search of Profitable Mcx tips? So you have land to the right place. We assure you about the excellent quality of tips and profit earning strategy. Which help you in earning more profit so fill free trial form!!
Eagle Newsletter Q4-2016
The document summarizes Eagle Equity Holdings' Q4 2016 report on their Energy Fund II. It discusses:
- OPEC and non-OPEC members agreeing in late 2016 to cut oil production, the first cut since 2008, which supported oil prices.
- Natural gas stocks exceeding expectations due to a late start to winter, though prices remained volatile depending on weather.
- Outlook for 2017 remains positive if OPEC cuts are maintained and weather continues impacting natural gas prices, while President-elect Trump's pro-energy cabinet is also bullish for the industry.
Fiscal sustainability reporting by the US government - Regina Kearney, United...
This presentation was made by Regina Kearney, United States, at the 15th Annual OECD Public Sector Accruals Symposium held in Paris on 26-27 February 2015.
Effects of Decreased Oil Price- Final Report
The document discusses the effects of the recent decline in oil prices on different regions and countries. It finds that net oil exporting nations like those in Africa will see decreased revenues, currency devaluations, and limitations on public spending and GDP growth. Gulf states are generally better prepared to handle low prices due to sovereign wealth funds. Europe benefits as a net oil importer with lower costs. Russia is negatively impacted due to its heavy reliance on oil revenues.
Krause Fund
Enterprise Products Partners L.P. is the largest publicly traded energy partnership in the United States. They operate over 51,000 miles of pipelines transporting natural gas, NGLs, crude oil and petrochemicals. Analysts expect EPD to benefit from increased domestic energy production and have ongoing capital projects. Based on a discounted cash flow valuation, analysts value EPD at $41.43 and have placed a BUY rating due to the current price of $37.40 being undervalued.
EY Price Point 8.17.20
The sustainability of trading profits has always been questioned. Volatility has returned to pre-crisis levels and, absent more disruption, the size of the opportunity will shrink.
See this week's edition of EY Price Point
EY Price Point: global oil and gas market outlook
As the last quarter of the second pandemic year draws to a close, we continue to see heightened contrast
between the medical and economic points of view. While COVID-19 cases are close to their all-time highs, so
are equity prices, and a leading investment bank declared (on 2 December, 2021 after the Omicron outbreak in South Africa) that it was “optimistic about the possibility of a vibrant 2022.” When news of the variant hit in
late November, the markets were rocked by the prospect of yet another round of local mobility restrictions and
an interrupted return to normal international travel patterns, on top of the Biden Administration’s announced
release of 50 million barrels of crude from the US Strategic Petroleum Reserve. So far though, with OPEC
standing by its planned gradual return to normal production, oil prices have stabilized, albeit below where they
were in mid-November. Henry Hub prices, always at the mercy of the weather, responded predictably to a
warmer-than-normal early winter in the US, falling from US$6.60/MMBtu in early October to below
US$4.00/MMBtu by mid-December. In Europe and Asia, following a short reprieve at the start of the quarter,
piped natural gas prices have spiked again on concerns triggered by Russian troop buildups on the Ukraine
border and uncertainties surrounding the Nordstream 2 pipeline. Looking forward, OPEC and the U.S. Energy
Information Administration (EIA) in their last forecasts of the year both projected that 2022 oil demand would
be above what we saw in 2019. Although time will tell if those forecasts are realized and other events could
intervene, the response to new virus outbreaks is well-practiced and the trade-off between public health and
economic reality has tipped toward a cautiously optimistic view.
More Related Content
What's hot
Dealth of dollar How real it is - Rupesh Gaikwad, Shreyak Shah, Suvrat Dayal,...
The US dollar declined in value for several reasons, including the Vietnam War, doubts in international markets, and countries needing dollar reserves to purchase oil from OPEC after 1971. Iraq later started selling oil in euros instead of dollars. While the US invasion of Iraq in 2003 reversed this change, the dollar has continued sliding due to concerns over the large US budget deficit and trade imbalance. Foreign purchases of US treasury securities and stocks have helped stabilize the dollar since early 2009, though its value remains dependent on global risk appetite and returns on dollar-denominated assets.
Construction Realtor Flyer
This document provides information about U.S. Bank's construction to permanent financing program for real estate agents, including expanding to 90% LTV. It offers one closing, disbursement of construction funds, interest only payments during construction, and modification to a fully amortizing ARM upon completion. Eligible properties and LTVs are listed for primary residences up to $3 million and second homes up to $1.5 million. The agent states their experience in construction financing and readiness to explain U.S. Bank's product options.
Daily mcx report
Gold prices ended marginally higher despite rising earlier in the session as equities gained, diminishing demand for safe haven assets. However, gold was supported by concerns about global growth and potential US interest rate cuts. Crude oil prices increased over 1.9% due to expectations of lower US inventories and ongoing OPEC+ production cuts supporting prices through 2020. Base metal prices were mixed with nickel gaining the most as weak global manufacturing data dampened demand, though no new US-China tariffs eased slowdown concerns.
Mcx daily report 14 aug
Gold prices fell below $1,200 per ounce for the first time since March 2017 as the strengthening US dollar boosted demand for safe-haven assets. Copper prices continued to be pressured by the threat of strike action at some of the world's largest copper mines. Nickel prices were expected to continue their weak performance as LME nickel lost gains from the previous week. Oil prices dipped due to concerns over the broader economic impact of Turkey's currency crisis and rising US dollar, though sanctions on Iran provided some support.
Inflation watch 10.25.11
While some prices declined in August and September, inflation remains a concern. Consumer prices are rising for many necessities like food, housing, and transportation. While overall inflation is within the target range of 1-2% and 2-4%, some prices are increasing at a considerable rate and approaching the upper bounds of those ranges. The Federal Reserve must balance keeping interest rates low to stimulate the economy with raising them to combat inflation.
Recent news..
The document contains summaries of recent news articles:
1) The Indian government plans to give more funds to Rural Regional Banks and treat them equally to commercial banks.
2) The Planning Commission favors a uniform gas price for power and fertilizer sectors, contrary to an independent recommendation for different prices.
3) There is an urgent need for clarity on new banking rules to avoid prolonged uncertainty that could harm the global economic recovery.
4) The EPFO declared a 9.5% return on employees' provident funds for 2010-2011, leaving expectations behind but giving employees a higher return than previous years.
Commodity Markets Analysis & Updates
Gold gained as the dollar declined, making gold more attractive as a safe haven investment. Trading may remain volatile ahead of the upcoming Federal Reserve meeting. Crude oil traded near $82/barrel as a weaker dollar boosted commodity demand, while an unexpected drop in US gasoline stockpiles also provided support. Copper rebounded from recent losses as the dollar resumed its decline, and on concerns about potential supply disruptions at a major Chilean copper mine.
April 9 | Session 1 | GBIH
This document discusses historical gold prices and provides predictions for future prices. It analyzes factors that influence gold prices like inflation, currency fluctuations, and interest rates. The document predicts gold prices will continue rising in 2021 and beyond due to monetary stimulus increasing inflation and weakening currencies. Analysts expect gold to act as a hedge against volatility and inflation. While gold saw record highs in 2020, some technical indicators now point to a potential trend reversal in the near future.
Inflation Watch: November 2011
- Inflation moderated or declined in October for measures like the consumer price index, gold prices, and producer price indexes, though prices remain higher than a year ago.
- While overall and core consumer prices remain within the Fed's target range of 1-2% and 2-4% respectively, they are approaching the upper bounds.
- The relaxation in price growth in October means the Fed will likely continue its low-rate policy committed through mid-2013.
Weekly news 7
1) Regulators must provide clarity on new banking rules urgently to avoid prolonged uncertainty that could hamper economic recovery.
2) The Planning Commission has recommended a uniform gas price for power and fertilizer sectors, contrary to another recommendation for different rates.
3) The Indian government plans to allocate more state funds to Rural Regional Banks to boost their business.
Debt crisis
The US debt crisis arose from a lack of economic growth following the 2008 financial crisis, leading to widening gaps between government outlays and revenues. By 2011, the debt exceeded $14 trillion and approached the debt ceiling, risking default. To address this, Congress agreed to raise the ceiling while implementing plans to increase taxes and cut over $1 trillion in spending. Currently, the US debt totals over $15 trillion and foreign countries like China and Japan own large portions, with China owning over $1 trillion in treasury bonds.
Lending in 2010
The presentation talks about some of the recent and upcoming changes in Real Estate and Mortgage Industry.
An Overview of The 2020 Long-Term Budget Outlook
The document is a presentation by the Congressional Budget Office (CBO) Director Phillip L. Swagel to the Prosperity Caucus on October 1, 2020 providing an overview of the CBO's 2020 Long-Term Budget Outlook. The presentation examines projections for federal debt levels and the budget deficit through 2050 under current policies and explores the size of policy changes needed to reduce debt to certain targets. It also analyzes the impact on debt projections of varying assumptions around factors like population growth, economic growth, spending levels, and interest rates.
Daily comex report of 21 september 2017 by epic research
Epic Research is a leading financial advisory firm. We offer various financial services and a daily report on different segments of market. So that the traders and investors can get the overview of market's performance and updates.
Gaurapad loyalty promo event
This document outlines the eligibility and qualification requirements for two categories of a promotion. Category 1 is for directors levels 1-3, where participants must have received an advancement award as a director by June 2014 and maintain the director level for 3 consecutive months from August to November. Category 2 is for ambassador level 1 and above, where participants must have received an advancement award at the ambassador level or higher and maintain that level for 3 consecutive months from August 2014 to January 2015. The terms and conditions specify requirements like providing a valid visa one month before international travel and that prizes are subject to availability and may differ from pictures shown.
Daily mcx newsletter 25 apr 2014
Are you in search of Profitable Mcx tips? So you have land to the right place. We assure you about the excellent quality of tips and profit earning strategy. Which help you in earning more profit so fill free trial form!!
Eagle Newsletter Q4-2016
The document summarizes Eagle Equity Holdings' Q4 2016 report on their Energy Fund II. It discusses:
- OPEC and non-OPEC members agreeing in late 2016 to cut oil production, the first cut since 2008, which supported oil prices.
- Natural gas stocks exceeding expectations due to a late start to winter, though prices remained volatile depending on weather.
- Outlook for 2017 remains positive if OPEC cuts are maintained and weather continues impacting natural gas prices, while President-elect Trump's pro-energy cabinet is also bullish for the industry.
Fiscal sustainability reporting by the US government - Regina Kearney, United...
This presentation was made by Regina Kearney, United States, at the 15th Annual OECD Public Sector Accruals Symposium held in Paris on 26-27 February 2015.
What's hot (18)
Dealth of dollar How real it is - Rupesh Gaikwad, Shreyak Shah, Suvrat Dayal,...
Dealth of dollar How real it is - Rupesh Gaikwad, Shreyak Shah, Suvrat Dayal,...
Daily comex report of 21 september 2017 by epic research
Daily comex report of 21 september 2017 by epic research
Fiscal sustainability reporting by the US government - Regina Kearney, United...
Fiscal sustainability reporting by the US government - Regina Kearney, United...
Similar to Iran nuke saga uk ez in update brief note
Effects of Decreased Oil Price- Final Report
The document discusses the effects of the recent decline in oil prices on different regions and countries. It finds that net oil exporting nations like those in Africa will see decreased revenues, currency devaluations, and limitations on public spending and GDP growth. Gulf states are generally better prepared to handle low prices due to sovereign wealth funds. Europe benefits as a net oil importer with lower costs. Russia is negatively impacted due to its heavy reliance on oil revenues.
Krause Fund
Enterprise Products Partners L.P. is the largest publicly traded energy partnership in the United States. They operate over 51,000 miles of pipelines transporting natural gas, NGLs, crude oil and petrochemicals. Analysts expect EPD to benefit from increased domestic energy production and have ongoing capital projects. Based on a discounted cash flow valuation, analysts value EPD at $41.43 and have placed a BUY rating due to the current price of $37.40 being undervalued.
EY Price Point 8.17.20
The sustainability of trading profits has always been questioned. Volatility has returned to pre-crisis levels and, absent more disruption, the size of the opportunity will shrink.
See this week's edition of EY Price Point
EY Price Point: global oil and gas market outlook
As the last quarter of the second pandemic year draws to a close, we continue to see heightened contrast
between the medical and economic points of view. While COVID-19 cases are close to their all-time highs, so
are equity prices, and a leading investment bank declared (on 2 December, 2021 after the Omicron outbreak in South Africa) that it was “optimistic about the possibility of a vibrant 2022.” When news of the variant hit in
late November, the markets were rocked by the prospect of yet another round of local mobility restrictions and
an interrupted return to normal international travel patterns, on top of the Biden Administration’s announced
release of 50 million barrels of crude from the US Strategic Petroleum Reserve. So far though, with OPEC
standing by its planned gradual return to normal production, oil prices have stabilized, albeit below where they
were in mid-November. Henry Hub prices, always at the mercy of the weather, responded predictably to a
warmer-than-normal early winter in the US, falling from US$6.60/MMBtu in early October to below
US$4.00/MMBtu by mid-December. In Europe and Asia, following a short reprieve at the start of the quarter,
piped natural gas prices have spiked again on concerns triggered by Russian troop buildups on the Ukraine
border and uncertainties surrounding the Nordstream 2 pipeline. Looking forward, OPEC and the U.S. Energy
Information Administration (EIA) in their last forecasts of the year both projected that 2022 oil demand would
be above what we saw in 2019. Although time will tell if those forecasts are realized and other events could
intervene, the response to new virus outbreaks is well-practiced and the trade-off between public health and
economic reality has tipped toward a cautiously optimistic view.
Newsletter 072015 Final Volume 1 Issue 4
The document summarizes the key points of the Iran nuclear deal reached between Iran and six world powers. The deal will lift sanctions on Iran in exchange for curbing its nuclear program. This will open up Iranian oil reserves to the global market, estimated to increase supply by 500,000 barrels per day. It will also allow Iran to sell natural gas. The increased supply of oil and gas from Iran is expected to put downward pressure on prices. While the deal could face opposition, it represents a major shift in opening up Iran's economy after years of isolation.
Global Oil Outlook August 2016
Global oil supply and demand analysis for August 2016. Forecasts oil production, consumption and price for the next five years.
Robert Powell @ OMD Predicts
The document summarizes the global economic outlook following the 2008 financial crisis. It discusses different theories on the shape and strength of economic recoveries after financial crises. It then analyzes the economic situations and outlooks of various regions and countries around the world, including challenges faced by developed economies in Europe and growth prospects for emerging economies such as China, India, and countries in the Middle East.
Oil Prices in Today’s Economy
This report discusses the recent decline in oil prices and the battle between OPEC and the United States for control of the oil market. Oil prices fell from over $110 per barrel in 2014 to under $50 per barrel in early 2015 due to increased production from the U.S. and other non-OPEC countries. While lower prices benefited consumers and some economies, they hurt oil-producing countries. The U.S. has significantly increased oil production in recent years through fracking and other methods. As a result, OPEC is losing its dominance over the oil market and control over prices. The oversupply of oil from both OPEC and non-OPEC producers means prices are expected to remain low
New base special 31 july 2014
1) OPEC's oil production rose slightly in July from June, with Libya seeing the largest increase while production fell in Iraq and Angola. However, unrest in countries like Libya, Iraq, and Angola continues to affect supply.
2) Within OPEC, the largest increase came from Libya where supply rose by 210,000 barrels per day but stability remains uncertain. Saudi Arabia and Nigeria also saw small increases while Iraq's supply fell.
3) Looking ahead, declining oil prices could significantly impact Russia's economy and undermine Putin's power since Russia relies heavily on oil exports, which account for 40% of its revenues. A sustained price drop below $100 could force Russia to focus more on propping
Crude oil Report
The document provides an overview of crude oil markets including key facts, figures and country profiles. It discusses the top oil producing and consuming countries. Saudi Arabia has the largest proven reserves while the US is the top consumer. China and India are major growing consumers increasing imports to meet demand. Geopolitical and economic factors influence prices along with inventories and production from OPEC.
Newsletter 070615 Final Volume 1 Issue 2
The document discusses the impact of Greece voting "no" to accepting the latest bailout package from European creditors. It summarizes that Greece rejecting the deal has introduced uncertainty that is pressuring commodity prices lower. Specifically, it recommends staying clear of oil and product exposures while markets digest the implications of Greece and potential contagion. It also notes that China has taken actions to support its stock market, which EQS was aware of even before the Greek vote.
EIA Short-Term Energy Outlook (STEO) - November 2015
The U.S. Energy Information Administration's Short-Term Energy Outlook issued Nov. 10, 2015. The STEO looks at the recent history of oil, natural gas, coal, renewables, etc., and predicts what will happen in the coming months/up to one year out. This report predicts the Henry Hub natural gas spot price to average $2.59/million British thermal units (MMBtu) this winter (October 2015–March 2016) compared with $3.35/MMBtu last winter.
Rbsa crude oil_black_gold_loses_its_glitter
The document discusses the recent crash in crude oil prices and its effects. It provides:
1. A brief history of rising oil prices since 2004 due to increased demand and conflicts limiting supply. Prices spiked but new extraction methods then increased supply beyond demand.
2. An explanation of why prices are now falling, as production in the US and Canada expanded through fracking and other technologies, while demand in places like Europe and China slowed. OPEC chose not to cut production to support prices.
3. Forecasts from the World Bank and IMF that crude prices may remain low in the near future, ranging from $53 to $57 per barrel, though geopolitical events could cause volatility.
EY Price Point: global oil and gas market outlook, Q2 | April 2022
The theme for this quarter is rearrangement. The loss, or potential loss, of Russian oil and gas supplies is forcing producers, refiners and traders to rethink the flow of crude oil and refined products from the wellhead to the gas pump in light of sanctions, potential sanctions and the risk of reputational damage. Countries, companies and consumers will all be searching for ways to adapt, and the outcome of the race to bring alternatives to market could alter the global energy landscape for years to come.
It is likely crude oil and LNG prices will remain elevated for some time. The process of diverting Russian oil through countries unwilling to sanction it will take time and there is little indication OPEC members are willing (or able) to increase production to make up for the loss of Russian crude. Spare capacity sat at 3.7 mbpd at the end of 2021, just above where it was in January 2020. Currently, sanctioned Venezuelan and Iranian production (about 3 mbpd below their peak) could fill the gap, but political and commercial obstacles remain. At today’s prices, US shale production is attractive, but the fastest the industry has been able to grow is between 1mbpd and 2mbpd per year. The LNG infrastructure was already stretched before the war in Ukraine and there is little prosect of finding new supplies soon.
As the largest buyer of Russian energy, Europe will be the epicenter. There is a deeply embedded bias there in favor for renewable energy, and the current crisis is certain to result in an all-out effort to accelerate the build-out of wind and solar power. The capacity to add new green energy is limited though by the project pipeline and supply chains for solar panels and wind turbines, and it is likely that much of the shortfall will be made up with the new LNG infrastructure.
2016 nigeria macro economic outlook
This was the outlook for 2016 as presented in Feb 2015 and 6 months down the line all the prognosis have been damn accurate. When it took the Nigerian Government over 7 months into the year to officially declare economic recession, this presentation had accurately done a forecast on the dire straits the Nigerian economy was in as at February 2016. If you are looking at catching an accurate glimpse what may still lie ahead in the last 4 months of the year 2016, this presentation will be your reliable guide.
Slides ifri eyl_mazzega_covid19_opec_impacts
- The Covid-19 outbreak and collapse of the OPEC+ alliance have created a perfect storm in the oil markets, with both a reduction in demand due to the economic slowdown and a coming oversupply as Saudi Arabia and Russia increase production.
- Oil prices have collapsed to around $36 per barrel and could fall further, pressuring the budgets of oil producing countries who need higher prices. This will weaken the economies of Russia, Saudi Arabia, and other OPEC members.
- The renewable energy sector may also see delays and slower growth as supply chains are disrupted and economic difficulties reduce investment and subsidies. Gas markets will remain oversupplied and depressed.
- The European Green Deal faces challenges
Exxon Initiating Coverage Report
This document provides an initiating coverage report on Exxon Mobil Corp by The William C. Dunkelberg Owl Fund. It recommends buying Exxon stock with a target price of $88.07, noting that Exxon is currently trading at a discount to its historical valuation relative to competitor Chevron. The report analyzes Exxon's business segments, the integrated oil and gas industry environment of low oil prices and excess supply, and catalysts like expansions that are expected to drive future earnings growth.
EY Price Point: global oil and gas market outlook, Q2 April 2021
The theme for this quarter is governed. Apparent market balance at prices that could be sustainable is the product of calculated choices by market leaders and the cooperation of those who follow them. Economics played their customary role as well, with capital scarcity in North America taking about 2 million barrels per day out of the market, about half of the remaining gap in demand. While inventories are close to their pre-COVID-19 levels, there is still uncertainty. The resolution of the pandemic is in sight, but timing is unclear. Vaccine distribution in the US is having an impact but Europe is struggling to contain a third wave of infections. The taps have opened on economic stimulus, but it remains to be seen if policymakers have done enough or if they have overshot the mark.
The shape of the crude oil forward curve has fundamentally changed since the end of the last quarter. In late December of last year, the Brent forward curve was gradually increasing while today, the curve is backwardated. This is a clear sign that the market sees a short-term dynamic that is disconnected from the medium-to-long-term fundamentals. The lasting impact of the COVID-19 pandemic remains to be seen. While many have opined that COVID-19 marks a turning point in energy transition, the IEA recently released a five-year forecast of oil demand that shows steady growth, albeit at rates that are below historical expectations.
Gas markets are a paradox. At the Henry Hub and at LNG destinations, demand grows, investment lags and prices will occasionally attract attention. Traders, so far though, are unconvinced and futures prices don’t indicate imminent scarcity at any link in the value chain.
Oil market monthly december 2011
This document provides a summary of the oil market in December 2011. It notes several political uncertainties in key oil producing countries that could escalate and impact oil prices, including Kazakhstan, Iran, and Iraq. It also discusses the risks of supply disruptions, weaker economic growth forecast for H1 2012 which could lead to oversupply, and expectations that OPEC will maintain production levels to balance the market. Oil prices are expected to be around $107/barrel in Q1 2012 and $105/barrel in Q2 before rebounding in H2 2012.
EY Price Point: Global Oil and Gas Market Outlook - Q3
The oil and gas sector is constantly changing. Increasingly uncertain energy policies, geopolitical complexities, cost management and climate change all present significant challenges. EY’s Global Oil & Gas Sector supports a global network of more than 10,000 oil and gas professionals with extensive experience in providing assurance, tax, transaction and advisory services across the upstream, midstream, downstream and oil field sub-sectors.
Similar to Iran nuke saga uk ez in update brief note (20)
EIA Short-Term Energy Outlook (STEO) - November 2015
EIA Short-Term Energy Outlook (STEO) - November 2015
EY Price Point: global oil and gas market outlook, Q2 | April 2022
EY Price Point: global oil and gas market outlook, Q2 | April 2022
EY Price Point: global oil and gas market outlook, Q2 April 2021
EY Price Point: global oil and gas market outlook, Q2 April 2021
EY Price Point: Global Oil and Gas Market Outlook - Q3
EY Price Point: Global Oil and Gas Market Outlook - Q3
More from Kush Sonigara
Kush Sonigara citation
The document appears to be a citation compilation from an individual in India named Kush Bharat Sonigara, who works as a Fixed Income Analyst. The compilation includes brief snippets of news headlines from 2013 and 2014 related to the Indian bond market, inflation rates, and actions taken by the Reserve Bank of India regarding bond trading.
India macro debt update
Retail inflation in India remains above the central bank's target due to high food prices. While industrial production is trending upward, it may not significantly boost overall output. The rupee strengthened after the central bank took steps to tighten inflation measures and increase dollar inflows. Fiscal deficits are mounting as tax revenues have fallen short of targets due to lower GDP growth. The government may resort to accounting changes and expenditure cuts to limit the deficit. Upcoming inflation and fiscal deficit numbers will influence monetary policy decisions and bond yields.
Iran nuke deal note
Iran was believed to be developing nuclear weapons, which it denied, leading countries to impose sanctions that cut Iran's oil sales by 60%. In 2013, Iran agreed to curb its nuclear program in return for reduced sanctions. This deal has the potential to increase global oil supply by 800,000 barrels per day and lower oil prices, though risks remain if Iran does not follow through.
India macro and money market
The document provides a summary of macroeconomic indicators and monetary policy developments in India for November 2013. It notes that retail inflation remains high at around 9% while GDP growth is forecast below 5% for fiscal year 2014. The RBI cut its marginal standing facility rate twice in October to lower borrowing costs and ease liquidity. However, inflation expectations remain elevated which could lead to further interest rate hikes if inflation does not stabilize. Overall, the Indian economy is showing some improvements but external risks such as a reversal of capital inflows remain a concern.
Fiscal deficit & CAD update
The document discusses India's fiscal deficit and weakening economic growth. It notes that direct tax collection growth of 14.43% from April to August fell short of the 18-19% target. Indirect tax growth was only 4.1% compared to the target of 18-19%. Rising global commodity prices and a depreciating rupee are increasing subsidies which will likely exceed the budgeted amount. With the fiscal deficit already reaching 63% of the target for the first four months, containing the deficit at 4.8% of GDP will be extremely difficult. The Finance Minister will need to increase diesel prices, boost tax collection, and cut spending to meet fiscal targets.
Mid quarter monetary policy review september 2013
The Reserve Bank of India (RBI) unexpectedly raised its policy repo rate by 25 basis points to 7.5% due to concerns about rising inflation and anchoring inflation expectations. While cutting other rates, the RBI governor cited risks of higher inflation from supply issues and increasing administered prices. Inflation is expected to be higher by the end of the year. The RBI will prioritize monetary stability and lowering inflation expectations to achieve its primary objective. The governor signaled that future policy decisions will depend on economic data and activity.
India - Liquidity Monitor
Liquidity in the Indian market was tight in July due to central government overspending and a widening gap between credit and deposit growth. Short term rates rose after the RBI implemented measures to tighten liquidity and curb currency volatility, including raising rates and reducing banks' liquidity adjustment facility borrowing limits. However, liquidity is expected to ease in the coming weeks as the credit growth slows, the currency in circulation decreases, and the government receives dividend payments from the RBI in mid-August, which it may use to fund spending and loosen liquidity conditions.
Current account deficit
India has been facing a large current account deficit due to high oil and gold imports. While the rupee has depreciated by about 14% against other currencies, this has not significantly boosted exports due to weak global demand. To reduce the current account deficit to a more comfortable level of around 2.5% of GDP, the government will need to take steps both to reduce imports and improve exports. Policymakers seem prepared to take stern steps on the imports side, while incentives may be needed to boost exports in sectors like IT, pharmaceuticals, and automobiles.
Public finance
This document discusses public finance in India, including central government income and expenditure, state government remuneration, and budget figures for fiscal year 2014. It also covers major government schemes, sources of capital receipts, market capitalization of government entities, external debt, import and export numbers, and recent issues regarding edible oils and coal. Graphs are provided to illustrate some of the concepts.
Why financial planning
TBNG aims to redefine savings by helping people properly manage their personal finances through financial planning. Financial planning involves analyzing one's current financial situation, setting future goals, and finding ways to achieve those goals. It allows for the proper management of cash flows, timely achievement of goals, identification of risk appetite and insurance needs, and efficient retirement planning. Paid financial planning provides recommendations that are independent of products and focused on the client, unlike free plans where advisors earn commissions. TBNG helps clients improve their financial situations through comprehensive financial planning that analyzes areas like expenses, assets, insurance coverage, investments, taxes, estate planning, and goals.
More from Kush Sonigara (10)
Iran nuke saga uk ez in update brief note
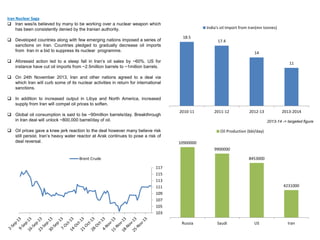
- 1. Iran Nuclear Saga Iran was/is believed by many to be working over a nuclear weapon which has been consistently denied by the Iranian authority. Developed countries along with few emerging nations imposed a series of sanctions on Iran. Countries pledged to gradually decrease oil imports from Iran in a bid to suppress its nuclear programme. India's oil Import from Iran(mn tonnes) 18.5 17.4 14 Aforesaid action led to a steep fall in Iran’s oil sales by ~60%. US for instance have cut oil imports from ~2.5million barrels to ~1million barrels. 11 On 24th November 2013, Iran and other nations agreed to a deal via which Iran will curb some of its nuclear activities in return for international sanctions. In addition to increased output in Libya and North America, increased supply from Iran will compel oil prices to soften. Global oil consumption is said to be ~90million barrels/day. Breakthrough in Iran deal will unlock ~800,000 barrel/day of oil. Oil prices gave a knee jerk reaction to the deal however many believe risk still persist. Iran’s heavy water reactor at Arak continues to pose a risk of deal reversal. 2010-11 2011-12 2012-13 2013-2014 2013-14 -> targeted figure Oil Production (bbl/day) 10900000 9900000 8453000 Brent Crude 117 115 113 111 109 107 105 103 4231000 Russia Saudi US Iran
- 2. UK & Europe European economy after a number of incentives continues to lag. Unemployment which currently stands at 12.2% have been consistently (gradually) increasing. Unemployment rate in Sep-11 was seen at 10.3%. EZ Core CPI (YOY) EZ PPI (YOY) 3.0 2.5 Consistent fall in inflation has compelled ECB to cut its refinancing rate from 0.5% to 0.25% on 7th Nov. There were chatters in the market that ECB is mulling negative rate as well however ECB’s Draghi was quick to respond and denied such step for now. 2.0 1.5 A number of polls suggests ECB will conduct another long term refinancing operation early next year which gives bank, access to cheap funding. 1.0 Last print of Inflation in UK was seen as a breather which came in at a year low of ~2.2%. Developed economies usually do not want inflation to sustain above 2% for a longer time. Economic situation in UK has improved adequately. BoE, to tame inflation, may hike rates only after unemployment rate (currently at ~7.7%) falls below 7%. 0.0 High inflation expectation will keep yields in UK elevated whereas easy policy in the Eurozone will support bond prices. UK 10Yr (in %) -0.5 -1.0 -1.5 UK CPI (Y-o-Y) (in %) 3.0 EUR 10Yr (in %) 2.8 3.1 2.05 2.8 2.4 1.85 2.9 2.6 1.95 3 2.2 2.7 1.75 2.6 2.5 9/2/2013 0.5 1.65 10/2/2013 11/2/2013 EUR – RHS; UK - LHS 2.0 1.8
- 3. India : Macro update Retail inflation, which is now closely contemplated, remains above the comfort of policymakers in Mumbai. Last CPI number was seen at 10.1% courtesy to high food/vegetable prices. Core Combined CPI 11.20% Industrial production’s three month moving average deciphers some uptrend however the same may not improve final output substantially. 10.70% INR moved up considerably after RBI’s steps taken in early September. Continuous dollar inflow and tight measures to tame inflation supplemented the measures announced by new Governor. 9.70% 10.20% 9.20% 8.70% All eyes will now be over Fed’s meeting in Mid December followed by RBI’s policy. 8.20% 7.70% RBI is expected to announce its Mid-Quarter review on December 18, 2013. November Inflation numbers and anecdotal fiscal update will drive the domestic market. IIP General IDR BRL INR 3MMA 103 101 8.00% 99 6.00% 97 4.00% 95 2.00% 93 0.00% 91 -2.00% 89 -4.00% 87 -6.00% Aug-11 Sep-11 Oct-11 Nov-11 Dec-11 Jan-12 Feb-12 Mar-12 Apr-12 May-12 Jun-12 Jul-12 Aug-12 Sep-12 Oct-12 Nov-12 Dec-12 Jan-13 Feb-13 Mar-13 Apr-13 May-13 Jun-13 Jul-13 Aug-13 Sep-13 10.00% 85 11/24/2013 7/24/2013 8/24/2013 9/24/2013 10/24/2013