Download to read offline


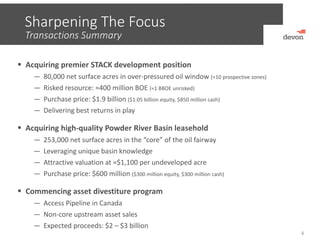


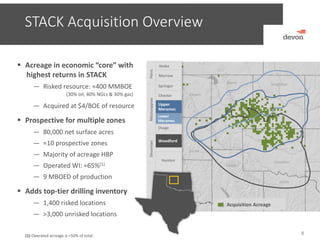


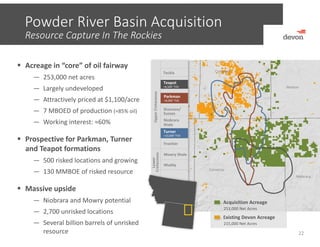

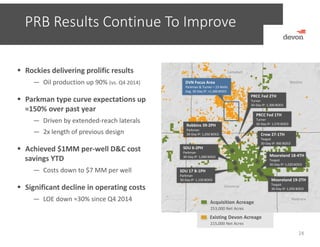


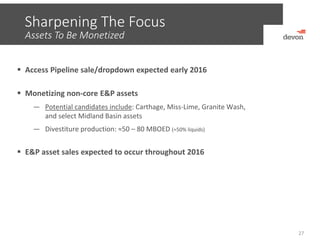
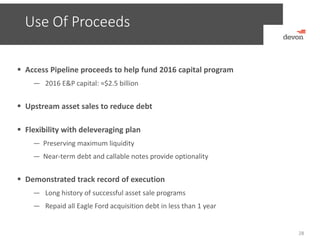


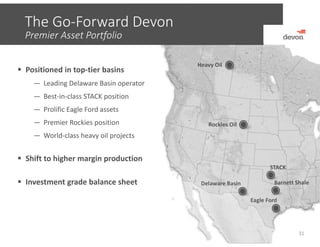
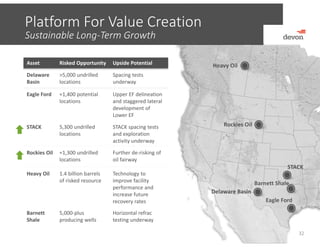


Devon Energy acquired premier STACK development positions in Oklahoma, including 80,000 net surface acres prospective for 10 zones, with a risked resource potential of 400 million BOE. Devon also acquired 253,000 net Powder River Basin acres in Wyoming. Devon will sell non-core assets, including its Access Pipeline in Canada, to generate $2-3 billion in proceeds. The acquisitions and divestitures will sharpen Devon's strategic focus on top resource plays and strengthen its financial position.