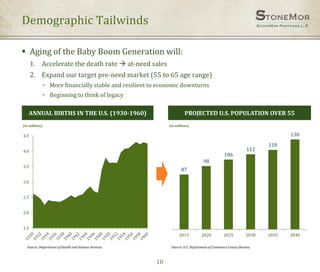
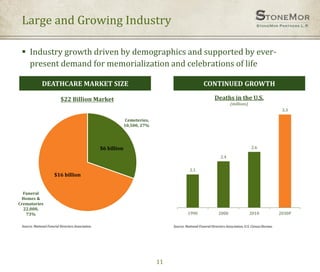
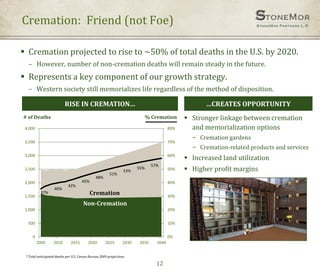
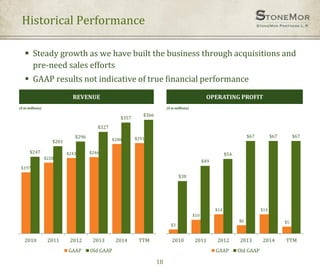
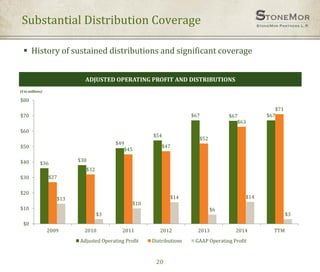
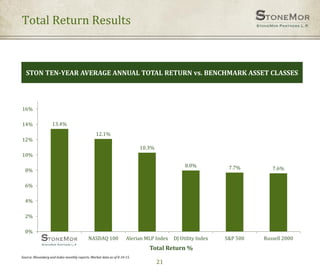
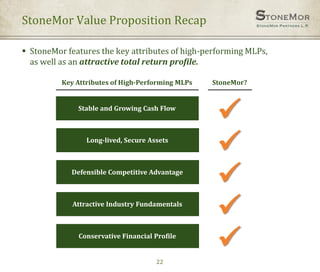
StoneMor Partners L.P.
Investor Presentation
August 2015
Forward-Looking Statements
Certain statements contained in this presentation, including, but not limited to, information regarding the status and
progress of our operating activities, the plans and objectives of our management, assumptions regarding our future
performance and plans, and any financial guidance provided or guidance related to our future distributions are
forward-looking statements.
These forward-looking statements are made subject to certain risks and uncertainties that could cause
actual results to differ materially from those stated or implied. Our major risk is related to uncertainties
associated with the cash flow from our pre-need and at-need sales, our trusts, and financings, which may
impact our ability to meet our financial projections, our ability to service our debt and pay distributions, and
our ability to increase our distributions.
When considering forward-looking statements, the reader should keep in mind the risk factors and other cautionary
statements set forth in our Annual Report on Form 10-K for the fiscal year ended December 31, 2014, our Quarterly
Report on Form 10-Q for the fiscal quarter ended March 31, 2015, and our Current Report on Form 8-K dated July 6,
2015 filed with the Securities and Exchange Commission. Except as required by federal and state securities laws, we
assume no obligation to update or revise any forward-looking statements made herein or any other forward-looking
statements made by us, whether as a result of new information, future events, or otherwise.
Non-GAAP Financial Measures
We report our financial results in accordance with U.S. GAAP. However, we believe that certain non-GAAP financial
measures used in managing the business may provide investors with additional information regarding underlying
trends and ongoing results on a comparable basis. Specifically, management believes that production-based
revenues and adjusted operating profit allow the investor to gain insight into our operating performance. Non-GAAP
financial measures that we use should not be considered as alternatives to GAAP financial measures, and you should
not consider such non-GAAP financial measures in isolation or as a substitute for an analysis of our results as
reported under U.S. GAAP. A reconciliation of non-GAAP financial measures to the most directly comparable GAAP
measures is provided later in this presentation.
2
StoneMor at a Glance
3
Second-largest owner and operator of cemeteries in the U.S.
 304 cemeteries/102 funeral homes, located across 28 states and Puerto Rico
 Complete range of funeral merchandise and services, along with cemetery property,
merchandise and services, both at the time of need and on a pre-need basis
 Over 15,700 acres of land, equivalent to a weighted average sales life of 248 years
 50,566 annual burials/14,900 funeral service calls
 $811 million in Merchandise and Perpetual Care Trusts as of June 30, 2015
 We are the only deathcare company structured as a master limited partnership (MLP)
Our Evolution
4
Metric 2004 (IPO)(1) 2015(2)
Operational Data
Cemeteries/Funeral Homes 132 / 7 304 / 102
Employees ~1,100 ~3,400
Annual Interments ~22,000 ~50,500
Funeral Service Calls 650 14,900
Financial Data
Production-based Revenue $89 million $386 million
Adjusted Operating Profit $29 million $66.7 million
Distribution per Unit $1.85 $2.56
Market Cap $175 million $843 million(3)
(1) Represents data as of 12/31/2004 or for the twelve-month period ended 12/31/2004, as applicable.
(2) Represents data as of 6/30/2015 or for the twelve-month period ended 6/30/2015, as applicable.
(3) As of August 7, 2015
2015 Second Quarter Review
5
 GAAP revenues increased 13% to record $80.8 million
 Production-based revenues increased 23% to record $107.0 million
 Exceeds $100 million for first time
 Adjusted operating profits increased 41.8%
 Distributable free cash flow increased 24.8%
 Increased distribution $0.01 per unit payable August 14, will mark 43
consecutive distribution payments.
Our Footprint Today
6
 Significantly enhanced geographic scale and diversity
304 Cemeteries
+ 102 Funeral Homes
= 406 Total Locations
WA
OR
CA
CO
KS
IA
IL
MO
AR
IN
MI
OH
PA
WV
KY
TN
VA
NC
SC
GAALMS
FL
Washington
3 Cemeteries
2 Funeral Homes
Oregon
7 Cemeteries
11 Funeral Homes
California
7 Cemeteries
8 Funeral Homes
Colorado
2 Cemeteries
Kansas
3 Cemeteries
2 Funeral Homes
Hawaii
1 Cemetery
Iowa
1 Cemetery
Illinois
9 Cemeteries
4 Funeral Home
Indiana
11 Cemeteries
5 Funeral Homes Michigan
13 Cemeteries
Kentucky
2 Cemeteries
Ohio
14 Cemeteries
2 Funeral Homes
Rhode Island
2 Cemeteries
Pennsylvania
68 Cemeteries
10 Funeral Homes
New Jersey
6 Cemeteries
Delaware
1 Cemetery
Maryland
10 Cemeteries
1 Funeral Home
West Virginia
33 Cemeteries
2 Funeral Homes
Virginia
34 Cemeteries
2 Funeral Homes
North Carolina
19 Cemeteries
2 Funeral Homes
South Carolina
8 Cemeteries
2 Funeral Homes
Puerto Rico
7 Cemeteries
5 Funeral Homes
Georgia
7 Cemeteries
Florida
8 Cemeteries
25 Funeral Homes
Tennessee
11 Cemeteries
5 Funeral Homes
Alabama
9 Cemeteries
6 Funeral Homes
Mississippi
2 Cemeteries
1 Funeral Home
Arkansas
2 Funeral Homes
Missouri
6 Cemeteries
5 Funeral Homes
As of June 30, 2015
Diversified Revenue Streams
7
• More than 60% of revenues generated through highly predictable and at-need business.
• StoneMor’s 800+ person sales team creates an unparalleled advantage in pre-need sales.
Pre-need Sales,
36.5%
At-need Sales,
32.0%
Investment
Income, 9.1%
Interest
Income, 2.6%
Funeral Home
Revenues,
16.9%
Other
Cemetery
Revenues, 2.9%
Year ended December 31, 2014
BUSINESS MIX BY REVENUE STREAM
Mission-Driven Strategy
8
Mission
Vision
Strategy
To help families memorialize every life
with dignity.
To be the preferred operator of deathcare
facilities and preferred provider of
deathcare services.
To use an opportunistic, yet conservatively
financed acquisition strategy to build market
share. Leverage these positions to expand
service offerings.
Industry Snapshot
9
 We are a leader in an industry with great opportunity.
 Aging population driving both at-need and pre-
need demand
 $22 billion industry
 Healthy historical and projected growth
 80% of properties are owned by independents
 Only a few scale players
 No new supply
 Significant financial and operating regulations
Favorable
Demographics
Large and Growing
Market
Fragmented
Ownership
Substantial Barriers
to Entry
Demographic Tailwinds
10
Source: Department of Health and Human Services.
ANNUAL BIRTHS IN THE U.S. (1930-1960)
 Aging of the Baby Boom Generation will:
1. Accelerate the death rate  at-need sales
2. Expand our target pre-need market (55 to 65 age range)
− More financially stable and resilient to economic downturns
− Beginning to think of legacy
Source: U.S. Department of Commerce Census Bureau.
PROJECTED U.S. POPULATION OVER 55
87
98
106
112
118
130
2015 2020 2025 2030 2035 2040
(in millions)
1.5
2.0
2.5
3.0
3.5
4.0
4.5
(in millions)
Cemeteries,
10,500, 27%
Funeral
Homes &
Crematories
22,000,
73%
$16 billion
$6 billion
Source: National Funeral Directors Association. Source: National Funeral Directors Association; U.S. Census Bureau.
$22 Billion Market
DEATHCARE MARKET SIZE
11
Large and Growing Industry
CONTINUED GROWTH
2.1
2.4
2.6
3.3
1990 2000 2010 2030P
Deaths in the U.S.
(millions)
 Industry growth driven by demographics and supported by ever-
present demand for memorialization and celebrations of life
12
 Cremation projected to rise to ~50% of total deaths in the U.S. by 2020.
– However, number of non-cremation deaths will remain steady in the future.
 Represents a key component of our growth strategy.
– Western society still memorializes life regardless of the method of disposition.
 Stronger linkage between cremation
and memorialization options
− Cremation gardens
− Cremation-related products and services
 Increased land utilization
 Higher profit margins
Cremation: Friend (not Foe)
* Total anticipated deaths per U.S. Census Bureau 2009 projections.
…CREATES OPPORTUNITYRISE IN CREMATION…
37%
40%
42%
45%
48%
51%
53%
55%
57%
0%
10%
20%
30%
40%
50%
60%
70%
80%
0
500
1,000
1,500
2,000
2,500
3,000
3,500
4,000
2005 2010 2015 2020 2025 2030 2035 2040
# of Deaths % Cremation
Cremation
Non-Cremation
Our Acquisition Approach
13
 Disciplined target selection: “never break the model”
 Strategic locations to create and/or enhance market clusters
Cemetery
− 25+ year sales life
− 200+ annual interments
 Seasoned, professional management
 Consolidate office functions into home office
 Institute pre-need sales program
 Leverage buying power to reduce product costs
 Professional trust fund management
Philosophy
Target Criteria
Integration
Funeral
− 150+ Annual Calls
− Strong legacy
 Accretive from day one
 IRR > cost of capital
Proven Acquisition Track Record
14
 176 cemeteries and 104 funeral homes acquired since 2004 IPO(1)
– Record year in 2014
 Target acquisition multiples of 4x – 6x EBITDA
 Acquisition pipeline remains robust
$16
$33
$115 $117 $124
$173 $189
$224 $247
$354
$360
$0
$100
$200
$300
$400
2005 2006 2007 2008 2009 2010 2011 2012 2013 2014 2015
ACQUISITIONS SINCE IPO (CUMULATIVE PURCHASE PRICE)
# Cemeteries:
# Funeral Homes:
($ in millions)
23
6
46
20
94
50
101
52
104
52
126
57
143
68
148
85
149
91
175
100
(1) Net of sales and divestitures, 172 cemeteries and 95 funeral homes acquired since 2004 IPO.
$107mm of acquisitions in 2014;
Historical average of $27mm annually since IPO
176
104
15
Growth
Through
Disciplined
Acquisition
Underwriting
Prudent
Balance Sheet
Management
Deliver
Reliable,
Consistent
Value to
Unitholders
 We have delivered steady, conservatively financed growth.
 Transformational 2014 is an inflection point toward future growth.
 Avg. $27mm annual acquisitions (’05-’13)
 Target 4x – 6x EBITDA purchase prices
$2.23 $2.33 $2.35 $2.39 $2.43 $2.60
2010 2011 2012 2013 2014 2015
Distributions/LP Unit
Proven Track Record
Keys to Our Success
Recent Developments
33% 32%
40% 36%
28% 27%
12/10 12/11 12/12 12/13 12/14 6/15
Debt/Enterprise Value
 2014 acquisitions ~4x average annual pace
 AOP and SCI properties operating on plan
 Well capitalized GP with AIM’s investment
 Two equity raises ($120mm) to de-lever
 Refinance senior notes to lower cost of debt
 Distributions expected to grow by $0.01 per
unit each quarter through the end of 2015
16
Merchandise
Trust and
Perpetual Care
Trust
Measured
Performance*
 $478 million (Merchandise Trust)
– All principal, interest and dividends accrue to StoneMor over time
 $340 Million (Perpetual Care)
– Principal remains in trust in perpetuity
– Interest and dividends accrue to StoneMor
Trust Management
6%
8%
7%
9%
8%
12/10 12/11 12/12 12/13 12/14
Merchandise Trust
Investment
Management
 Governed by investment guidelines adopted by Trust and Compliance Committee of B.O.D.
 Balanced approach to preservation of capital
 Variety of intermediate-term, investment-grade, fixed-income securities, high-yield securities,
REITS, MLPs, other equities and cash
7%
6% 6%
5% 4%
12/10 12/11 12/12 12/13 12/14
Perpetual Care Trust
*Past performance is not indicative of future performance
17
Recent Results
PRODUCTION-BASED REVENUE
($ in millions)
ADJUSTED OPERATING PROFIT
($ in millions)
DISTRIBUTABLE FCF
($ in millions)
 We focus on three non-GAAP financial metrics
– Production-Based Revenue: total value of contracts written, investment and other income
– Adjusted Operating Profit: normalizes timing differences between GAAP and economic results
– Distributable Free Cash Flow: indicator of our ability to pay distributions to our unitholders
$296
$327
$357
$386
$0
$50
$100
$150
$200
$250
$300
$350
$400
$450
2012 2013 2014 TTM
$54
$67 $67 $67
$0
$10
$20
$30
$40
$50
$60
$70
$80
2012 2013 2014 TTM
1. Grey shading denotes extraordinary gain on settlement agreement, net.
$53
$64
$61
$12
$76
$59
$0
$10
$20
$30
$40
$50
$60
$70
$80
2012 2013 2014 TTM
(1)
($ in millions) ($ in millions)
REVENUE OPERATING PROFIT
18
Historical Performance
 Steady growth as we have built the business through acquisitions and
pre-need sales efforts
 GAAP results not indicative of true financial performance
$3
$10
$14
$6
$14
$5
$38
$49
$54
$67 $67 $67
2010 2011 2012 2013 2014 TTM
GAAP Old GAAP
$197
$228
$243 $246
$288 $291
$247
$281
$296
$327
$357
$366
2010 2011 2012 2013 2014 TTM
GAAP Old GAAP
Significant Asset Value
19
NET LIQUID ASSETS
($ in millions)
FUTURE VALUE-GENERATING ASSETS
 Cemetery Property:
− $340mm book value
− Approximately 15,716 acres
− Weighted average sales life of 247 years
 Property and Equipment:
− $99mm book value, net
 Perpetual Care Trusts:
− $332mm under management
− Fund future maintenance costs
 Marketable assets provide debt protection and
$154mm of excess value
 Assets underlying $67mm of Adjusted
Operating Profit generation in 2014
 Conservative balance sheet at 6/30/2015 featuring:
i. $129 mm of net liquid assets (detail below)
ii. Significant additional value from long-term, profit-generating assets of the business
$654
$129
$41
$153
$331
$0
$100
$200
$300
$400
$500
$600
$700
Cash, AR and
Merchandise
Trust
AP and
Accrued
Liabilities
Merchandise
Liability
Debt Excess Cash
and Assets
20
 History of sustained distributions and significant coverage
($ in millions)
ADJUSTED OPERATING PROFIT AND DISTRIBUTIONS
$36
$38
$49
$54
$67 $67 $67
$27
$32
$45
$47
$52
$63
$71
$13
$3
$10
$14
$6
$14
$3
$0
$10
$20
$30
$40
$50
$60
$70
$80
2009 2010 2011 2012 2013 2014 TTM
Adjusted Operating Profit Distributions GAAP Operating Profit
Substantial Distribution Coverage
STON TEN-YEAR AVERAGE ANNUAL TOTAL RETURN vs. BENCHMARK ASSET CLASSES
21
Total Return Results
13.4%
12.1%
10.3%
8.0% 7.7% 7.6%
0%
2%
4%
6%
8%
10%
12%
14%
16%
StoneMor NASDAQ 100 Alerian MLP Index DJ Utility Index S&P 500 Russell 2000
Source: Bloomberg and Index monthly reports. Market data as of 8-10-15.
Total Return %
22
Stable and Growing Cash Flow
Key Attributes of High-Performing MLPs StoneMor?
Long-lived, Secure Assets
Defensible Competitive Advantage
Attractive Industry Fundamentals
Conservative Financial Profile
 StoneMor features the key attributes of high-performing MLPs,
as well as an attractive total return profile.
StoneMor Value Proposition Recap
Thank You
24
 Reconciliation of Production Based Revenue (non-GAAP) and Adjusted Operating Profit
(non-GAAP) to Revenue (GAAP) and Operating Profit (GAAP) for 2014 and 2013
Appendix
Segment Segment
Results GAAP GAAP Results GAAP GAAP
(non-GAAP) Adjustments Results (non-GAAP) Adjustments Results
Revenues
Pre-need cemetery revenues 79,905$ (31,418)$ 48,487$ 68,385$ (21,927)$ 46,458$
At-need cemetery revenues 53,411 (3,858) 49,553 42,958 370 43,328
Investment income from trusts 27,626 (14,011) 13,615 25,240 (12,789) 12,451
Interest income 4,384 - 4,384 4,041 - 4,041
Funeral home revenues 33,149 (4,395) 28,754 26,320 (3,095) 23,225
Other cemetery revenues 3,044 405 3,449 5,708 709 6,417
Total revenues (a) 201,519 (53,277) 148,242 172,652 (36,732) 135,920
Costs and expenses
Cost of goods sold 22,266 (5,376) 16,890 19,757 (3,603) 16,154
Cemetery expense 35,544 - 35,544 29,470 - 29,470
Selling expense 38,242 (8,563) 29,679 31,027 (4,977) 26,050
General and administrative expense 18,521 - 18,521 16,525 - 16,525
Corporate overhead 18,827 - 18,827 14,002 - 14,002
Depreciation and amortization 5,896 - 5,896 4,881 - 4,881
Funeral home expense 25,286 (987) 24,299 19,139 (417) 18,722
Acquisition related costs, net of recoveries 685 - 685 1,589 - 1,589
Total costs and expenses 165,267 (14,926) 150,341 136,390 (8,997) 127,393
Operating profit (loss) (a) 36,252$ (38,351)$ (2,099)$ 36,262$ (27,735)$ 8,527$
(in thousands) (in thousands)
Six months ended Six months ended
June 30, 2015 June 30, 2014
(a) The comparisons of these metrics were impacted by the one-time land sale in the first quarter of 2014.

Investor presentation august 2015

  • 1.
    StoneMor Partners L.P. InvestorPresentation August 2015
  • 2.
    Forward-Looking Statements Certain statementscontained in this presentation, including, but not limited to, information regarding the status and progress of our operating activities, the plans and objectives of our management, assumptions regarding our future performance and plans, and any financial guidance provided or guidance related to our future distributions are forward-looking statements. These forward-looking statements are made subject to certain risks and uncertainties that could cause actual results to differ materially from those stated or implied. Our major risk is related to uncertainties associated with the cash flow from our pre-need and at-need sales, our trusts, and financings, which may impact our ability to meet our financial projections, our ability to service our debt and pay distributions, and our ability to increase our distributions. When considering forward-looking statements, the reader should keep in mind the risk factors and other cautionary statements set forth in our Annual Report on Form 10-K for the fiscal year ended December 31, 2014, our Quarterly Report on Form 10-Q for the fiscal quarter ended March 31, 2015, and our Current Report on Form 8-K dated July 6, 2015 filed with the Securities and Exchange Commission. Except as required by federal and state securities laws, we assume no obligation to update or revise any forward-looking statements made herein or any other forward-looking statements made by us, whether as a result of new information, future events, or otherwise. Non-GAAP Financial Measures We report our financial results in accordance with U.S. GAAP. However, we believe that certain non-GAAP financial measures used in managing the business may provide investors with additional information regarding underlying trends and ongoing results on a comparable basis. Specifically, management believes that production-based revenues and adjusted operating profit allow the investor to gain insight into our operating performance. Non-GAAP financial measures that we use should not be considered as alternatives to GAAP financial measures, and you should not consider such non-GAAP financial measures in isolation or as a substitute for an analysis of our results as reported under U.S. GAAP. A reconciliation of non-GAAP financial measures to the most directly comparable GAAP measures is provided later in this presentation. 2
  • 3.
    StoneMor at aGlance 3 Second-largest owner and operator of cemeteries in the U.S.  304 cemeteries/102 funeral homes, located across 28 states and Puerto Rico  Complete range of funeral merchandise and services, along with cemetery property, merchandise and services, both at the time of need and on a pre-need basis  Over 15,700 acres of land, equivalent to a weighted average sales life of 248 years  50,566 annual burials/14,900 funeral service calls  $811 million in Merchandise and Perpetual Care Trusts as of June 30, 2015  We are the only deathcare company structured as a master limited partnership (MLP)
  • 4.
    Our Evolution 4 Metric 2004(IPO)(1) 2015(2) Operational Data Cemeteries/Funeral Homes 132 / 7 304 / 102 Employees ~1,100 ~3,400 Annual Interments ~22,000 ~50,500 Funeral Service Calls 650 14,900 Financial Data Production-based Revenue $89 million $386 million Adjusted Operating Profit $29 million $66.7 million Distribution per Unit $1.85 $2.56 Market Cap $175 million $843 million(3) (1) Represents data as of 12/31/2004 or for the twelve-month period ended 12/31/2004, as applicable. (2) Represents data as of 6/30/2015 or for the twelve-month period ended 6/30/2015, as applicable. (3) As of August 7, 2015
  • 5.
    2015 Second QuarterReview 5  GAAP revenues increased 13% to record $80.8 million  Production-based revenues increased 23% to record $107.0 million  Exceeds $100 million for first time  Adjusted operating profits increased 41.8%  Distributable free cash flow increased 24.8%  Increased distribution $0.01 per unit payable August 14, will mark 43 consecutive distribution payments.
  • 6.
    Our Footprint Today 6 Significantly enhanced geographic scale and diversity 304 Cemeteries + 102 Funeral Homes = 406 Total Locations WA OR CA CO KS IA IL MO AR IN MI OH PA WV KY TN VA NC SC GAALMS FL Washington 3 Cemeteries 2 Funeral Homes Oregon 7 Cemeteries 11 Funeral Homes California 7 Cemeteries 8 Funeral Homes Colorado 2 Cemeteries Kansas 3 Cemeteries 2 Funeral Homes Hawaii 1 Cemetery Iowa 1 Cemetery Illinois 9 Cemeteries 4 Funeral Home Indiana 11 Cemeteries 5 Funeral Homes Michigan 13 Cemeteries Kentucky 2 Cemeteries Ohio 14 Cemeteries 2 Funeral Homes Rhode Island 2 Cemeteries Pennsylvania 68 Cemeteries 10 Funeral Homes New Jersey 6 Cemeteries Delaware 1 Cemetery Maryland 10 Cemeteries 1 Funeral Home West Virginia 33 Cemeteries 2 Funeral Homes Virginia 34 Cemeteries 2 Funeral Homes North Carolina 19 Cemeteries 2 Funeral Homes South Carolina 8 Cemeteries 2 Funeral Homes Puerto Rico 7 Cemeteries 5 Funeral Homes Georgia 7 Cemeteries Florida 8 Cemeteries 25 Funeral Homes Tennessee 11 Cemeteries 5 Funeral Homes Alabama 9 Cemeteries 6 Funeral Homes Mississippi 2 Cemeteries 1 Funeral Home Arkansas 2 Funeral Homes Missouri 6 Cemeteries 5 Funeral Homes As of June 30, 2015
  • 7.
    Diversified Revenue Streams 7 •More than 60% of revenues generated through highly predictable and at-need business. • StoneMor’s 800+ person sales team creates an unparalleled advantage in pre-need sales. Pre-need Sales, 36.5% At-need Sales, 32.0% Investment Income, 9.1% Interest Income, 2.6% Funeral Home Revenues, 16.9% Other Cemetery Revenues, 2.9% Year ended December 31, 2014 BUSINESS MIX BY REVENUE STREAM
  • 8.
    Mission-Driven Strategy 8 Mission Vision Strategy To helpfamilies memorialize every life with dignity. To be the preferred operator of deathcare facilities and preferred provider of deathcare services. To use an opportunistic, yet conservatively financed acquisition strategy to build market share. Leverage these positions to expand service offerings.
  • 9.
    Industry Snapshot 9  Weare a leader in an industry with great opportunity.  Aging population driving both at-need and pre- need demand  $22 billion industry  Healthy historical and projected growth  80% of properties are owned by independents  Only a few scale players  No new supply  Significant financial and operating regulations Favorable Demographics Large and Growing Market Fragmented Ownership Substantial Barriers to Entry
  • 10.
    Demographic Tailwinds 10 Source: Departmentof Health and Human Services. ANNUAL BIRTHS IN THE U.S. (1930-1960)  Aging of the Baby Boom Generation will: 1. Accelerate the death rate  at-need sales 2. Expand our target pre-need market (55 to 65 age range) − More financially stable and resilient to economic downturns − Beginning to think of legacy Source: U.S. Department of Commerce Census Bureau. PROJECTED U.S. POPULATION OVER 55 87 98 106 112 118 130 2015 2020 2025 2030 2035 2040 (in millions) 1.5 2.0 2.5 3.0 3.5 4.0 4.5 (in millions)
  • 11.
    Cemeteries, 10,500, 27% Funeral Homes & Crematories 22,000, 73% $16billion $6 billion Source: National Funeral Directors Association. Source: National Funeral Directors Association; U.S. Census Bureau. $22 Billion Market DEATHCARE MARKET SIZE 11 Large and Growing Industry CONTINUED GROWTH 2.1 2.4 2.6 3.3 1990 2000 2010 2030P Deaths in the U.S. (millions)  Industry growth driven by demographics and supported by ever- present demand for memorialization and celebrations of life
  • 12.
    12  Cremation projectedto rise to ~50% of total deaths in the U.S. by 2020. – However, number of non-cremation deaths will remain steady in the future.  Represents a key component of our growth strategy. – Western society still memorializes life regardless of the method of disposition.  Stronger linkage between cremation and memorialization options − Cremation gardens − Cremation-related products and services  Increased land utilization  Higher profit margins Cremation: Friend (not Foe) * Total anticipated deaths per U.S. Census Bureau 2009 projections. …CREATES OPPORTUNITYRISE IN CREMATION… 37% 40% 42% 45% 48% 51% 53% 55% 57% 0% 10% 20% 30% 40% 50% 60% 70% 80% 0 500 1,000 1,500 2,000 2,500 3,000 3,500 4,000 2005 2010 2015 2020 2025 2030 2035 2040 # of Deaths % Cremation Cremation Non-Cremation
  • 13.
    Our Acquisition Approach 13 Disciplined target selection: “never break the model”  Strategic locations to create and/or enhance market clusters Cemetery − 25+ year sales life − 200+ annual interments  Seasoned, professional management  Consolidate office functions into home office  Institute pre-need sales program  Leverage buying power to reduce product costs  Professional trust fund management Philosophy Target Criteria Integration Funeral − 150+ Annual Calls − Strong legacy  Accretive from day one  IRR > cost of capital
  • 14.
    Proven Acquisition TrackRecord 14  176 cemeteries and 104 funeral homes acquired since 2004 IPO(1) – Record year in 2014  Target acquisition multiples of 4x – 6x EBITDA  Acquisition pipeline remains robust $16 $33 $115 $117 $124 $173 $189 $224 $247 $354 $360 $0 $100 $200 $300 $400 2005 2006 2007 2008 2009 2010 2011 2012 2013 2014 2015 ACQUISITIONS SINCE IPO (CUMULATIVE PURCHASE PRICE) # Cemeteries: # Funeral Homes: ($ in millions) 23 6 46 20 94 50 101 52 104 52 126 57 143 68 148 85 149 91 175 100 (1) Net of sales and divestitures, 172 cemeteries and 95 funeral homes acquired since 2004 IPO. $107mm of acquisitions in 2014; Historical average of $27mm annually since IPO 176 104
  • 15.
    15 Growth Through Disciplined Acquisition Underwriting Prudent Balance Sheet Management Deliver Reliable, Consistent Value to Unitholders We have delivered steady, conservatively financed growth.  Transformational 2014 is an inflection point toward future growth.  Avg. $27mm annual acquisitions (’05-’13)  Target 4x – 6x EBITDA purchase prices $2.23 $2.33 $2.35 $2.39 $2.43 $2.60 2010 2011 2012 2013 2014 2015 Distributions/LP Unit Proven Track Record Keys to Our Success Recent Developments 33% 32% 40% 36% 28% 27% 12/10 12/11 12/12 12/13 12/14 6/15 Debt/Enterprise Value  2014 acquisitions ~4x average annual pace  AOP and SCI properties operating on plan  Well capitalized GP with AIM’s investment  Two equity raises ($120mm) to de-lever  Refinance senior notes to lower cost of debt  Distributions expected to grow by $0.01 per unit each quarter through the end of 2015
  • 16.
    16 Merchandise Trust and Perpetual Care Trust Measured Performance* $478 million (Merchandise Trust) – All principal, interest and dividends accrue to StoneMor over time  $340 Million (Perpetual Care) – Principal remains in trust in perpetuity – Interest and dividends accrue to StoneMor Trust Management 6% 8% 7% 9% 8% 12/10 12/11 12/12 12/13 12/14 Merchandise Trust Investment Management  Governed by investment guidelines adopted by Trust and Compliance Committee of B.O.D.  Balanced approach to preservation of capital  Variety of intermediate-term, investment-grade, fixed-income securities, high-yield securities, REITS, MLPs, other equities and cash 7% 6% 6% 5% 4% 12/10 12/11 12/12 12/13 12/14 Perpetual Care Trust *Past performance is not indicative of future performance
  • 17.
    17 Recent Results PRODUCTION-BASED REVENUE ($in millions) ADJUSTED OPERATING PROFIT ($ in millions) DISTRIBUTABLE FCF ($ in millions)  We focus on three non-GAAP financial metrics – Production-Based Revenue: total value of contracts written, investment and other income – Adjusted Operating Profit: normalizes timing differences between GAAP and economic results – Distributable Free Cash Flow: indicator of our ability to pay distributions to our unitholders $296 $327 $357 $386 $0 $50 $100 $150 $200 $250 $300 $350 $400 $450 2012 2013 2014 TTM $54 $67 $67 $67 $0 $10 $20 $30 $40 $50 $60 $70 $80 2012 2013 2014 TTM 1. Grey shading denotes extraordinary gain on settlement agreement, net. $53 $64 $61 $12 $76 $59 $0 $10 $20 $30 $40 $50 $60 $70 $80 2012 2013 2014 TTM (1)
  • 18.
    ($ in millions)($ in millions) REVENUE OPERATING PROFIT 18 Historical Performance  Steady growth as we have built the business through acquisitions and pre-need sales efforts  GAAP results not indicative of true financial performance $3 $10 $14 $6 $14 $5 $38 $49 $54 $67 $67 $67 2010 2011 2012 2013 2014 TTM GAAP Old GAAP $197 $228 $243 $246 $288 $291 $247 $281 $296 $327 $357 $366 2010 2011 2012 2013 2014 TTM GAAP Old GAAP
  • 19.
    Significant Asset Value 19 NETLIQUID ASSETS ($ in millions) FUTURE VALUE-GENERATING ASSETS  Cemetery Property: − $340mm book value − Approximately 15,716 acres − Weighted average sales life of 247 years  Property and Equipment: − $99mm book value, net  Perpetual Care Trusts: − $332mm under management − Fund future maintenance costs  Marketable assets provide debt protection and $154mm of excess value  Assets underlying $67mm of Adjusted Operating Profit generation in 2014  Conservative balance sheet at 6/30/2015 featuring: i. $129 mm of net liquid assets (detail below) ii. Significant additional value from long-term, profit-generating assets of the business $654 $129 $41 $153 $331 $0 $100 $200 $300 $400 $500 $600 $700 Cash, AR and Merchandise Trust AP and Accrued Liabilities Merchandise Liability Debt Excess Cash and Assets
  • 20.
    20  History ofsustained distributions and significant coverage ($ in millions) ADJUSTED OPERATING PROFIT AND DISTRIBUTIONS $36 $38 $49 $54 $67 $67 $67 $27 $32 $45 $47 $52 $63 $71 $13 $3 $10 $14 $6 $14 $3 $0 $10 $20 $30 $40 $50 $60 $70 $80 2009 2010 2011 2012 2013 2014 TTM Adjusted Operating Profit Distributions GAAP Operating Profit Substantial Distribution Coverage
  • 21.
    STON TEN-YEAR AVERAGEANNUAL TOTAL RETURN vs. BENCHMARK ASSET CLASSES 21 Total Return Results 13.4% 12.1% 10.3% 8.0% 7.7% 7.6% 0% 2% 4% 6% 8% 10% 12% 14% 16% StoneMor NASDAQ 100 Alerian MLP Index DJ Utility Index S&P 500 Russell 2000 Source: Bloomberg and Index monthly reports. Market data as of 8-10-15. Total Return %
  • 22.
    22 Stable and GrowingCash Flow Key Attributes of High-Performing MLPs StoneMor? Long-lived, Secure Assets Defensible Competitive Advantage Attractive Industry Fundamentals Conservative Financial Profile  StoneMor features the key attributes of high-performing MLPs, as well as an attractive total return profile. StoneMor Value Proposition Recap
  • 23.
  • 24.
    24  Reconciliation ofProduction Based Revenue (non-GAAP) and Adjusted Operating Profit (non-GAAP) to Revenue (GAAP) and Operating Profit (GAAP) for 2014 and 2013 Appendix Segment Segment Results GAAP GAAP Results GAAP GAAP (non-GAAP) Adjustments Results (non-GAAP) Adjustments Results Revenues Pre-need cemetery revenues 79,905$ (31,418)$ 48,487$ 68,385$ (21,927)$ 46,458$ At-need cemetery revenues 53,411 (3,858) 49,553 42,958 370 43,328 Investment income from trusts 27,626 (14,011) 13,615 25,240 (12,789) 12,451 Interest income 4,384 - 4,384 4,041 - 4,041 Funeral home revenues 33,149 (4,395) 28,754 26,320 (3,095) 23,225 Other cemetery revenues 3,044 405 3,449 5,708 709 6,417 Total revenues (a) 201,519 (53,277) 148,242 172,652 (36,732) 135,920 Costs and expenses Cost of goods sold 22,266 (5,376) 16,890 19,757 (3,603) 16,154 Cemetery expense 35,544 - 35,544 29,470 - 29,470 Selling expense 38,242 (8,563) 29,679 31,027 (4,977) 26,050 General and administrative expense 18,521 - 18,521 16,525 - 16,525 Corporate overhead 18,827 - 18,827 14,002 - 14,002 Depreciation and amortization 5,896 - 5,896 4,881 - 4,881 Funeral home expense 25,286 (987) 24,299 19,139 (417) 18,722 Acquisition related costs, net of recoveries 685 - 685 1,589 - 1,589 Total costs and expenses 165,267 (14,926) 150,341 136,390 (8,997) 127,393 Operating profit (loss) (a) 36,252$ (38,351)$ (2,099)$ 36,262$ (27,735)$ 8,527$ (in thousands) (in thousands) Six months ended Six months ended June 30, 2015 June 30, 2014 (a) The comparisons of these metrics were impacted by the one-time land sale in the first quarter of 2014.