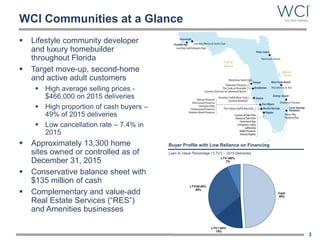
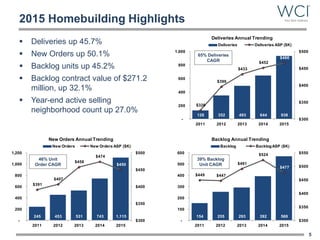
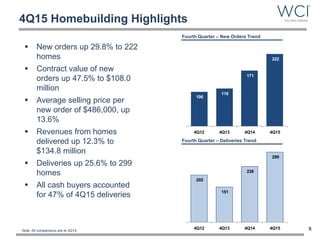
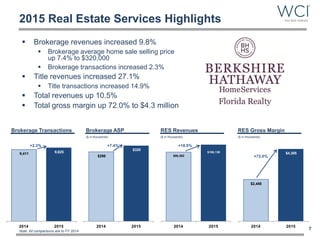
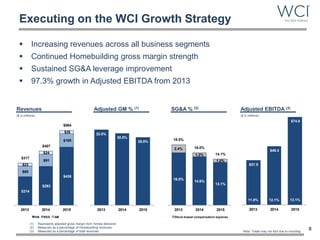
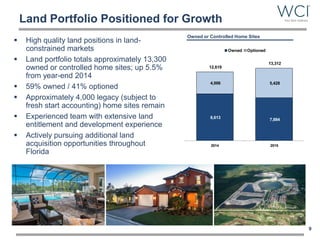
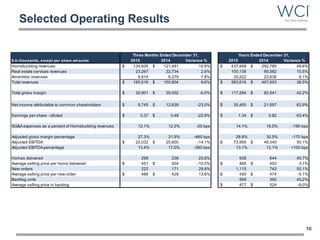
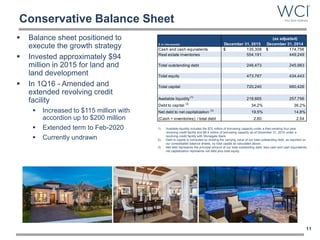
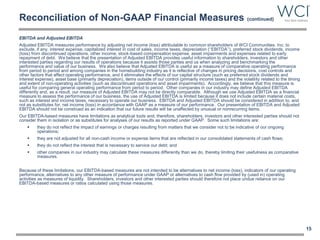
SlideShare a Scribd company logo
WCI Communities
2015 Full Year and Fourth Quarter Earnings Conference Call
February 17, 2016
Disclosure Statement
This presentation contains forward-looking statements. All statements that are not statements of historical fact, including
statements about the Company’s beliefs and expectations, are forward-looking statements within the meaning of the federal
securities laws and should be evaluated as such. Forward-looking statements include information concerning the Company’s
future goals, expected growth, market conditions and outlook (including the estimates, forecasts, statements and projections
relating to Florida or national markets prepared by John Burns Real Estate Consulting, LLC), expected liquidity and possible or
assumed future results of operations, including descriptions of its business plans and strategies. These forward-looking
statements may be identified by the use of such forward-looking terminology, including the terms “believe,” “estimate,” “project,”
“anticipate,” “expect,” “seek,” “predict,” “contemplate,” “continue,” “possible,” “intend,” “may,” “might,” “will,” “could,” “would,”
“should,” “forecast,” or “assume” or, in each case, their negative, or other variations or comparable terminology.
For more information concerning these and other important factors that could cause actual results to differ materially from those
contained in the forward-looking statements, please refer to the Company’s: (i) “Risk Factors” in Item 1A of Part I of our Annual
Report on Form 10-K for the year ended December 31, 2014 that was filed by the Company with the Securities and Exchange
Commission on February 25, 2015 and elsewhere therein; (ii) “Risk Factors” in Item 1A of Part II of our Quarterly Report on Form
10-Q for the quarter ended September 30, 2015 that was filed by the Company with the Securities and Exchange Commission on
October 28, 2015; and (iii) subsequent filings by the Company. As you read and consider this presentation, you should understand
that the forward-looking statements are not guarantees of performance or results. The forward-looking statements and projections
are subject to and involve risks, uncertainties and assumptions and you should not place undue reliance on these forward-looking
statements or projections. Although the Company believes that these forward-looking statements and projections are based on
reasonable assumptions at the time they are made, you should be aware that many factors could affect the Company’s actual
financial results or results of operations and could cause actual results to differ materially from those expressed or implied in the
forward-looking statements and projections. The Company undertakes no obligation to update or revise any forward-looking
statements, whether as a result of new information, future events or otherwise. If the Company does update one or more forward-
looking statement, there should be no inference that it will make additional updates with respect to those or its other forward-
looking statements.
In addition to the financial measures prepared in accordance with U.S. generally accepted accounting principles (“GAAP”), this
presentation contains the non-GAAP financial measures EBITDA, adjusted EBITDA, Adjusted gross margin from homes delivered
and net debt to net capitalization. The reasons for the use of these measures, a reconciliation of these measures to the most
directly comparable GAAP measures and other information relating to these measures are included in the appendix to this
presentation.
2
Cash
49%
LTV 1-64%
15%
LTV 65-80%
29%
LTV >80%
7%
Loan to Value Percentage (“LTV”) – 2015 Deliveries
WCI Communities at a Glance
 Lifestyle community developer
and luxury homebuilder
throughout Florida
 Target move-up, second-home
and active adult customers
 High average selling prices -
$466,000 on 2015 deliveries
 High proportion of cash buyers –
49% of 2015 deliveries
 Low cancellation rate – 7.4% in
2015
 Approximately 13,300 home
sites owned or controlled as of
December 31, 2015
 Conservative balance sheet with
$135 million of cash
 Complementary and value-add
Real Estate Services (“RES”)
and Amenities businesses
3
Buyer Profile with Low Reliance on Financing
0
50,000
100,000
150,000
200,000
250,000
300,000
1996
1997
1998
1999
2000
2001
2002
2003
2004
2005
2006
2007
2008
2009
2010
2011
2012
2013
2014
2015
Single-Family Multi-Family
20 Year Average
Compelling Florida Real Estate Market
 Leading growth state (1) (2) (3)
 Job growth rate of 2.9%; higher
than national average of 1.9%
 Population increased by 366,000
 Consistently ranked among the best
retirement destinations
 Florida building permits (3)
 Second highest in the U.S. in 2015
 Permits still ~60% off peak
 2015 resale statistics (4)
 Closings up 10.3% over 2014
 49th consecutive month median
sales prices increased year-over-
year
 Median days on market <50 days
for both single-family and multi-
family homes
4
(1) Florida Department of Economic Opportunity; January 22, 2016
(2) Wallethub.com – 2016’s Best and Worst States to Retire
(3) U.S. Census Bureau; population measured from July 1, 2014 – July 1, 2015
(4) Florida Realtors ® ; Data through December 2015
Florida Annual Permit Activity (3)
U.S. Age 65+ Population by Decade of Birth
0
5,000,000
10,000,000
15,000,000
20,000,000
25,000,000
30,000,000
35,000,000
40,000,000
45,000,000
50,000,000
55,000,000
60,000,000
65,000,000
70,000,000
1960
1962
1964
1966
1968
1970
1972
1974
1976
1978
1980
1982
1984
1986
1988
1990
1992
1994
1996
1998
2000
2002
2004
2006
2008
2010
2012
2014
2016
2018
2020
2022
2024
65+Population
65+ Population by Decade of Birth
1960s
1950s
1940s
1930s
Pre-1930s
Sources: U.S. Census Bureau; John Burns Real Estate Consulting, LLC
66 million
48 million
245 453 531 743 1,115
$391
$407
$458
$474
$450
$300
$350
$400
$450
$500
-
200
400
600
800
1,000
1,200
2011 2012 2013 2014 2015
New Orders Annual Trending
New Orders New Orders ASP ($K)
154 255 293 392 569
$449 $447
$491
$524
$477
$300
$350
$400
$450
$500
$550
-
100
200
300
400
500
600
2011 2012 2013 2014 2015
Backlog Annual Trending
Backlog BacklogASP ($K)
128 352 493 644 938
$326
$396
$433
$452
$466
$300
$350
$400
$450
$500
-
200
400
600
800
1,000
2011 2012 2013 2014 2015
Deliveries Annual Trending
Deliveries Deliveries ASP ($K)
2015 Homebuilding Highlights
 Deliveries up 45.7%
 New Orders up 50.1%
 Backlog units up 45.2%
 Backlog contract value of $271.2
million, up 32.1%
 Year-end active selling
neighborhood count up 27.0%
5
46% Unit
Order CAGR
65% Deliveries
CAGR
39% Backlog
Unit CAGR
202
151
238
299
4Q12 4Q13 4Q14 4Q15
106
116
171
222
4Q12 4Q13 4Q14 4Q15
4Q15 Homebuilding Highlights
 New orders up 29.8% to 222
homes
 Contract value of new
orders up 47.5% to $108.0
million
 Average selling price per
new order of $486,000, up
13.6%
 Revenues from homes
delivered up 12.3% to
$134.8 million
 Deliveries up 25.6% to 299
homes
 All cash buyers accounted
for 47% of 4Q15 deliveries
6
Fourth Quarter – New Orders Trend
Fourth Quarter – Deliveries Trend
Note: All comparisons are to 4Q14
$90,582
$100,138
2014 2015
+10.5%
$298
$320
2014 2015
+7.4%
9,411 9,625
2014 2015
+2.3%
$2,488
$4,305
2014 2015
+72.0%
2015 Real Estate Services Highlights
7
RES RevenuesBrokerage Transactions Brokerage ASP
 Brokerage revenues increased 9.8%
 Brokerage average home sale selling price
up 7.4% to $320,000
 Brokerage transactions increased 2.3%
 Title revenues increased 27.1%
 Title transactions increased 14.9%
 Total revenues up 10.5%
 Total gross margin up 72.0% to $4.3 million
RES Gross Margin
Note: All comparisons are to FY 2014
($ in thousands) ($ in thousands) ($ in thousands)
$37.5
$49.3
$74.0
11.8% 12.1% 13.1%
2013 2014 2015
Executing on the WCI Growth Strategy
 Increasing revenues across all business segments
 Continued Homebuilding gross margin strength
 Sustained SG&A leverage improvement
 97.3% growth in Adjusted EBITDA from 2013
8
(1) Represents adjusted gross margin from homes delivered
(2) Measured as a percentage of Homebuilding revenues
(3) Measured as a percentage of total revenues
Revenues
($ in millions)
Adjusted EBITDA (3)SG&A % (2)Adjusted GM % (1)
($ in millions)
Note: Totals may not foot due to rounding
$214
$293
$438
$80
$91
$100
$23
$24
$26
$317
$407
$564
2013 2014 2015
HB RES AM
32.0%
30.5%
28.8%
2013 2014 2015
16.0%
14.8%
13.1%
2.4%
1.2%
1.0%
18.5%
16.0%
14.1%
2013 2014 2015
Stock-based compensation expense
8,613 7,884
4,006 5,428
12,619
13,312
2014 2015
Owned Optioned
Land Portfolio Positioned for Growth
 High quality land positions in land-
constrained markets
 Land portfolio totals approximately 13,300
owned or controlled home sites; up 5.5%
from year-end 2014
 59% owned / 41% optioned
 Approximately 4,000 legacy (subject to
fresh start accounting) home sites remain
 Experienced team with extensive land
entitlement and development experience
 Actively pursuing additional land
acquisition opportunities throughout
Florida
9
Owned or Controlled Home Sites
Selected Operating Results
10
$ in thousands, except per share amounts 2015 2014 Variance % 2015 2014 Variance %
Homebuilding revenues 134,835$ 121,491$ 10.9% 437,956$ 292,785$ 49.6%
Real estate services revenues 23,267 22,734 2.6% 100,138 90,582 10.5%
Amenities revenues 6,914 6,379 7.8% 25,522 23,636 8.1%
Total revenues 165,016$ 150,604$ 9.6% 563,616$ 407,003$ 38.5%
Total gross margin 32,901$ 35,002$ -6.0% 117,284$ 82,541$ 42.2%
Net income attributable to common shareholders 9,745$ 12,639$ -23.0% 35,400$ 21,597$ 63.9%
Earnings per share - diluted 0.37$ 0.48$ -22.9% 1.34$ 0.82$ 63.4%
SG&A expenses as a percent of Homebuilding revenues 12.1% 12.3% -20 bps 14.1% 16.0% -190 bps
Adjusted gross margin percentage 27.3% 31.9% -460 bps 28.8% 30.5% -170 bps
Adjusted EBITDA 22,032$ 25,600$ -14.1% 73,959$ 49,340$ 50.1%
Adjusted EBITDA percentage 13.4% 17.0% -360 bps 13.1% 12.1% +100 bps
Homes delivered 299 238 25.6% 938 644 45.7%
Average selling price per home delivered 451$ 504$ -10.5% 466$ 452$ 3.1%
New orders 222 171 29.8% 1,115 743 50.1%
Average selling price per new order 486$ 428$ 13.6% 450$ 474$ -5.1%
Backlog units 569 392 45.2%
Average selling price in backlog 477$ 524$ -9.0%
Three Months Ended December 31, Years Ended December 31,
Conservative Balance Sheet
 Balance sheet positioned to
execute the growth strategy
 Invested approximately $94
million in 2015 for land and
land development
 In 1Q16 - Amended and
extended revolving credit
facility
 Increased to $115 million with
accordion up to $200 million
 Extended term to Feb-2020
 Currently undrawn
11
1) Available liquidity includes the $75 million of borrowing capacity under a then-existing four-year
revolving credit facility and $8.4 million of borrowing capacity as of December 31, 2015 under a
revolving credit facility with Stonegate Bank.
2) Debt to capital is computed by dividing the carrying value of our total outstanding debt, as reported on
our consolidated balance sheets, by total capital as calculated above.
3) Net debt represents the principal amount of our total outstanding debt, less cash and cash equivalents;
net capitalization represents net debt plus total equity.
$ in t housands
Cash and cash equivalents 135,308$ 174,756$
Real estate inventories 554,191 449,249
Total outstanding debt 246,473 245,983
Total equity 473,767 434,443
Total capital 720,240 680,426
Available liquidity
(1)
218,665 257,756
Debt to capital (2)
34.2% 36.2%
Net debt to net capitalization
(3)
19.5% 14.8%
(Cash + inventories) / total debt 2.80 2.54
December 31, 2015
(as adjusted)
December 31, 2014
Key Takeaways
 Florida real estate market remains strong
 Fully integrated Florida luxury homebuilder and
community developer
 Focus on move-up, second-home and active
adult customer segments
 Positioned for continued growth
 Complementary Real Estate Services and
Amenities businesses
 Actively pursuing land acquisition opportunities
 Conservative balance sheet with liquidity and
flexibility for growth
 Experienced and talented team
12
Appendix
2015 2014 2013 2015 2014 2013
Homebuilding gross margin 33,322$ 36,054$ 19,815$ 115,170$ 82,994$ 64,248$
Less: gross margin fromland and home sites - 437 (6) 353 437 195
Gross margin from homes delivered 33,322 35,617 19,821 114,817 82,557 64,053
Add: capitalized interest in cost of sales 3,478 2,653 1,377 10,903 6,306 4,257
Adjustedgross margin from homes delivered 36,800$ 38,270$ 21,198$ 125,720$ 88,863$ 68,310$
Gross margin fromhomes delivered as a
percentage of revenues fromhomes delivered 24.7% 29.7% 28.7% 26.3% 28.3% 30.0%
Adjusted gross margin fromhomes delivered as a
percentage of revenues fromhomes delivered 27.3% 31.9% 30.7% 28.8% 30.5% 32.0%
Years EndedDecember 31,
($ in thousands)
Three Months EndedDecember 31,
Reconciliation of Non-GAAP Financial Measures
In addition to the results reported in accordance with U.S. generally accepted accounting principles (“GAAP”), we have provided information in
this presentation relating to adjusted gross margin from homes delivered, EBITDA and Adjusted EBITDA (both such terms are defined below),
and net debt to net capitalization. Our GAAP-based measures can be found in our audited consolidated financial statements in Item 8 of Part II of
the Annual Report on Form 10-K for the year ended December 31, 2015 that we plan to file with the Securities and Exchange Commission on or
before February 24, 2016. The presentation of historical non-GAAP measures herein does not reflect or endorse any forecast of future financial
performance.
Adjusted Gross Margin from Homes Delivered
We calculate adjusted gross margin from homes delivered by subtracting the gross margin from land and home sites, if any, from Homebuilding
gross margin to arrive at gross margin from homes delivered. Adjusted gross margin from homes delivered is calculated by adding back asset
impairments, if any, and capitalized interest in cost of sales to gross margin from homes delivered. Management uses adjusted gross margin
from homes delivered to evaluate operating performance in our Homebuilding segment and make strategic decisions regarding sales price,
construction and development pace, product mix and other operating decisions. We believe that adjusted gross margin from homes delivered is
(i) meaningful because it eliminates the impact that our indebtedness and asset impairments have on gross margin and (ii) relevant and useful to
shareholders, investors and other interested parties for evaluating our comparative operating performance from period to period and among
companies within the homebuilding industry as it is reflective of overall profitability during any given reporting period. However, this measure is
considered a non-GAAP financial measure and should be considered in addition to, rather than as a substitute for, the comparable GAAP
financial measures when evaluating our operating performance. Although other companies in the homebuilding industry report similar
information, they may calculate this measure differently than we do and, therefore, it may not be comparable. We urge shareholders, investors
and other interested parties to understand the methods used by other companies in the homebuilding industry to calculate gross margins and any
adjustments to such amounts before comparing our measures to those of such other companies.
The table below reconciles adjusted gross margin from homes delivered to the most directly comparable GAAP financial measure, Homebuilding
gross margin, for the periods presented herein.
14
Reconciliation of Non-GAAP Financial Measures (continued)
EBITDA and Adjusted EBITDA
Adjusted EBITDA measures performance by adjusting net income (loss) attributable to common shareholders of WCI Communities, Inc. to
exclude, if any, interest expense, capitalized interest in cost of sales, income taxes, depreciation (‘‘EBITDA’’), preferred stock dividends, income
(loss) from discontinued operations, other income, stock-based compensation expense, asset impairments and expenses related to early
repayment of debt. We believe that the presentation of Adjusted EBITDA provides useful information to shareholders, investors and other
interested parties regarding our results of operations because it assists those parties and us when analyzing and benchmarking the
performance and value of our business. We also believe that Adjusted EBITDA is useful as a measure of comparative operating performance
from period to period and among companies in the homebuilding industry as it is reflective of changes in pricing decisions, cost controls and
other factors that affect operating performance, and it eliminates the effects of our capital structure (such as preferred stock dividends and
interest expense), asset base (primarily depreciation), items outside of our control (primarily income taxes) and the volatility related to the timing
and extent of non-operating activities (such as discontinued operations and asset impairments). Accordingly, we believe that this measure is
useful for comparing general operating performance from period to period. Other companies in our industry may define Adjusted EBITDA
differently and, as a result, our measure of Adjusted EBITDA may not be directly comparable. Although we use Adjusted EBITDA as a financial
measure to assess the performance of our business, the use of Adjusted EBITDA is limited because it does not include certain material costs,
such as interest and income taxes, necessary to operate our business. EBITDA and Adjusted EBITDA should be considered in addition to, and
not as substitutes for, net income (loss) in accordance with GAAP as a measure of our performance. Our presentation of EBITDA and Adjusted
EBITDA should not be construed as an indication that our future results will be unaffected by unusual or nonrecurring items.
Our EBITDA-based measures have limitations as analytical tools and, therefore, shareholders, investors and other interested parties should not
consider them in isolation or as substitutes for analyses of our results as reported under GAAP. Some such limitations are:
 they do not reflect the impact of earnings or charges resulting from matters that we consider not to be indicative of our ongoing
operations;
 they are not adjusted for all non-cash income or expense items that are reflected in our consolidated statements of cash flows;
 they do not reflect the interest that is necessary to service our debt; and
 other companies in our industry may calculate these measures differently than we do, thereby limiting their usefulness as comparative
measures.
Because of these limitations, our EBITDA-based measures are not intended to be alternatives to net income (loss), indicators of our operating
performance, alternatives to any other measure of performance under GAAP or alternatives to cash flow provided by (used in) operating
activities as measures of liquidity. Shareholders, investors and other interested parties should therefore not place undue reliance on our
EBITDA-based measures or ratios calculated using those measures.
15
Reconciliation of Non-GAAP Financial Measures (continued)
EBITDA and Adjusted EBITDA (continued)
The table below reconciles EBITDA and Adjusted EBITDA to the most directly comparable GAAP financial measure, net income (loss)
attributable to common shareholders of WCI Communities, Inc., for the periods presented herein.
16
1) Represents capitalized interest expensed in cost of sales on home deliveries and land and home site sales.
2) Represents a reduction in net income attributable to WCI Communities, Inc. pertaining to its preferred stock wherein we (i) exchanged
903,825 shares of our common stock (valued at $19.0 million) for 10,000 outstanding shares of our Series A preferred stock during July
2013 and (ii) paid $0.7 million in cash to purchase the one outstanding share of our Series B preferred stock during April 2013. All such
shares of preferred stock, which were carried at a nominal value on our consolidated balance sheets, have been cancelled and retired. In
accordance with Accounting Standards Codification 260, Earnings Per Share, paragraph 10-S99-2, any difference between the
consideration transferred to our preferred stock shareholders and the corresponding book value has been (i) characterized as a preferred
stock dividend in the Company’s consolidated statements of operations during the year that the related transaction was completed and (ii)
deducted from net income attributable to WCI Communities, Inc. to arrive at net income attributable to common shareholders of WCI
Communities, Inc.
3) Represents the expense recorded in the Company’s consolidated statements of operations related to its stock-based compensation plans.
4) Represents an impairment charge recorded in the Company’s consolidated statements of operations during the year ended December 31,
2014 in connection with the write-down to fair value of one of its Amenities assets.
5) Represents expenses related to early repayment of debt as reported in the Company’s consolidated statements of operations, including
write-offs of unamortized debt discount and debt issuance costs and a prepayment premium related to our voluntary prepayment of the
entire outstanding principal amount of the Company’s Senior Secured Term Notes due 2017 in August 2013.
2015 2014 2013 2015 2014 2013
Net income attributable to common
shareholders of WCI Communities, Inc. 9,745$ 12,639$ 135,198$ 35,400$ 21,597$ 126,968$
Interest expense 190 264 739 848 1,140 2,537
Capitalized interest in cost of sales (1) 3,478 2,653 1,377 10,903 6,306 4,257
Income taxexpense (benefit) 7,035 8,315 (125,624) 20,427 14,652 (125,709)
Depreciation 750 717 568 2,984 2,627 2,081
EBITDA 21,198 24,588 12,258 70,562 46,322 10,134
Preferred stock dividends (2) - - - - - 19,680
Other income, net (217) (1,069) (1,393) (810) (1,604) (2,642)
Stock-based compensation expense (3) 1,051 881 905 4,207 3,422 5,217
Asset impairment (4) - 1,200 - - 1,200 -
Expenses related to early repayment of debt (5) - - - - - 5,105
AdjustedEBITDA 22,032$ 25,600$ 11,770$ 73,959$ 49,340$ 37,494$
Adjusted EBITDA margin 13.4% 17.0% 12.4% 13.1% 12.1% 11.8%
Years EndedDecember 31,
($ in thousands)
Three Months EndedDecember 31,
Reconciliation of Non-GAAP Financial Measures (continued)
Net Debt to Net Capitalization
We believe that net debt to net capitalization provides useful information to shareholders, investors and other interested parties regarding our
financial position and cash and debt management. It is also a relevant financial measure for understanding the leverage employed in our
operations and as an indicator of our ability to obtain future financing. However, this measure is considered a non-GAAP financial measure and
should be considered in addition to, rather than as a substitute for, the comparable GAAP financial measures when evaluating our leverage.
By deducting cash and cash equivalents from our outstanding debt, we provide a measure of our debt that considers our cash position. We
believe that this approach provides useful information because the ratio of debt to capital does not consider our cash and cash equivalents and
we believe that a debt ratio net of cash, such as net debt to net capitalization, provides supplemental information by which our financial position
may be considered. Shareholders, investors and other interested parties may also find this information helpful when comparing our leverage to
the leverage of other companies in our industry. Although other companies in the homebuilding industry report similar information, they may
calculate this measure differently than we do and, therefore, it may not be comparable. We urge shareholders, investors and other interested
parties to understand the methods used by other companies in the homebuilding industry to calculate leverage ratios such as net debt to net
capitalization, including any adjustments to such amounts, before comparing our measures to those of such other companies.
The table below presents the computations of our net debt to net capitalization and reconciles such amounts to the most directly comparable
GAAP financial measure, debt to capital. Certain amounts included in such table have been retroactively adjusted to reflect the adoption of
Accounting Standards Update 2015-03, Simplifying the Presentation of Debt Issuance Costs, which is discussed in Note 1 to the audited
consolidated financial statements included in Item 8 of Part II of the Annual Report on Form 10-K for the year ended December 31, 2015 that we
plan to file with the Securities and Exchange Commission on or before February 24, 2016.
17
1) Debt to capital is computed by dividing the carrying value of our total outstanding debt, as reported on our consolidated balance sheets, by total capital as calculated above.
2) Net debt to net capitalization is computed by dividing net debt by net capitalization.
2015 2014
Total outstanding debt 246,473$ 245,983$
Total equity 473,767 434,443
Total capital 720,240$ 680,426$
Debt to capital (1) 34.2% 36.2%
Total outstanding debt 246,473$ 245,983$
Unamortized debt premium (1,031) (1,179)
Unamortized debt issuance costs 4,558 5,196
Principal amount of total outstanding debt 250,000 250,000
Less: cash and cash equivalents 135,308 174,756
Net debt 114,692 75,244
Total equity 473,767 434,443
Net capitalization 588,459$ 509,687$
Net debt to net capitalization (2) 19.5% 14.8%
December 31,
($ in thousands)

More Related Content

What's hot

March 2016 investor relations presentation 3 3-16
March 2016 investor relations presentation 3 3-16March 2016 investor relations presentation 3 3-16
March 2016 investor relations presentation 3 3-16
XOGroup
 
4 q16 earnings presentation
4 q16 earnings presentation4 q16 earnings presentation
4 q16 earnings presentation
corridorinfra2016ir
 
Psx 2017 baml conference presentation final for posting
Psx 2017 baml conference presentation final for postingPsx 2017 baml conference presentation final for posting
Psx 2017 baml conference presentation final for posting
investor_phillips66
 
The Brink's Company First Quarter 2017 Results Presentation
The Brink's Company First Quarter 2017 Results PresentationThe Brink's Company First Quarter 2017 Results Presentation
The Brink's Company First Quarter 2017 Results Presentation
investorsbrinks
 
Enlk and enlc first quarter 2017 operations report
Enlk and enlc first quarter 2017 operations reportEnlk and enlc first quarter 2017 operations report
Enlk and enlc first quarter 2017 operations report
EnLinkMidstreamLLC
 
Combined 12 8-17-main event_pdf version_final
Combined 12 8-17-main event_pdf version_finalCombined 12 8-17-main event_pdf version_final
Combined 12 8-17-main event_pdf version_final
ir_westrock
 
Lvs 3 q17 earnings deck final
Lvs 3 q17 earnings deck   finalLvs 3 q17 earnings deck   final
Lvs 3 q17 earnings deck final
Investor_lvs
 
4 q15 external earnings_presentation_2016-02-04_final
4 q15 external earnings_presentation_2016-02-04_final4 q15 external earnings_presentation_2016-02-04_final
4 q15 external earnings_presentation_2016-02-04_final
Level3_Communications
 
2015 Delta Investor Day Presentation
2015 Delta Investor Day Presentation2015 Delta Investor Day Presentation
2015 Delta Investor Day Presentation
Delta_Airlines
 
02 24-16 fourth quarter &amp; fy 2015 financial review final
02 24-16 fourth quarter &amp; fy 2015 financial review final02 24-16 fourth quarter &amp; fy 2015 financial review final
02 24-16 fourth quarter &amp; fy 2015 financial review final
AES_BigSky
 
Ugi investor day combined_v_final
Ugi investor day combined_v_finalUgi investor day combined_v_final
Ugi investor day combined_v_final
UGI_Corporation
 
Q3 15 earnings slides-final
Q3 15 earnings slides-finalQ3 15 earnings slides-final
Q3 15 earnings slides-final
InvestorBruker
 
06 26-16 jpm energy conference final
06 26-16 jpm energy conference final06 26-16 jpm energy conference final
06 26-16 jpm energy conference final
AES_BigSky
 
Brink's investor-meetings-june-2017
Brink's investor-meetings-june-2017Brink's investor-meetings-june-2017
Brink's investor-meetings-june-2017
investorsbrinks
 
Thermal Energy FY2021 Q2 Financial Summary
Thermal Energy FY2021 Q2 Financial SummaryThermal Energy FY2021 Q2 Financial Summary
Thermal Energy FY2021 Q2 Financial Summary
Thermal Energy International Inc.
 
Barnes Group Inc. Investor Overview - November 2016
Barnes Group Inc. Investor Overview - November 2016Barnes Group Inc. Investor Overview - November 2016
Barnes Group Inc. Investor Overview - November 2016
Barnes_Group
 
Molson coors boston 2017 slides final
Molson coors boston 2017 slides finalMolson coors boston 2017 slides final
Molson coors boston 2017 slides final
molsoncoorsir
 
Management Investor Presentation - Q2 2015
Management Investor Presentation - Q2 2015Management Investor Presentation - Q2 2015
Management Investor Presentation - Q2 2015
RioCan
 
Q1 2017 investor deck final 5.8.17
Q1 2017 investor deck final 5.8.17Q1 2017 investor deck final 5.8.17
Q1 2017 investor deck final 5.8.17
ADAESIR
 
AES Q2 2016 Financial Review
AES Q2 2016 Financial Review AES Q2 2016 Financial Review
AES Q2 2016 Financial Review
AES_BigSky
 

What's hot (20)

March 2016 investor relations presentation 3 3-16
March 2016 investor relations presentation 3 3-16March 2016 investor relations presentation 3 3-16
March 2016 investor relations presentation 3 3-16
 
4 q16 earnings presentation
4 q16 earnings presentation4 q16 earnings presentation
4 q16 earnings presentation
 
Psx 2017 baml conference presentation final for posting
Psx 2017 baml conference presentation final for postingPsx 2017 baml conference presentation final for posting
Psx 2017 baml conference presentation final for posting
 
The Brink's Company First Quarter 2017 Results Presentation
The Brink's Company First Quarter 2017 Results PresentationThe Brink's Company First Quarter 2017 Results Presentation
The Brink's Company First Quarter 2017 Results Presentation
 
Enlk and enlc first quarter 2017 operations report
Enlk and enlc first quarter 2017 operations reportEnlk and enlc first quarter 2017 operations report
Enlk and enlc first quarter 2017 operations report
 
Combined 12 8-17-main event_pdf version_final
Combined 12 8-17-main event_pdf version_finalCombined 12 8-17-main event_pdf version_final
Combined 12 8-17-main event_pdf version_final
 
Lvs 3 q17 earnings deck final
Lvs 3 q17 earnings deck   finalLvs 3 q17 earnings deck   final
Lvs 3 q17 earnings deck final
 
4 q15 external earnings_presentation_2016-02-04_final
4 q15 external earnings_presentation_2016-02-04_final4 q15 external earnings_presentation_2016-02-04_final
4 q15 external earnings_presentation_2016-02-04_final
 
2015 Delta Investor Day Presentation
2015 Delta Investor Day Presentation2015 Delta Investor Day Presentation
2015 Delta Investor Day Presentation
 
02 24-16 fourth quarter &amp; fy 2015 financial review final
02 24-16 fourth quarter &amp; fy 2015 financial review final02 24-16 fourth quarter &amp; fy 2015 financial review final
02 24-16 fourth quarter &amp; fy 2015 financial review final
 
Ugi investor day combined_v_final
Ugi investor day combined_v_finalUgi investor day combined_v_final
Ugi investor day combined_v_final
 
Q3 15 earnings slides-final
Q3 15 earnings slides-finalQ3 15 earnings slides-final
Q3 15 earnings slides-final
 
06 26-16 jpm energy conference final
06 26-16 jpm energy conference final06 26-16 jpm energy conference final
06 26-16 jpm energy conference final
 
Brink's investor-meetings-june-2017
Brink's investor-meetings-june-2017Brink's investor-meetings-june-2017
Brink's investor-meetings-june-2017
 
Thermal Energy FY2021 Q2 Financial Summary
Thermal Energy FY2021 Q2 Financial SummaryThermal Energy FY2021 Q2 Financial Summary
Thermal Energy FY2021 Q2 Financial Summary
 
Barnes Group Inc. Investor Overview - November 2016
Barnes Group Inc. Investor Overview - November 2016Barnes Group Inc. Investor Overview - November 2016
Barnes Group Inc. Investor Overview - November 2016
 
Molson coors boston 2017 slides final
Molson coors boston 2017 slides finalMolson coors boston 2017 slides final
Molson coors boston 2017 slides final
 
Management Investor Presentation - Q2 2015
Management Investor Presentation - Q2 2015Management Investor Presentation - Q2 2015
Management Investor Presentation - Q2 2015
 
Q1 2017 investor deck final 5.8.17
Q1 2017 investor deck final 5.8.17Q1 2017 investor deck final 5.8.17
Q1 2017 investor deck final 5.8.17
 
AES Q2 2016 Financial Review
AES Q2 2016 Financial Review AES Q2 2016 Financial Review
AES Q2 2016 Financial Review
 

Similar to 4 q15 earnings slide deck final

2014 Fourth Quarter Earnings Release Conference Call
2014 Fourth Quarter Earnings Release Conference Call2014 Fourth Quarter Earnings Release Conference Call
2014 Fourth Quarter Earnings Release Conference Call
investorswci
 
Second Quarter 2015 Earnings Conference Call
Second Quarter 2015 Earnings Conference CallSecond Quarter 2015 Earnings Conference Call
Second Quarter 2015 Earnings Conference Call
investorswci
 
Third Quarter 2015 Earnings Conference Call October 28, 2015
Third Quarter 2015 Earnings Conference Call October 28, 2015Third Quarter 2015 Earnings Conference Call October 28, 2015
Third Quarter 2015 Earnings Conference Call October 28, 2015
investorswci
 
WCI 1Q15 Earnings Presentation
WCI 1Q15 Earnings PresentationWCI 1Q15 Earnings Presentation
WCI 1Q15 Earnings Presentation
investorswci
 
2q16 earnings presentation-final
2q16 earnings presentation-final2q16 earnings presentation-final
2q16 earnings presentation-final
investorswci
 
WCI 3Q14 Earnings Presentation
WCI 3Q14 Earnings PresentationWCI 3Q14 Earnings Presentation
WCI 3Q14 Earnings Presentation
investorswci
 
3 q14 earnings-presentation-fin-al
3 q14 earnings-presentation-fin-al3 q14 earnings-presentation-fin-al
3 q14 earnings-presentation-fin-al
investorswci
 
Investor presentation august 2015
Investor presentation august 2015Investor presentation august 2015
Investor presentation august 2015
StoneMor
 
Beazley results2016
Beazley results2016Beazley results2016
Beazley results2016
Company Spotlight
 
Raymond James Annual Institutional Investors Conference
Raymond James Annual Institutional Investors ConferenceRaymond James Annual Institutional Investors Conference
Raymond James Annual Institutional Investors ConferenceProgressiveWaste
 
Bin ir presentation feb 27, 2014 final
Bin ir presentation feb 27, 2014 finalBin ir presentation feb 27, 2014 final
Bin ir presentation feb 27, 2014 finalProgressiveWaste
 
Q2 2015 earnings presentation
Q2 2015 earnings presentationQ2 2015 earnings presentation
Q2 2015 earnings presentation
Masco_Investors
 
Cibc presentation feb 27, 2014
Cibc presentation feb 27, 2014Cibc presentation feb 27, 2014
Cibc presentation feb 27, 2014ProgressiveWaste
 
Cs conference slides march 10, 2014
Cs conference slides march 10, 2014Cs conference slides march 10, 2014
Cs conference slides march 10, 2014ProgressiveWaste
 
Guidance presentation jan 2015 final2
Guidance presentation jan 2015 final2Guidance presentation jan 2015 final2
Guidance presentation jan 2015 final2
Valeant_Pharmaceuticals
 
2015 asm presentation final
2015 asm presentation final2015 asm presentation final
2015 asm presentation final
Oshkosh_Investors
 
Q1 2015 Earnings Presentation
Q1 2015 Earnings PresentationQ1 2015 Earnings Presentation
Q1 2015 Earnings Presentation
Masco_Investors
 
Credit Suisse Environmental and Industrial Services Conference 2014
 Credit Suisse Environmental and Industrial Services Conference 2014 Credit Suisse Environmental and Industrial Services Conference 2014
Credit Suisse Environmental and Industrial Services Conference 2014
ProgressiveWaste
 
fy-results-presentation-10-02-2022.pdf
fy-results-presentation-10-02-2022.pdffy-results-presentation-10-02-2022.pdf
fy-results-presentation-10-02-2022.pdf
CharlesSantos684817
 
RBC Capital Markets' Global Industrials Conference
RBC Capital Markets' Global Industrials ConferenceRBC Capital Markets' Global Industrials Conference
RBC Capital Markets' Global Industrials ConferenceProgressiveWaste
 

Similar to 4 q15 earnings slide deck final (20)

2014 Fourth Quarter Earnings Release Conference Call
2014 Fourth Quarter Earnings Release Conference Call2014 Fourth Quarter Earnings Release Conference Call
2014 Fourth Quarter Earnings Release Conference Call
 
Second Quarter 2015 Earnings Conference Call
Second Quarter 2015 Earnings Conference CallSecond Quarter 2015 Earnings Conference Call
Second Quarter 2015 Earnings Conference Call
 
Third Quarter 2015 Earnings Conference Call October 28, 2015
Third Quarter 2015 Earnings Conference Call October 28, 2015Third Quarter 2015 Earnings Conference Call October 28, 2015
Third Quarter 2015 Earnings Conference Call October 28, 2015
 
WCI 1Q15 Earnings Presentation
WCI 1Q15 Earnings PresentationWCI 1Q15 Earnings Presentation
WCI 1Q15 Earnings Presentation
 
2q16 earnings presentation-final
2q16 earnings presentation-final2q16 earnings presentation-final
2q16 earnings presentation-final
 
WCI 3Q14 Earnings Presentation
WCI 3Q14 Earnings PresentationWCI 3Q14 Earnings Presentation
WCI 3Q14 Earnings Presentation
 
3 q14 earnings-presentation-fin-al
3 q14 earnings-presentation-fin-al3 q14 earnings-presentation-fin-al
3 q14 earnings-presentation-fin-al
 
Investor presentation august 2015
Investor presentation august 2015Investor presentation august 2015
Investor presentation august 2015
 
Beazley results2016
Beazley results2016Beazley results2016
Beazley results2016
 
Raymond James Annual Institutional Investors Conference
Raymond James Annual Institutional Investors ConferenceRaymond James Annual Institutional Investors Conference
Raymond James Annual Institutional Investors Conference
 
Bin ir presentation feb 27, 2014 final
Bin ir presentation feb 27, 2014 finalBin ir presentation feb 27, 2014 final
Bin ir presentation feb 27, 2014 final
 
Q2 2015 earnings presentation
Q2 2015 earnings presentationQ2 2015 earnings presentation
Q2 2015 earnings presentation
 
Cibc presentation feb 27, 2014
Cibc presentation feb 27, 2014Cibc presentation feb 27, 2014
Cibc presentation feb 27, 2014
 
Cs conference slides march 10, 2014
Cs conference slides march 10, 2014Cs conference slides march 10, 2014
Cs conference slides march 10, 2014
 
Guidance presentation jan 2015 final2
Guidance presentation jan 2015 final2Guidance presentation jan 2015 final2
Guidance presentation jan 2015 final2
 
2015 asm presentation final
2015 asm presentation final2015 asm presentation final
2015 asm presentation final
 
Q1 2015 Earnings Presentation
Q1 2015 Earnings PresentationQ1 2015 Earnings Presentation
Q1 2015 Earnings Presentation
 
Credit Suisse Environmental and Industrial Services Conference 2014
 Credit Suisse Environmental and Industrial Services Conference 2014 Credit Suisse Environmental and Industrial Services Conference 2014
Credit Suisse Environmental and Industrial Services Conference 2014
 
fy-results-presentation-10-02-2022.pdf
fy-results-presentation-10-02-2022.pdffy-results-presentation-10-02-2022.pdf
fy-results-presentation-10-02-2022.pdf
 
RBC Capital Markets' Global Industrials Conference
RBC Capital Markets' Global Industrials ConferenceRBC Capital Markets' Global Industrials Conference
RBC Capital Markets' Global Industrials Conference
 

Recently uploaded

Investor Day 2024 Presentation Sysco 2024
Investor Day 2024 Presentation Sysco 2024Investor Day 2024 Presentation Sysco 2024
Investor Day 2024 Presentation Sysco 2024
Sysco_Investors
 
Collective Mining | Corporate Presentation - May 2024
Collective Mining | Corporate Presentation - May 2024Collective Mining | Corporate Presentation - May 2024
Collective Mining | Corporate Presentation - May 2024
CollectiveMining1
 
2024-deutsche-bank-global-consumer-conference.pdf
2024-deutsche-bank-global-consumer-conference.pdf2024-deutsche-bank-global-consumer-conference.pdf
2024-deutsche-bank-global-consumer-conference.pdf
Sysco_Investors
 
Corporate Presentation Probe June 2024.pdf
Corporate Presentation Probe June 2024.pdfCorporate Presentation Probe June 2024.pdf
Corporate Presentation Probe June 2024.pdf
Probe Gold
 
一比一原版(UW毕业证)华盛顿大学毕业证成绩单专业办理
一比一原版(UW毕业证)华盛顿大学毕业证成绩单专业办理一比一原版(UW毕业证)华盛顿大学毕业证成绩单专业办理
一比一原版(UW毕业证)华盛顿大学毕业证成绩单专业办理
ybout
 
Snam 2023-27 Industrial Plan - Financial Presentation
Snam 2023-27 Industrial Plan - Financial PresentationSnam 2023-27 Industrial Plan - Financial Presentation
Snam 2023-27 Industrial Plan - Financial Presentation
Valentina Ottini
 
Osisko Development - Investor Presentation - June 24
Osisko Development - Investor Presentation - June 24Osisko Development - Investor Presentation - June 24
Osisko Development - Investor Presentation - June 24
Philip Rabenok
 
cyberagent_For New Investors_EN_240424.pdf
cyberagent_For New Investors_EN_240424.pdfcyberagent_For New Investors_EN_240424.pdf
cyberagent_For New Investors_EN_240424.pdf
CyberAgent, Inc.
 

Recently uploaded (8)

Investor Day 2024 Presentation Sysco 2024
Investor Day 2024 Presentation Sysco 2024Investor Day 2024 Presentation Sysco 2024
Investor Day 2024 Presentation Sysco 2024
 
Collective Mining | Corporate Presentation - May 2024
Collective Mining | Corporate Presentation - May 2024Collective Mining | Corporate Presentation - May 2024
Collective Mining | Corporate Presentation - May 2024
 
2024-deutsche-bank-global-consumer-conference.pdf
2024-deutsche-bank-global-consumer-conference.pdf2024-deutsche-bank-global-consumer-conference.pdf
2024-deutsche-bank-global-consumer-conference.pdf
 
Corporate Presentation Probe June 2024.pdf
Corporate Presentation Probe June 2024.pdfCorporate Presentation Probe June 2024.pdf
Corporate Presentation Probe June 2024.pdf
 
一比一原版(UW毕业证)华盛顿大学毕业证成绩单专业办理
一比一原版(UW毕业证)华盛顿大学毕业证成绩单专业办理一比一原版(UW毕业证)华盛顿大学毕业证成绩单专业办理
一比一原版(UW毕业证)华盛顿大学毕业证成绩单专业办理
 
Snam 2023-27 Industrial Plan - Financial Presentation
Snam 2023-27 Industrial Plan - Financial PresentationSnam 2023-27 Industrial Plan - Financial Presentation
Snam 2023-27 Industrial Plan - Financial Presentation
 
Osisko Development - Investor Presentation - June 24
Osisko Development - Investor Presentation - June 24Osisko Development - Investor Presentation - June 24
Osisko Development - Investor Presentation - June 24
 
cyberagent_For New Investors_EN_240424.pdf
cyberagent_For New Investors_EN_240424.pdfcyberagent_For New Investors_EN_240424.pdf
cyberagent_For New Investors_EN_240424.pdf
 

4 q15 earnings slide deck final

  • 1. WCI Communities 2015 Full Year and Fourth Quarter Earnings Conference Call February 17, 2016
  • 2. Disclosure Statement This presentation contains forward-looking statements. All statements that are not statements of historical fact, including statements about the Company’s beliefs and expectations, are forward-looking statements within the meaning of the federal securities laws and should be evaluated as such. Forward-looking statements include information concerning the Company’s future goals, expected growth, market conditions and outlook (including the estimates, forecasts, statements and projections relating to Florida or national markets prepared by John Burns Real Estate Consulting, LLC), expected liquidity and possible or assumed future results of operations, including descriptions of its business plans and strategies. These forward-looking statements may be identified by the use of such forward-looking terminology, including the terms “believe,” “estimate,” “project,” “anticipate,” “expect,” “seek,” “predict,” “contemplate,” “continue,” “possible,” “intend,” “may,” “might,” “will,” “could,” “would,” “should,” “forecast,” or “assume” or, in each case, their negative, or other variations or comparable terminology. For more information concerning these and other important factors that could cause actual results to differ materially from those contained in the forward-looking statements, please refer to the Company’s: (i) “Risk Factors” in Item 1A of Part I of our Annual Report on Form 10-K for the year ended December 31, 2014 that was filed by the Company with the Securities and Exchange Commission on February 25, 2015 and elsewhere therein; (ii) “Risk Factors” in Item 1A of Part II of our Quarterly Report on Form 10-Q for the quarter ended September 30, 2015 that was filed by the Company with the Securities and Exchange Commission on October 28, 2015; and (iii) subsequent filings by the Company. As you read and consider this presentation, you should understand that the forward-looking statements are not guarantees of performance or results. The forward-looking statements and projections are subject to and involve risks, uncertainties and assumptions and you should not place undue reliance on these forward-looking statements or projections. Although the Company believes that these forward-looking statements and projections are based on reasonable assumptions at the time they are made, you should be aware that many factors could affect the Company’s actual financial results or results of operations and could cause actual results to differ materially from those expressed or implied in the forward-looking statements and projections. The Company undertakes no obligation to update or revise any forward-looking statements, whether as a result of new information, future events or otherwise. If the Company does update one or more forward- looking statement, there should be no inference that it will make additional updates with respect to those or its other forward- looking statements. In addition to the financial measures prepared in accordance with U.S. generally accepted accounting principles (“GAAP”), this presentation contains the non-GAAP financial measures EBITDA, adjusted EBITDA, Adjusted gross margin from homes delivered and net debt to net capitalization. The reasons for the use of these measures, a reconciliation of these measures to the most directly comparable GAAP measures and other information relating to these measures are included in the appendix to this presentation. 2
  • 3. Cash 49% LTV 1-64% 15% LTV 65-80% 29% LTV >80% 7% Loan to Value Percentage (“LTV”) – 2015 Deliveries WCI Communities at a Glance  Lifestyle community developer and luxury homebuilder throughout Florida  Target move-up, second-home and active adult customers  High average selling prices - $466,000 on 2015 deliveries  High proportion of cash buyers – 49% of 2015 deliveries  Low cancellation rate – 7.4% in 2015  Approximately 13,300 home sites owned or controlled as of December 31, 2015  Conservative balance sheet with $135 million of cash  Complementary and value-add Real Estate Services (“RES”) and Amenities businesses 3 Buyer Profile with Low Reliance on Financing
  • 4. 0 50,000 100,000 150,000 200,000 250,000 300,000 1996 1997 1998 1999 2000 2001 2002 2003 2004 2005 2006 2007 2008 2009 2010 2011 2012 2013 2014 2015 Single-Family Multi-Family 20 Year Average Compelling Florida Real Estate Market  Leading growth state (1) (2) (3)  Job growth rate of 2.9%; higher than national average of 1.9%  Population increased by 366,000  Consistently ranked among the best retirement destinations  Florida building permits (3)  Second highest in the U.S. in 2015  Permits still ~60% off peak  2015 resale statistics (4)  Closings up 10.3% over 2014  49th consecutive month median sales prices increased year-over- year  Median days on market <50 days for both single-family and multi- family homes 4 (1) Florida Department of Economic Opportunity; January 22, 2016 (2) Wallethub.com – 2016’s Best and Worst States to Retire (3) U.S. Census Bureau; population measured from July 1, 2014 – July 1, 2015 (4) Florida Realtors ® ; Data through December 2015 Florida Annual Permit Activity (3) U.S. Age 65+ Population by Decade of Birth 0 5,000,000 10,000,000 15,000,000 20,000,000 25,000,000 30,000,000 35,000,000 40,000,000 45,000,000 50,000,000 55,000,000 60,000,000 65,000,000 70,000,000 1960 1962 1964 1966 1968 1970 1972 1974 1976 1978 1980 1982 1984 1986 1988 1990 1992 1994 1996 1998 2000 2002 2004 2006 2008 2010 2012 2014 2016 2018 2020 2022 2024 65+Population 65+ Population by Decade of Birth 1960s 1950s 1940s 1930s Pre-1930s Sources: U.S. Census Bureau; John Burns Real Estate Consulting, LLC 66 million 48 million
  • 5. 245 453 531 743 1,115 $391 $407 $458 $474 $450 $300 $350 $400 $450 $500 - 200 400 600 800 1,000 1,200 2011 2012 2013 2014 2015 New Orders Annual Trending New Orders New Orders ASP ($K) 154 255 293 392 569 $449 $447 $491 $524 $477 $300 $350 $400 $450 $500 $550 - 100 200 300 400 500 600 2011 2012 2013 2014 2015 Backlog Annual Trending Backlog BacklogASP ($K) 128 352 493 644 938 $326 $396 $433 $452 $466 $300 $350 $400 $450 $500 - 200 400 600 800 1,000 2011 2012 2013 2014 2015 Deliveries Annual Trending Deliveries Deliveries ASP ($K) 2015 Homebuilding Highlights  Deliveries up 45.7%  New Orders up 50.1%  Backlog units up 45.2%  Backlog contract value of $271.2 million, up 32.1%  Year-end active selling neighborhood count up 27.0% 5 46% Unit Order CAGR 65% Deliveries CAGR 39% Backlog Unit CAGR
  • 6. 202 151 238 299 4Q12 4Q13 4Q14 4Q15 106 116 171 222 4Q12 4Q13 4Q14 4Q15 4Q15 Homebuilding Highlights  New orders up 29.8% to 222 homes  Contract value of new orders up 47.5% to $108.0 million  Average selling price per new order of $486,000, up 13.6%  Revenues from homes delivered up 12.3% to $134.8 million  Deliveries up 25.6% to 299 homes  All cash buyers accounted for 47% of 4Q15 deliveries 6 Fourth Quarter – New Orders Trend Fourth Quarter – Deliveries Trend Note: All comparisons are to 4Q14
  • 7. $90,582 $100,138 2014 2015 +10.5% $298 $320 2014 2015 +7.4% 9,411 9,625 2014 2015 +2.3% $2,488 $4,305 2014 2015 +72.0% 2015 Real Estate Services Highlights 7 RES RevenuesBrokerage Transactions Brokerage ASP  Brokerage revenues increased 9.8%  Brokerage average home sale selling price up 7.4% to $320,000  Brokerage transactions increased 2.3%  Title revenues increased 27.1%  Title transactions increased 14.9%  Total revenues up 10.5%  Total gross margin up 72.0% to $4.3 million RES Gross Margin Note: All comparisons are to FY 2014 ($ in thousands) ($ in thousands) ($ in thousands)
  • 8. $37.5 $49.3 $74.0 11.8% 12.1% 13.1% 2013 2014 2015 Executing on the WCI Growth Strategy  Increasing revenues across all business segments  Continued Homebuilding gross margin strength  Sustained SG&A leverage improvement  97.3% growth in Adjusted EBITDA from 2013 8 (1) Represents adjusted gross margin from homes delivered (2) Measured as a percentage of Homebuilding revenues (3) Measured as a percentage of total revenues Revenues ($ in millions) Adjusted EBITDA (3)SG&A % (2)Adjusted GM % (1) ($ in millions) Note: Totals may not foot due to rounding $214 $293 $438 $80 $91 $100 $23 $24 $26 $317 $407 $564 2013 2014 2015 HB RES AM 32.0% 30.5% 28.8% 2013 2014 2015 16.0% 14.8% 13.1% 2.4% 1.2% 1.0% 18.5% 16.0% 14.1% 2013 2014 2015 Stock-based compensation expense
  • 9. 8,613 7,884 4,006 5,428 12,619 13,312 2014 2015 Owned Optioned Land Portfolio Positioned for Growth  High quality land positions in land- constrained markets  Land portfolio totals approximately 13,300 owned or controlled home sites; up 5.5% from year-end 2014  59% owned / 41% optioned  Approximately 4,000 legacy (subject to fresh start accounting) home sites remain  Experienced team with extensive land entitlement and development experience  Actively pursuing additional land acquisition opportunities throughout Florida 9 Owned or Controlled Home Sites
  • 10. Selected Operating Results 10 $ in thousands, except per share amounts 2015 2014 Variance % 2015 2014 Variance % Homebuilding revenues 134,835$ 121,491$ 10.9% 437,956$ 292,785$ 49.6% Real estate services revenues 23,267 22,734 2.6% 100,138 90,582 10.5% Amenities revenues 6,914 6,379 7.8% 25,522 23,636 8.1% Total revenues 165,016$ 150,604$ 9.6% 563,616$ 407,003$ 38.5% Total gross margin 32,901$ 35,002$ -6.0% 117,284$ 82,541$ 42.2% Net income attributable to common shareholders 9,745$ 12,639$ -23.0% 35,400$ 21,597$ 63.9% Earnings per share - diluted 0.37$ 0.48$ -22.9% 1.34$ 0.82$ 63.4% SG&A expenses as a percent of Homebuilding revenues 12.1% 12.3% -20 bps 14.1% 16.0% -190 bps Adjusted gross margin percentage 27.3% 31.9% -460 bps 28.8% 30.5% -170 bps Adjusted EBITDA 22,032$ 25,600$ -14.1% 73,959$ 49,340$ 50.1% Adjusted EBITDA percentage 13.4% 17.0% -360 bps 13.1% 12.1% +100 bps Homes delivered 299 238 25.6% 938 644 45.7% Average selling price per home delivered 451$ 504$ -10.5% 466$ 452$ 3.1% New orders 222 171 29.8% 1,115 743 50.1% Average selling price per new order 486$ 428$ 13.6% 450$ 474$ -5.1% Backlog units 569 392 45.2% Average selling price in backlog 477$ 524$ -9.0% Three Months Ended December 31, Years Ended December 31,
  • 11. Conservative Balance Sheet  Balance sheet positioned to execute the growth strategy  Invested approximately $94 million in 2015 for land and land development  In 1Q16 - Amended and extended revolving credit facility  Increased to $115 million with accordion up to $200 million  Extended term to Feb-2020  Currently undrawn 11 1) Available liquidity includes the $75 million of borrowing capacity under a then-existing four-year revolving credit facility and $8.4 million of borrowing capacity as of December 31, 2015 under a revolving credit facility with Stonegate Bank. 2) Debt to capital is computed by dividing the carrying value of our total outstanding debt, as reported on our consolidated balance sheets, by total capital as calculated above. 3) Net debt represents the principal amount of our total outstanding debt, less cash and cash equivalents; net capitalization represents net debt plus total equity. $ in t housands Cash and cash equivalents 135,308$ 174,756$ Real estate inventories 554,191 449,249 Total outstanding debt 246,473 245,983 Total equity 473,767 434,443 Total capital 720,240 680,426 Available liquidity (1) 218,665 257,756 Debt to capital (2) 34.2% 36.2% Net debt to net capitalization (3) 19.5% 14.8% (Cash + inventories) / total debt 2.80 2.54 December 31, 2015 (as adjusted) December 31, 2014
  • 12. Key Takeaways  Florida real estate market remains strong  Fully integrated Florida luxury homebuilder and community developer  Focus on move-up, second-home and active adult customer segments  Positioned for continued growth  Complementary Real Estate Services and Amenities businesses  Actively pursuing land acquisition opportunities  Conservative balance sheet with liquidity and flexibility for growth  Experienced and talented team 12
  • 14. 2015 2014 2013 2015 2014 2013 Homebuilding gross margin 33,322$ 36,054$ 19,815$ 115,170$ 82,994$ 64,248$ Less: gross margin fromland and home sites - 437 (6) 353 437 195 Gross margin from homes delivered 33,322 35,617 19,821 114,817 82,557 64,053 Add: capitalized interest in cost of sales 3,478 2,653 1,377 10,903 6,306 4,257 Adjustedgross margin from homes delivered 36,800$ 38,270$ 21,198$ 125,720$ 88,863$ 68,310$ Gross margin fromhomes delivered as a percentage of revenues fromhomes delivered 24.7% 29.7% 28.7% 26.3% 28.3% 30.0% Adjusted gross margin fromhomes delivered as a percentage of revenues fromhomes delivered 27.3% 31.9% 30.7% 28.8% 30.5% 32.0% Years EndedDecember 31, ($ in thousands) Three Months EndedDecember 31, Reconciliation of Non-GAAP Financial Measures In addition to the results reported in accordance with U.S. generally accepted accounting principles (“GAAP”), we have provided information in this presentation relating to adjusted gross margin from homes delivered, EBITDA and Adjusted EBITDA (both such terms are defined below), and net debt to net capitalization. Our GAAP-based measures can be found in our audited consolidated financial statements in Item 8 of Part II of the Annual Report on Form 10-K for the year ended December 31, 2015 that we plan to file with the Securities and Exchange Commission on or before February 24, 2016. The presentation of historical non-GAAP measures herein does not reflect or endorse any forecast of future financial performance. Adjusted Gross Margin from Homes Delivered We calculate adjusted gross margin from homes delivered by subtracting the gross margin from land and home sites, if any, from Homebuilding gross margin to arrive at gross margin from homes delivered. Adjusted gross margin from homes delivered is calculated by adding back asset impairments, if any, and capitalized interest in cost of sales to gross margin from homes delivered. Management uses adjusted gross margin from homes delivered to evaluate operating performance in our Homebuilding segment and make strategic decisions regarding sales price, construction and development pace, product mix and other operating decisions. We believe that adjusted gross margin from homes delivered is (i) meaningful because it eliminates the impact that our indebtedness and asset impairments have on gross margin and (ii) relevant and useful to shareholders, investors and other interested parties for evaluating our comparative operating performance from period to period and among companies within the homebuilding industry as it is reflective of overall profitability during any given reporting period. However, this measure is considered a non-GAAP financial measure and should be considered in addition to, rather than as a substitute for, the comparable GAAP financial measures when evaluating our operating performance. Although other companies in the homebuilding industry report similar information, they may calculate this measure differently than we do and, therefore, it may not be comparable. We urge shareholders, investors and other interested parties to understand the methods used by other companies in the homebuilding industry to calculate gross margins and any adjustments to such amounts before comparing our measures to those of such other companies. The table below reconciles adjusted gross margin from homes delivered to the most directly comparable GAAP financial measure, Homebuilding gross margin, for the periods presented herein. 14
  • 15. Reconciliation of Non-GAAP Financial Measures (continued) EBITDA and Adjusted EBITDA Adjusted EBITDA measures performance by adjusting net income (loss) attributable to common shareholders of WCI Communities, Inc. to exclude, if any, interest expense, capitalized interest in cost of sales, income taxes, depreciation (‘‘EBITDA’’), preferred stock dividends, income (loss) from discontinued operations, other income, stock-based compensation expense, asset impairments and expenses related to early repayment of debt. We believe that the presentation of Adjusted EBITDA provides useful information to shareholders, investors and other interested parties regarding our results of operations because it assists those parties and us when analyzing and benchmarking the performance and value of our business. We also believe that Adjusted EBITDA is useful as a measure of comparative operating performance from period to period and among companies in the homebuilding industry as it is reflective of changes in pricing decisions, cost controls and other factors that affect operating performance, and it eliminates the effects of our capital structure (such as preferred stock dividends and interest expense), asset base (primarily depreciation), items outside of our control (primarily income taxes) and the volatility related to the timing and extent of non-operating activities (such as discontinued operations and asset impairments). Accordingly, we believe that this measure is useful for comparing general operating performance from period to period. Other companies in our industry may define Adjusted EBITDA differently and, as a result, our measure of Adjusted EBITDA may not be directly comparable. Although we use Adjusted EBITDA as a financial measure to assess the performance of our business, the use of Adjusted EBITDA is limited because it does not include certain material costs, such as interest and income taxes, necessary to operate our business. EBITDA and Adjusted EBITDA should be considered in addition to, and not as substitutes for, net income (loss) in accordance with GAAP as a measure of our performance. Our presentation of EBITDA and Adjusted EBITDA should not be construed as an indication that our future results will be unaffected by unusual or nonrecurring items. Our EBITDA-based measures have limitations as analytical tools and, therefore, shareholders, investors and other interested parties should not consider them in isolation or as substitutes for analyses of our results as reported under GAAP. Some such limitations are:  they do not reflect the impact of earnings or charges resulting from matters that we consider not to be indicative of our ongoing operations;  they are not adjusted for all non-cash income or expense items that are reflected in our consolidated statements of cash flows;  they do not reflect the interest that is necessary to service our debt; and  other companies in our industry may calculate these measures differently than we do, thereby limiting their usefulness as comparative measures. Because of these limitations, our EBITDA-based measures are not intended to be alternatives to net income (loss), indicators of our operating performance, alternatives to any other measure of performance under GAAP or alternatives to cash flow provided by (used in) operating activities as measures of liquidity. Shareholders, investors and other interested parties should therefore not place undue reliance on our EBITDA-based measures or ratios calculated using those measures. 15
  • 16. Reconciliation of Non-GAAP Financial Measures (continued) EBITDA and Adjusted EBITDA (continued) The table below reconciles EBITDA and Adjusted EBITDA to the most directly comparable GAAP financial measure, net income (loss) attributable to common shareholders of WCI Communities, Inc., for the periods presented herein. 16 1) Represents capitalized interest expensed in cost of sales on home deliveries and land and home site sales. 2) Represents a reduction in net income attributable to WCI Communities, Inc. pertaining to its preferred stock wherein we (i) exchanged 903,825 shares of our common stock (valued at $19.0 million) for 10,000 outstanding shares of our Series A preferred stock during July 2013 and (ii) paid $0.7 million in cash to purchase the one outstanding share of our Series B preferred stock during April 2013. All such shares of preferred stock, which were carried at a nominal value on our consolidated balance sheets, have been cancelled and retired. In accordance with Accounting Standards Codification 260, Earnings Per Share, paragraph 10-S99-2, any difference between the consideration transferred to our preferred stock shareholders and the corresponding book value has been (i) characterized as a preferred stock dividend in the Company’s consolidated statements of operations during the year that the related transaction was completed and (ii) deducted from net income attributable to WCI Communities, Inc. to arrive at net income attributable to common shareholders of WCI Communities, Inc. 3) Represents the expense recorded in the Company’s consolidated statements of operations related to its stock-based compensation plans. 4) Represents an impairment charge recorded in the Company’s consolidated statements of operations during the year ended December 31, 2014 in connection with the write-down to fair value of one of its Amenities assets. 5) Represents expenses related to early repayment of debt as reported in the Company’s consolidated statements of operations, including write-offs of unamortized debt discount and debt issuance costs and a prepayment premium related to our voluntary prepayment of the entire outstanding principal amount of the Company’s Senior Secured Term Notes due 2017 in August 2013. 2015 2014 2013 2015 2014 2013 Net income attributable to common shareholders of WCI Communities, Inc. 9,745$ 12,639$ 135,198$ 35,400$ 21,597$ 126,968$ Interest expense 190 264 739 848 1,140 2,537 Capitalized interest in cost of sales (1) 3,478 2,653 1,377 10,903 6,306 4,257 Income taxexpense (benefit) 7,035 8,315 (125,624) 20,427 14,652 (125,709) Depreciation 750 717 568 2,984 2,627 2,081 EBITDA 21,198 24,588 12,258 70,562 46,322 10,134 Preferred stock dividends (2) - - - - - 19,680 Other income, net (217) (1,069) (1,393) (810) (1,604) (2,642) Stock-based compensation expense (3) 1,051 881 905 4,207 3,422 5,217 Asset impairment (4) - 1,200 - - 1,200 - Expenses related to early repayment of debt (5) - - - - - 5,105 AdjustedEBITDA 22,032$ 25,600$ 11,770$ 73,959$ 49,340$ 37,494$ Adjusted EBITDA margin 13.4% 17.0% 12.4% 13.1% 12.1% 11.8% Years EndedDecember 31, ($ in thousands) Three Months EndedDecember 31,
  • 17. Reconciliation of Non-GAAP Financial Measures (continued) Net Debt to Net Capitalization We believe that net debt to net capitalization provides useful information to shareholders, investors and other interested parties regarding our financial position and cash and debt management. It is also a relevant financial measure for understanding the leverage employed in our operations and as an indicator of our ability to obtain future financing. However, this measure is considered a non-GAAP financial measure and should be considered in addition to, rather than as a substitute for, the comparable GAAP financial measures when evaluating our leverage. By deducting cash and cash equivalents from our outstanding debt, we provide a measure of our debt that considers our cash position. We believe that this approach provides useful information because the ratio of debt to capital does not consider our cash and cash equivalents and we believe that a debt ratio net of cash, such as net debt to net capitalization, provides supplemental information by which our financial position may be considered. Shareholders, investors and other interested parties may also find this information helpful when comparing our leverage to the leverage of other companies in our industry. Although other companies in the homebuilding industry report similar information, they may calculate this measure differently than we do and, therefore, it may not be comparable. We urge shareholders, investors and other interested parties to understand the methods used by other companies in the homebuilding industry to calculate leverage ratios such as net debt to net capitalization, including any adjustments to such amounts, before comparing our measures to those of such other companies. The table below presents the computations of our net debt to net capitalization and reconciles such amounts to the most directly comparable GAAP financial measure, debt to capital. Certain amounts included in such table have been retroactively adjusted to reflect the adoption of Accounting Standards Update 2015-03, Simplifying the Presentation of Debt Issuance Costs, which is discussed in Note 1 to the audited consolidated financial statements included in Item 8 of Part II of the Annual Report on Form 10-K for the year ended December 31, 2015 that we plan to file with the Securities and Exchange Commission on or before February 24, 2016. 17 1) Debt to capital is computed by dividing the carrying value of our total outstanding debt, as reported on our consolidated balance sheets, by total capital as calculated above. 2) Net debt to net capitalization is computed by dividing net debt by net capitalization. 2015 2014 Total outstanding debt 246,473$ 245,983$ Total equity 473,767 434,443 Total capital 720,240$ 680,426$ Debt to capital (1) 34.2% 36.2% Total outstanding debt 246,473$ 245,983$ Unamortized debt premium (1,031) (1,179) Unamortized debt issuance costs 4,558 5,196 Principal amount of total outstanding debt 250,000 250,000 Less: cash and cash equivalents 135,308 174,756 Net debt 114,692 75,244 Total equity 473,767 434,443 Net capitalization 588,459$ 509,687$ Net debt to net capitalization (2) 19.5% 14.8% December 31, ($ in thousands)