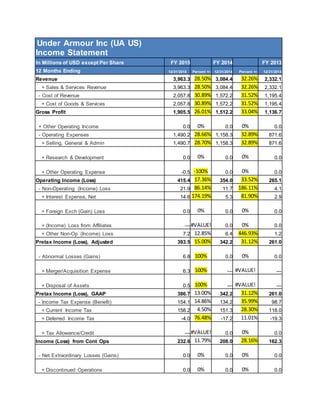
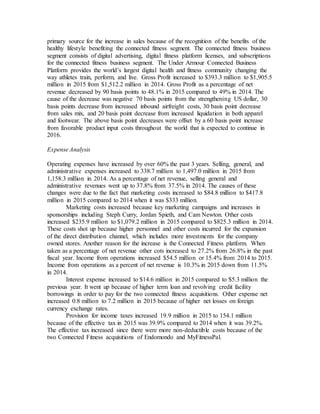
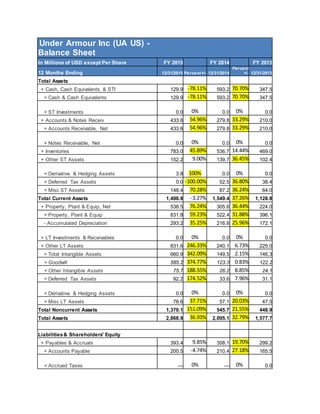
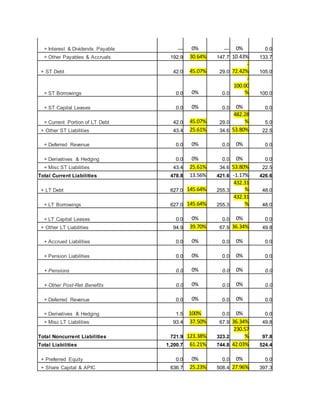
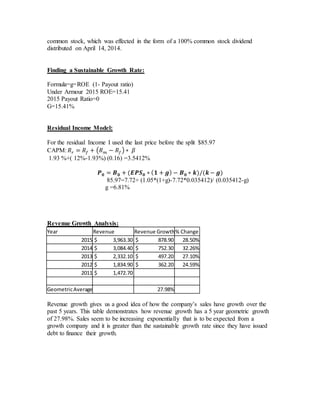
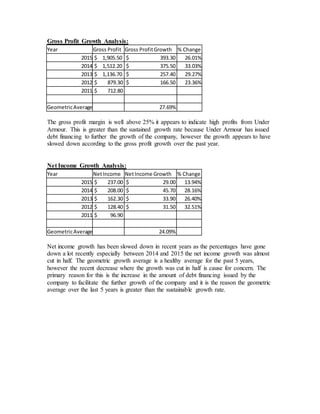
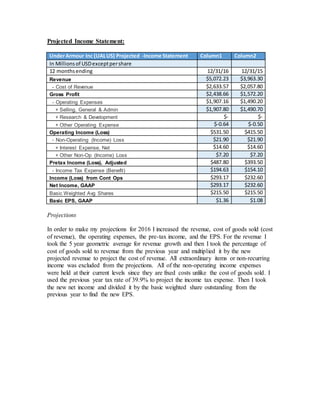
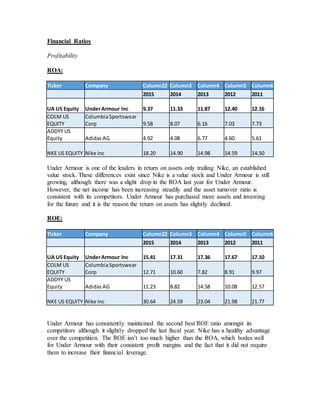
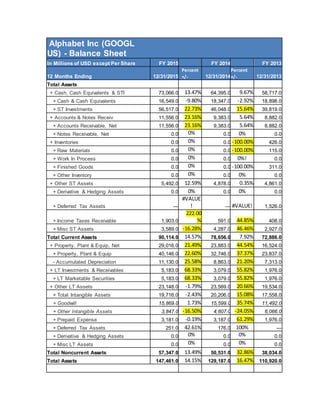
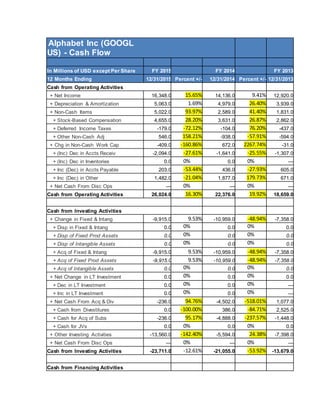
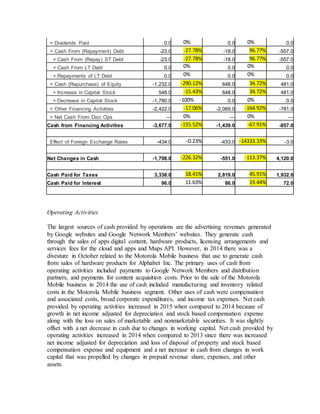
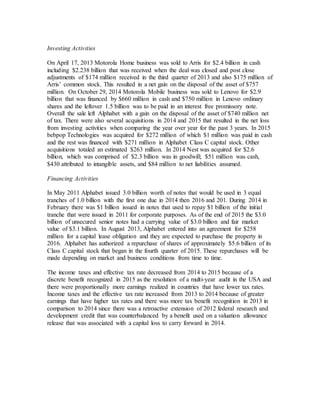
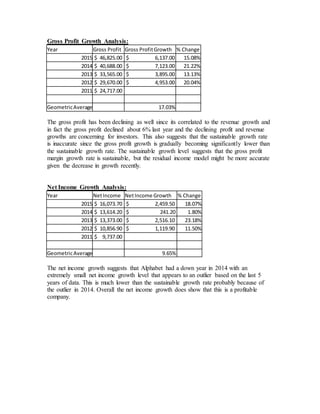
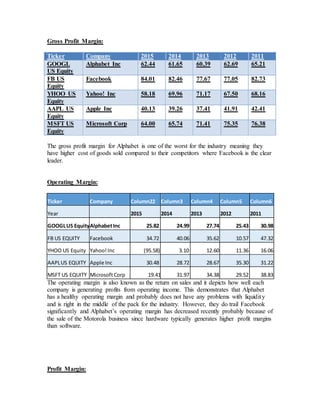
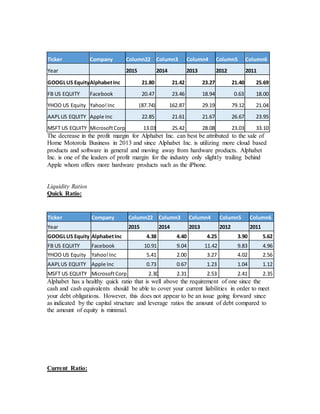
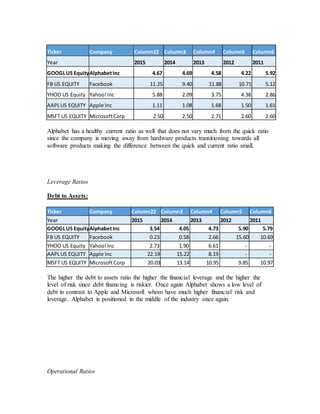
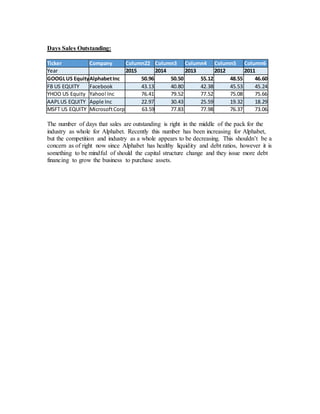
Memorandum
To: Professor John Finnigan
From: Thomas Lake
Date: May 4, 2016
Subject: Investment Analysis
_______________________________________________________________________
Attached please find the investment analysis paper, which is due on as an
assignment in Bus 420 N, Investment Analysis.
The work and writing presented in this assignment unless specifically specified in
appropriately cited footnote, endnote, or reference is solely ours.
Table of Contents:
Part 1:
Investment Style
Part 2:
Under Armour Section
Alphabet Section
Hartford Core Equity A Section
Part 3:
Portfolio Section
Executive Summary:
The project presented in this paper incorporates a fake investment portfolio of $30,000 to
invest in 3 different securities of equal weight starting with $10,000 in each investment
with two of the securities being US common stocks and the other one is a mutual fund.
Over the course of the semester the companies may pay dividends to their investors,
release their quarterly earnings, and release their annual statements if their fiscal year is
December 31st. The closing prices were to be kept track of daily and the short interest for
the week and the investments were to be compared to a benchmark as one way of
measuring your success to comparable returns on appropriate indexes. First and the most
important step before making any type of investment is to take a risk assessment test to
determine how much risk you are comfortable with in your portfolio and investments as a
whole. Then based off this beta the next step was to calculate the required rate of return
using the CAPM formula. The investments that were chosen were supposed to be
comparable to the beta of your portfolio determined from the risk assessment test.
Additionally, the projected return on the investment based on the 1 year target price had
to be greater than the required rate of return in order for the investment to make any sense
at all. The financial statements were to be thoroughly analyzed and the investment values
were to be tracked throughout the semester and compared to a benchmark.
Over the course I learned how useful the notes to the financial statements are to
determine all the changes from year to year. One major important thing that is clearly
evident of this project is that past performance does not guarantee future success
especially with choosing an individual stock security. The company specific risk is
evident with the release of earnings as it had a dramatic impact on the price of one of my
securities. I was able to observe firsthand how different betas affect the volatility of a
security differently. It is completely irrational and unnecessarily risky to invest in
securities without doing any research and as you start to piece together the analysis you
begin to notice some common trends across all of the analysis. The financials of Under
Armour appeared stronger with more room for growth than Alphabet and was further
demonstrated by the release of the earnings report for the first quarter of 2016 on April
21st. Also, it is quite evident that picking a mutual fund or even something similar such as
an ETF is much easier than selecting an individual stock that is extremely vulnerable to
company specific risk such as stopping the production of a certain product could hurt
earnings and the intrinsic value of the security. However, the diversification is a way to
eliminate the systemic risk if the mutual fund is properly diversified. Diversification is
important for all portfolios and it does not matter how old you are or how much money
you have to invest. An investor should never put all of their eggs in one basket. It is ok
for something in your portfolio to underperform or even suffer losses as long as the loss
is mitigated by the gains on your investments. The most important indicator of
diversification is the correlation between securities since they should never move exactly
the same. Discipline is extremely important since depending on the volatility of the stock
there is no reason to overreact to fluctuations and lock yourself in a loss as long as the
security is fundamentally sound based on your analysis.
Investment Style
I intend to accomplish a well-diversified portfolio that helps me accomplish my
financial goals. My attitude towards risk is to invest in the amount of risk I am
comfortable taking on with the potential for long-term growth by having my investment
strategy be to invest in mid cap and large cap growth stocks that fit my beta of 0.8.
Although the temporary fluctuations may not be favorable it is important to not overreact
and liquidate my shares based on a bad performance day or week. A growth investing
style that I want to pursue favoring stocks of companies that are producing above average
earnings and profits. That is why my investing style that favors capital gains instead of
dividends to reinvest their earnings into the business including capital projects or research
and development.
My required return based on the portfolio beta is 9.986% based on my
calculations with the risk free rate of the 10 year T-bill being 1.93%, and an estimate
return on the large stocks is typically 12%. My beta was calculated by determined based
on my risk assessment score to be 0.8. This was slightly below my beta calculated based
on the risk assessment test and given it is the first I will be investing I am comfortable
with that beta. This was my calculations for the require rate of return on my portfolio
based on my beta and My selections reflect my attitude towards risk and the required
return that I have already discussed by investing in a mid-cap, and large cap stocks that
do not pay out dividends.
Calculated as: CAPM: 𝑅 𝑟 = 𝑅𝑓 + (𝑅 𝑚 − 𝑅𝑓)𝛽
1.93%+0.8(12%-1.93%) =9.986%.
Investment Choice
I have chosen to invest in Under Armour (UA), Alphabet Inc. (GOOGL), and
Hartford Core Equity A (HAIAX) to complete my investment portfolio.
Under Armour, Inc.
Security Name: Under Armour, Inc.
Ticker: UA
Exchange: NYSE
Closing Price as of 1/29: $85.43
Quantity purchased on 1/29: 117.0548987 shares
Value of Investment on 1/29: $10,000
Closing Price as of 4/29: $43.94
2 for 1 stock split: 117.0548987 shares*2= 234.0823970037
Current Value of Investment as of 4/29: 10285.58(2.86% return)
Annual Return: 11.42%
Security Profile-
Under Armour, Inc., together with its subsidiaries, develops, markets, and distributes
branded performance apparel, footwear, and accessories for men, women, and youth
primarily in North America, Europe, the Middle East, Africa, the Asia-Pacific, and Latin
America. The company offers its apparel in compression, fitted, and loose types to be
worn in hot, cold, and in between the extremes. It offers various footwear products,
including football, baseball, lacrosse, softball and soccer cleats, slides, and performance
training, running, basketball, and outdoors footwear. The company also provides
accessories, which include headwear, bags, and gloves.
Financial Year End: Dec 31
Beta: 0.16
Sector: Consumer Goods
Industry: Textile Apparel Clothing
Position in the Industry: Leader
Reasonfor Selection:
Under Armour offers the diversification of the retail market instead of solely focusing my
stock investments on the technology sector. They also fit my portfolio as a growth mid
cap security.
Expected Return:
Expected Return= (Price^1-T-Price^T)/Price^T
($100.23-$85.43)/$85.43=17.3241250146%
The one-year target estimate for Under Armour is $100.23. This gives me an annual
return of 17.3241%.
Ratios:
The ratios that are most important are the quick ratio, debt to equity, revenue growth, the
EBIT margin %, return on assets, return on invested capital, return on equity, average day
sales outstanding, average days inventory outstanding, average days payable outstanding,
average cash conversion cycle, and inventory turnover. These ratios are important
because the retail industry is heavily reliant upon sales and inventory turnover.
Benchmark:
The S&P 500 would be the correct benchmark for Under Armour to compare its
performance against for a couple of simple reasons. These reasons are Under Armour is
incorporated into the S&P 500 and its competitors in the textile apparel industry are
included in it as well.
Under Armour Inc (UA US)
Income Statement
In Millions of USD except Per Share FY 2015 FY 2014 FY 2013
12 Months Ending 12/31/2015 Percent +/- 12/31/2014 Percent +/- 12/31/2013
Revenue 3,963.3 28.50% 3,084.4 32.26% 2,332.1
+ Sales & Services Revenue 3,963.3 28.50% 3,084.4 32.26% 2,332.1
- Cost of Revenue 2,057.8 30.89% 1,572.2 31.52% 1,195.4
+ Cost of Goods & Services 2,057.8 30.89% 1,572.2 31.52% 1,195.4
Gross Profit 1,905.5 26.01% 1,512.2 33.04% 1,136.7
+ Other Operating Income 0.0 0% 0.0 0% 0.0
- Operating Expenses 1,490.2 28.66% 1,158.3 32.89% 871.6
+ Selling, General & Admin 1,490.7 28.70% 1,158.3 32.89% 871.6
+ Research & Development 0.0 0% 0.0 0% 0.0
+ Other Operating Expense -0.5 -100% 0.0 0% 0.0
Operating Income (Loss) 415.4 17.36% 354.0 33.52% 265.1
- Non-Operating (Income) Loss 21.9 86.14% 11.7 186.11% 4.1
+ Interest Expense, Net 14.6 174.19% 5.3 81.90% 2.9
+ Foreign Exch (Gain) Loss 0.0 0% 0.0 0% 0.0
+ (Income) Loss from Affiliates — #VALUE! 0.0 0% 0.0
+ Other Non-Op (Income) Loss 7.2 12.85% 6.4 446.93% 1.2
Pretax Income (Loss), Adjusted 393.5 15.00% 342.2 31.12% 261.0
- Abnormal Losses (Gains) 6.8 100% 0.0 0% 0.0
+ Merger/Acquisition Expense 6.3 100% — #VALUE! —
+ Disposal of Assets 0.5 100% — #VALUE! —
Pretax Income (Loss), GAAP 386.7 13.00% 342.2 31.12% 261.0
- Income Tax Expense (Benefit) 154.1 14.86% 134.2 35.99% 98.7
+ Current Income Tax 158.2 4.50% 151.3 28.30% 118.0
+ Deferred Income Tax -4.0 76.48% -17.2 11.01% -19.3
+ Tax Allowance/Credit — #VALUE! 0.0 0% 0.0
Income (Loss) from Cont Ops 232.6 11.79% 208.0 28.16% 162.3
- Net Extraordinary Losses (Gains) 0.0 0% 0.0 0% 0.0
+ Discontinued Operations 0.0 0% 0.0 0% 0.0
+ XO & Accounting Changes 0.0 0% 0.0 0% 0.0
Income (Loss) Incl. MI 232.6 11.79% 208.0 28.16% 162.3
- Minority Interest 0.0 0% 0.0 0% 0.0
Net Income, GAAP 232.6 11.79% 208.0 28.16% 162.3
- Preferred Dividends 0.0 0% 0.0 0% 0.0
- Other Adjustments 0.0 0% 0.0 0% 0.0
Net Income Avail to Common, GAAP 232.6 11.79% 208.0 28.16% 162.3
Net Income Avail to Common, Adj 237.0 13.93% 208.0 28.16% 162.3
Net Abnormal Losses (Gains) 4.5 100% 0.0 0% 0.0
Net Extraordinary Losses (Gains) 0.0 0% 0.0 0% 0.0
Basic Weighted Avg Shares 215.5 1.07% 213.2 1.20% 210.7
Basic EPS, GAAP 1.08 10.20% 0.98 27.27% 0.77
Basic EPS from Cont Ops 1.08 10.20% 0.98 27.27% 0.77
Basic EPS from Cont Ops, Adjusted 1.10 12.23% 0.98 27.27% 0.77
Diluted Weighted Avg Shares 220.9 0.68% 219.4 1.58% 216.0
Diluted EPS, GAAP 1.05 10.53% 0.95 26.67% 0.75
Diluted EPS from Cont Ops 1.05 10.53% 0.95 26.67% 0.75
Diluted EPS from Cont Ops, Adjusted 1.07 12.65% 0.95 26.67% 0.75
Income Analysis:
Revenue Analysis
The income statement begins with revenue and it is clear that revenue has increased over
50% over the last 3 years. The increase in net sales was driven primarily by apparel unit
sales growth and new offerings in multiple lines led by training, golf; and footwear
growth unit sales growth, led by running and basketball and the expansion of footwear
offerings globally. License revenue increased from $67.2 million in 2014 to $84.2 million
in 2015 a 25% increase. This increase was primarily driven by increased distribution on
officially licensed products in North America and Japan. Connected Fitness revenue
increased $34.2 million or 177.8% to $53.4 million in 2015 from $19.2 million in 2014
primarily driven by the acquisitions for the connected fitness business in the first quarter
2015 and overall revenue growth in the connected fitness business segment. This was the
primary source for the increase in sales because of the recognition of the benefits of the
healthy lifestyle benefiting the connected fitness segment. The connected fitness business
segment consists of digital advertising, digital fitness platform licenses, and subscriptions
for the connected fitness business segment. The Under Armour Connected Business
Platform provides the world’s largest digital health and fitness community changing the
way athletes train, perform, and live. Gross Profit increased to $393.3 million to $1,905.5
million in 2015 from $1,512.2 million in 2014. Gross Profit as a percentage of net
revenue decreased by 90 basis points to 48.1% in 2015 compared to 49% in 2014. The
cause of the decrease was negative 70 basis points from the strengthening US dollar, 30
basis points decrease from increased inbound airfreight costs, 30 basis point decrease
from sales mix, and 20 basis point decrease from increased liquidation in both apparel
and footwear. The above basis point decreases were offset by a 60 basis point increase
from favorable product input costs throughout the world that is expected to continue in
2016.
Expense Analysis
Operating expenses have increased by over 60% the past 3 years. Selling, general, and
administrative expenses increased to 338.7 million to 1,497.0 million in 2015 from
1,158.3 million in 2014. As a percentage of net revenue, selling general and
administrative revenues went up to 37.8% from 37.5% in 2014. The causes of these
changes were due to the fact that marketing costs increased to $84.8 million to $417.8
million in 2015 compared to 2014 when it was $333 million.
Marketing costs increased because key marketing campaigns and increases in
sponsorships including Steph Curry, Jordan Spieth, and Cam Newton. Other costs
increased $235.9 million to $1,079.2 million in 2015 compared to $825.3 million in 2014.
These costs shot up because higher personnel and other costs incurred for the expansion
of the direct distribution channel, which includes more investments for the company
owned stores. Another reason for the increase is the Connected Fitness platform. When
taken as a percentage of net revenue other cots increased to 27.2% from 26.8% in the past
fiscal year. Income from operations increased $54.5 million or 15.4% from 2014 to 2015.
Income from operations as a percent of net revenue is 10.3% in 2015 down from 11.5%
in 2014.
Interest expense increased to $14.6 million in 2015 compared to $5.3 million the
previous year. It went up because of higher term loan and revolving credit facility
borrowings in order to pay for the two connected fitness acquisitions. Other expense net
increased 0.8 million to 7.2 million in 2015 because of higher net losses on foreign
currency exchange rates.
Provision for income taxes increased 19.9 million in 2015 to 154.1 million
because of the effective tax in 2015 was 39.9% compared to 2014 when it was 39.2%.
The effective tax increased since there were more non-deductible costs because of the
two Connected Fitness acquisitions of Endomondo and MyFitnessPal.
Under Armour Inc (UA US) -
Balance Sheet
In Millions of USD except Per Share FY 2015 FY 2014 FY 2013
12 Months Ending 12/31/2015 Percent+/- 12/31/2014
Percent
+/- 12/31/2013
Total Assets
+ Cash, Cash Equivalents & STI 129.9 -78.11% 593.2 70.70% 347.5
+ Cash & Cash Equivalents 129.9 -78.11% 593.2 70.70% 347.5
+ ST Investments 0.0 0% 0.0 0% 0.0
+ Accounts & Notes Receiv 433.6 54.96% 279.8 33.29% 210.0
+ Accounts Receivable, Net 433.6 54.96% 279.8 33.29% 210.0
+ Notes Receivable, Net 0.0 0% 0.0 0% 0.0
+ Inventories 783.0 45.89% 536.7 14.44% 469.0
+ Other ST Assets 152.2 9.00% 139.7 36.45% 102.4
+ Derivative & Hedging Assets 3.8 100% 0.0 0% 0.0
+ Deferred Tax Assets 0.0 -100.00% 52.5 36.80% 38.4
+ Misc ST Assets 148.4 70.28% 87.2 36.24% 64.0
Total Current Assets 1,498.8 -3.27% 1,549.4 37.26% 1,128.8
+ Property, Plant & Equip, Net 538.5 76.24% 305.6 36.44% 224.0
+ Property, Plant & Equip 831.8 59.23% 522.4 31.88% 396.1
- Accumulated Depreciation 293.2 35.25% 216.8 25.96% 172.1
+ LT Investments & Receivables 0.0 0% 0.0 0% 0.0
+ Other LT Assets 831.6 246.33% 240.1 6.73% 225.0
+ Total Intangible Assets 660.9 342.09% 149.5 2.15% 146.3
+ Goodwill 585.2 374.77% 123.3 0.83% 122.2
+ Other Intangible Assets 75.7 188.55% 26.2 8.85% 24.1
+ Deferred Tax Assets 92.2 174.52% 33.6 7.96% 31.1
+ Derivative & Hedging Assets 0.0 0% 0.0 0% 0.0
+ Misc LT Assets 78.6 37.71% 57.1 20.03% 47.5
Total Noncurrent Assets 1,370.1 151.09% 545.7 21.55% 448.9
Total Assets 2,868.9 36.93% 2,095.1 32.79% 1,577.7
Liabilities& Shareholders' Equity
+ Payables & Accruals 393.4 9.85% 358.1 19.70% 299.2
+ Accounts Payable 200.5 -4.74% 210.4 27.18% 165.5
+ Accrued Taxes — 0% — 0% 0.0
+ Interest & Dividends Payable — 0% — 0% 0.0
+ Other Payables & Accruals 192.9 30.64% 147.7 10.43% 133.7
+ ST Debt 42.0 45.07% 29.0
-
72.42% 105.0
+ ST Borrowings 0.0 0% 0.0
-
100.00
% 100.0
+ ST Capital Leases 0.0 0% 0.0 0% 0.0
+ Current Portion of LT Debt 42.0 45.07% 29.0
482.28
% 5.0
+ Other ST Liabilities 43.4 25.61% 34.6 53.80% 22.5
+ Deferred Revenue 0.0 0% 0.0 0% 0.0
+ Derivatives & Hedging 0.0 0% 0.0 0% 0.0
+ Misc ST Liabilities 43.4 25.61% 34.6 53.80% 22.5
Total Current Liabilities 478.8 13.56% 421.6 -1.17% 426.6
+ LT Debt 627.0 145.64% 255.3
432.31
% 48.0
+ LT Borrowings 627.0 145.64% 255.3
432.31
% 48.0
+ LT Capital Leases 0.0 0% 0.0 0% 0.0
+ Other LT Liabilities 94.9 39.70% 67.9 36.34% 49.8
+ Accrued Liabilities 0.0 0% 0.0 0% 0.0
+ Pension Liabilities 0.0 0% 0.0 0% 0.0
+ Pensions 0.0 0% 0.0 0% 0.0
+ Other Post-Ret Benefits 0.0 0% 0.0 0% 0.0
+ Deferred Revenue 0.0 0% 0.0 0% 0.0
+ Derivatives & Hedging 1.5 100% 0.0 0% 0.0
+ Misc LT Liabilities 93.4 37.50% 67.9 36.34% 49.8
Total Noncurrent Liabilities 721.9 123.38% 323.2
230.57
% 97.8
Total Liabilities 1,200.7 61.21% 744.8 42.03% 524.4
+ Preferred Equity 0.0 0% 0.0 0% 0.0
+ Share Capital & APIC 636.7 25.23% 508.4 27.96% 397.3
+ Common Stock 0.1 1.41% 0.1
102.86
% 0.0
+ Additional Paid in Capital 636.6 25.23% 508.4 27.96% 397.3
- Treasury Stock 0.0 0% 0.0 0% 0.0
+ Retained Earnings 1,076.5 25.66% 856.7 31.02% 653.8
+ Other Equity -45.0 -203.98% -14.8
-
774.93
% 2.2
Equity Before Minority Interest 1,668.2 23.54% 1,350.3 28.19% 1,053.4
+ Minority Interest 0.0 0% 0.0 0% 0.0
Total Equity 1,668.2 23.54% 1,350.3 28.19% 1,053.4
Total Liabilities& Equity 2,868.9 36.93% 2,095.1 32.79% 1,577.7
Balance Sheet Analysis:
Current Assets:
Cash and cash equivalents went down significantly by 78.11% because of the acquisition
to acquire Endomondo and MyFitnessPal in the first quarter of 2015. Accounts receivable
had an increase of 90.8 million in 2015 when in comparison to 2014 because of shipping
time. In 2014 Accounts receivable increased $65.1 million in 2014 as compared to 2013,
because there was a higher proportion of sales to international customers with lengthier
payment terms compared to the 2013.
Long Term Assets:
Net Property Plant, and Equipment increased 76.24% in 2015 and 36.44% in 2014
because of the expansion of their offices in Baltimore. Other long-term assets increased
in 2015 in part due to goodwill increasing by 374.77% resulting from the acquisition of
Endomondo and MyFitnessPal during 2015. Goodwill is associated with the acquisition
of a company as well as the intangible assets, which is the primary reason why they went
up significantly in 2015 when compared to 2014.
Current Liabilities:
In March 2015 a term loan of $150 million was issued. In January of 2016, another term
loan was issued of $138.8 million in order to repay the term loan from 2015 decreasing
short-term debt obligations and short-term debt.
Long Term Liabilities:
In May 2014, Under Armour entered into a long-term $650 million credit agreement for
both revolving credit facility borrowings and term loan borrowings with a term of 5 years
ending in May 2019. In March 2015 there was an amendment to the original agreement
where there was an additional $150 million of term loan borrowings that made a total
aggregate loan borrowings of $350 million and increased the credit facility agreements
from $650 million to $800 million. At the end of the physical year of 2015 Under
Armour had $275 million of revolving borrowings and $525 million remaining
availability.
Equity:
On March 17, 2014, the Board of Directors declared a two-for-one stock split of the
Company's Class A and Class B common stock, which was effected in the form of a
100% common stock dividend distributed on April 14, 2014. Stockholders' equity and all
references to share and per share amounts in the accompanying consolidated financial
statements have been retroactively adjusted to reflect the two-for-one stock split for all
periods presented. On January 5, 2015, the Company acquired 100% of the outstanding
equity of Endomondo ApS (“Endomondo”), a Denmark-based digital connected fitness
company. On March 17, 2015, the Company acquired 100% of the outstanding equity of
MyFitnessPal, Inc. (“MFP”), a digital nutrition and connected Fitness Company. Both
companies were acquired to expand the Under Armour Connected Fitness community.
The purchase price allocation for each acquisition is reflected in the consolidated balance
sheet as of December 31, 2015.
Under Armour Inc (UA US) -
Statement of Cash Flows
In Millions of USD except Per Share FY 2015 FY 2014 FY 2013
12 Months Ending 12/31/2015 Percent+/- 12/31/2014 Percent+/- 12/31/2013
Cash from Operating Activities
+ Net Income 232.6 11.79% 208.0 28.16% 162.3
+ Depreciation & Amortization 100.9 40.01% 72.1 42.62% 50.5
+ Non-Cash Items 130.2 70.09% 76.6 88.92% 40.5
+ Stock-Based Compensation 60.4 18.82% 50.8 17.66% 43.2
+ Deferred Income Taxes -4.4 74.83% -17.6 6.63% -18.8
+ Other Non-Cash Adj 74.3 71.39% 43.4 167.89% 16.2
+ Chg in Non-Cash Work Cap -507.9 -268.87% -137.7 -3.25% -133.3
+ (Inc) Dec in Accts Receiv -191.9 -89.87% -101.1 -181.03% -36.0
+ (Inc) Dec in Inventories -278.5 -229.00% -84.7 46.04% -156.9
+ Inc (Dec) in Accts Payable -22.6 -145.96% 49.1 235.59% 14.6
+ Inc (Dec) in Other -14.9
-
1250.54
% -1.1 -102.46% 44.9
+ Net Cash From Disc Ops 0.0 0% 0.0 0% 0.0
Cash from Operating Activities -44.1 -120.14% 219.0 82.42% 120.1
Cash from Investing Activities
+ Change in Fixed & Intang -298.9 -112.72% -140.5 -60.00% -87.8
+ Disp in Fixed & Intang 0.0 0% 0.0 0% 0.0
+ Disp of Fixed Prod Assets 0.0 0% — 0% —
+ Disp of Intangible Assets 0.0 0% 0.0 0% 0.0
+ Acq of Fixed & Intang -298.9 -112.72% -140.5 -60.00% -87.8
+ Acq of Fixed Prod Assets -298.9 -112.72% -140.5 -60.00% -87.8
+ Acq of Intangible Assets 0.0 0% 0.0 0% 0.0
+ Net Change in LT Investment 0.0 0% 0.0 0% 0.0
+ Dec in LT Investment 0.0 0% 0.0 0% 0.0
+ Inc in LT Investment 0.0 0% 0.0 0% 0.0
+ Net Cash From Acq & Div -539.5
-
4838.30
% -10.9 92.62% -148.1
+ Cash from Divestitures 0.0 0% 0.0 0% 0.0
+ Cash for Acq of Subs -539.5
-
4838.30
% -10.9 92.62% -148.1
+ Cash for JVs 0.0 0% 0.0 0% 0.0
+ Other Investing Activities -9.1 -956.63% -0.9 60.46% -2.2
+ Net Cash From Disc Ops 0.0 0% 0.0 0% 0.0
Cash from Investing Activities -847.5 -456.41% -152.3 36.03% -238.1
Cash from Financing Activities
+ Dividends Paid 0.0 0% 0.0 0% 0.0
+ Cash From (Repayment) Debt 384.8 193.12% 131.3 38.88% 94.5
+ Cash From (Repay) ST Debt 0.0 100.00% -100.0 -200.00% 100.0
+ Cash From LT Debt 650.0 160.00% 250.0 100% —
+ Repayments of LT Debt -265.2
-
1316.53
% -18.7 -242.20% -5.5
+ Cash (Repurchase) of Equity 56.2 6.61% 52.7 63.46% 32.3
+ Increase in Capital Stock 56.2 6.61% 52.7 63.46% 32.3
+ Decrease in Capital Stock 0.0 0% 0.0 0% 0.0
+ Other Financing Activities -0.9 44.72% -1.7
-
100% 0.0
+ Net Cash From Disc Ops 0.0 0% 0.0 0% 0.0
Cash from Financing Activities 440.1 141.40% 182.3 43.78% 126.8
Effect of Foreign Exchange Rates -11.8 -253.85% -3.3 -7.26% -3.1
Net Changes in Cash -463.3 -288.58% 245.7
4249.96
% 5.6
Cash Paid for Taxes 99.7 -3.46% 103.3 20.70% 85.6
Cash Paid for Interest 11.2 169.56% 4.1 175.48% 1.5
Cash Flow Analysis:
Operating Activities:
Cash flows from operations decreased to $263.1 million to $44.1 million in 2015 from
$219 million provided by operations in 2014. The decrease in cash from operating
activities was driven by a decrease in cash flows from operating assets of $370.1 million
and it was offset by adjustments to non-cash items which increased 82.5 million as well
as an increase in net income of 24.5 million from the previous year. These were caused
by an increase in inventory investments of $193 million because of early deliveries of
products to ensure they met seasonal floor set dates and it also included the automated
inventory replenishment system as well. There was also a large increase in accounts
receivable of 90.8 million because of the shipping time. Adjustments to net income for
non-cash items increased in 2015 since there were higher depreciation and amortization
expenses. During 2014 cash from operating activities increased to $98.9 million. It went
up because adjustments to net income of non-cash items increased 57.5 million and
increase of net income of 45.7 million was offset by a decrease in cash flows from
operating assets and liabilities of $4.3 million. In 2014 there was a decrease in inventory
investments of $72.2 million since there was early deliveries of products for seasonality
purposes and incremental inventory investments in 2013.
Investing Activities:
Cash from investing activities increased $695.2 million in 2015 to $847.5 million because
of the acquisitions of MyFitnessPal and Endomondo during the first quarter of 2015 and
capital expenditures to improve corporate headquarters and invest in the new SAP
platform. Cash used in investing activities decreased $85.8 million to $152.3 million in
2014. The decrease was caused by the acquisition of MapMyFitness in the prior year and
was somewhat offset by increased capital expenditures expansion of corporate
headquarters, SAP platform and retail store build outs.
Financing Activities:
Cash provided from financing activities increased $257.8 million to $440.1 million in
2015 from $182.3 million in 2014. It increased because of the amended credit agreement
providing $650 million in term loans and revolving credit facility proceeds in 2015
counterbalanced by payments of $261.3 million. Financing activities in 2014 increased
$55.5 million to $182.3 million because of $150 million in net borrowings under the new
credit facility in 2014, however when it was compared to 2013 there was $100 million of
borrowings under the revolving credit facility. On March 17, 2014, the Board of
Directors declared a two-for-one stock split of the Company's Class A and Class B
common stock, which was effected in the form of a 100% common stock dividend
distributed on April 14, 2014.
Finding a Sustainable Growth Rate:
Formula=g=ROE (1- Payout ratio)
Under Armour 2015 ROE=15.41
2015 Payout Ratio=0
G=15.41%
Residual Income Model:
For the residual Income I used the last price before the split $85.97
CAPM: 𝑅 𝑟 = 𝑅𝑓 + (𝑅 𝑚 − 𝑅𝑓) ∗ 𝛽
1.93 %+( 12%-1.93%) (0.16) =3.5412%
𝑷 𝟎 = 𝑩 𝟎 + (𝑬𝑷𝑺 𝟎 ∗ ( 𝟏 + 𝒈) − 𝑩 𝟎 ∗ 𝒌)/(𝒌− 𝒈)
85.97=7.72+ (1.05*(1+g)-7.72*0.035412)/ (0.035412-g)
g =6.81%
Revenue Growth Analysis:
Year Revenue Revenue Growth% Change
2015 $ 3,963.30 $ 878.90 28.50%
2014 $ 3,084.40 $ 752.30 32.26%
2013 $ 2,332.10 $ 497.20 27.10%
2012 $ 1,834.90 $ 362.20 24.59%
2011 $ 1,472.70
GeometricAverage 27.98%
Revenue growth gives us a good idea of how the company’s sales have growth over the
past 5 years. This table demonstrates how revenue growth has a 5 year geometric growth
of 27.98%. Sales seem to be increasing exponentially that is to be expected from a
growth company and it is greater than the sustainable growth rate since they have issued
debt to finance their growth.
Gross Profit Growth Analysis:
Year Gross Profit Gross ProfitGrowth % Change
2015 $ 1,905.50 $ 393.30 26.01%
2014 $ 1,512.20 $ 375.50 33.03%
2013 $ 1,136.70 $ 257.40 29.27%
2012 $ 879.30 $ 166.50 23.36%
2011 $ 712.80
GeometricAverage 27.69%
The gross profit margin is well above 25% it appears to indicate high profits from Under
Armour. This is greater than the sustained growth rate because Under Armour has issued
debt financing to further the growth of the company, however the growth appears to have
slowed down according to the gross profit growth over the past year.
Net Income Growth Analysis:
Year NetIncome NetIncome Growth % Change
2015 $ 237.00 $ 29.00 13.94%
2014 $ 208.00 $ 45.70 28.16%
2013 $ 162.30 $ 33.90 26.40%
2012 $ 128.40 $ 31.50 32.51%
2011 $ 96.90
GeometricAverage 24.09%
Net income growth has been slowed down in recent years as the percentages have gone
down a lot recently especially between 2014 and 2015 the net income growth was almost
cut in half. The geometric growth average is a healthy average for the past 5 years,
however the recent decrease where the growth was cut in half is cause for concern. The
primary reason for this is the increase in the amount of debt financing issued by the
company to facilitate the further growth of the company and it is the reason the geometric
average over the last 5 years is greater than the sustainable growth rate.
Projected Income Statement:
UnderArmour Inc (UALUS) Projected -Income Statement Column1 Column2
In Millionsof USDexceptpershare
12 monthsending 12/31/16 12/31/15
Revenue $5,072.23 $3,963.30
- Cost of Revenue $2,633.57 $2,057.80
Gross Profit $2,438.66 $1,572.20
- Operating Expenses $1,907.16 $1,490.20
+ Selling, General & Admin $1,907.80 $1,490.70
+ Research & Development $- $-
+ Other Operating Expense $-0.64 $-0.50
Operating Income (Loss) $531.50 $415.50
- Non-Operating (Income) Loss $21.90 $21.90
+ Interest Expense, Net $14.60 $14.60
+ Other Non-Op (Income) Loss $7.20 $7.20
Pretax Income (Loss), Adjusted $487.80 $393.50
- Income Tax Expense (Benefit) $194.63 $154.10
Income (Loss) from Cont Ops $293.17 $232.60
Net Income, GAAP $293.17 $232.60
Basic Weighted Avg Shares $215.50 $215.50
Basic EPS, GAAP $1.36 $1.08
Projections
In order to make my projections for 2016 I increased the revenue, cost of goods sold (cost
of revenue), the operating expenses, the pre-tax income, and the EPS. For the revenue I
took the 5 year geometric average for revenue growth and then I took the percentage of
cost of goods sold to revenue from the previous year and multiplied it by the new
projected revenue to project the cost of revenue. All extraordinary items or non-recurring
income was excluded from the projections. All of the non-operating income expenses
were held at their current levels since they are fixed costs unlike the cost of goods sold. I
used the previous year tax rate of 39.9% to project the income tax expense. Then I took
the new net income and divided it by the basic weighted share outstanding from the
previous year to find the new EPS.
Financial Ratios
Profitability
ROA:
Ticker Company Column22 Column3 Column4 Column5 Column6
2015 2014 2013 2012 2011
UA US Equity UnderArmour Inc 9.37 11.33 11.87 12.40 12.16
COLM US
EQUITY
ColumbiaSportswear
Corp 9.58 8.07 6.16 7.03 7.73
ADDYY US
Equity Adidas AG 4.92 4.08 6.77 4.60 5.61
NKE US EQUITY Nike Inc 18.20 14.90 14.98 14.59 14.50
Under Armour is one of the leaders in return on assets only trailing Nike, an established
value stock. These differences exist since Nike is a value stock and Under Armour is still
growing, although there was a slight drop in the ROA last year for Under Armour.
However, the net income has been increasing steadily and the asset turnover ratio is
consistent with its competitors. Under Armour has purchased more assets and investing
for the future and it is the reason the return on assets has slightly declined.
ROE:
Ticker Company Column22 Column3 Column4 Column5 Column6
2015 2014 2013 2012 2011
UA US Equity UnderArmour Inc 15.41 17.31 17.36 17.67 17.10
COLM US
EQUITY
ColumbiaSportswear
Corp 12.71 10.60 7.82 8.91 9.97
ADDYY US
Equity Adidas AG 11.23 8.82 14.58 10.08 12.57
NKE US EQUITY Nike Inc 30.64 24.59 23.04 21.98 21.77
Under Armour has consistently maintained the second best ROE ratio amongst its
competitors although it slightly dropped the last fiscal year. Nike has a healthy advantage
over the competition. The ROE isn’t too much higher than the ROA, which bodes well
for Under Armour with their consistent profit margins and the fact that it did not require
them to increase their financial leverage.
ROIC:
Ticker Company Column22 Column3 Column4 Column5 Column6
2015 2014 2013 2012 2011
UA US Equity UnderArmour Inc 12.61 15.11 15.77 16.55 16.39
COLM US
EQUITY
ColumbiaSportswear
Corp 13.24 10.82 7.78 8.97 9.90
ADDYY US
Equity Adidas AG 9.46 8.38 12.25 8.68 10.53
NKE US EQUITY Nike Inc 25.86 22.46 21.21 21.94 20.35
Return on invested capital is the ability of the company to take the money they raise
through investors and the return the investors receive on their capital. Nike is once again
dominant in the industry for return on invested capital since a lot of their supply chain is
outsourced from overseas manufacturing all the way up to distribution. It is concerning as
an investor in Under Armour that their return on invested capital has steadily declined
over the past 5 years with a significant drop in the last fiscal year. This is the opposite of
the trend of the industry, which is concerning given the industry trend. The reason for this
is Under Armour has opted for more debt financing recently giving them higher fixed
costs unlike the competitors who are using less debt financing.
Debt to Equity:
Ticker Company Column22 Column3 Column4 Column5 Column6
2015 2014 2013 2012 2011
UA US Equity UnderArmour Inc 40.10 21.05 14.52 7.58 12.21
COLM US
EQUITY
ColumbiaSportswear
Corp 1.20 1.16 - 0.01 -
ADDYY US
Equity AdidasAG 32.38 33.32 24.34 28.10 24.96
NKE US EQUITY Nike Inc 9.92 12.68 12.32 3.71 6.74
The increased issuance of debt has dramatically changed the corporate structure of Under
Armour especially in the last year it changed 100%. Now 40% of the capital structure is
composed of debt and it is common for the retail industry as seen with Adidas, however
other companies such as Nike have been successful at maintaining low levels of debt.
Under Armor has a greater level of debt giving them more financial leverage causing
greater volatility in their earnings.
Gross Profit Margin:
Ticker Company 2015 2014 2013 2012 2011
UA US Equity Under Armour Inc 48.08 49.03 48.74 47.92 48.40
COLM US Equity Columbia Sportswear Corp 46.15 45.46 44.13 42.91 43.41
ADDYY US Equity Adidas AG 48.28 47.64 49.29 47.73 47.51
NKE US Equity Nike Inc 46.32 45.49 44.26 43.22 44.31
The Gross Profit margin has been relatively the same for Under Armour and it is one of
the leaders so it should not be an issue going forward.
Operating Margin:
Ticker Company Column22 Column3 Column4 Column5 Column6
2015 2014 2013 2012 2011
UA US Equity UnderArmour Inc 10.31 11.48 11.37 11.37 11.05
COLM US
EQUITY
ColumbiaSportswear
Corp 10.74 9.47 7.82 8.00 8.05
ADDYY US
Equity Adidas AG 6.26 6.08 8.32 6.18 7.15
NKE US EQUITY Nike Inc 13.64 13.24 12.79 13.21 13.49
The operating margin is right in the middle of the pack of the industry where Nike is still
clearly the leader in the industry with the greatest operating margin. Nike outsources a lot
of their manufacturing and distribution processes while Under Armour is known for its
direct distribution channel to their consumers and are increasing their number of
company owned stores in outlets across America. The recent decline in operating margin
for Under Armour probably has to do with the increased fixed costs associated with debt
financing.
Profit Margin:
Ticker Company Column22 Column3 Column4 Column5 Column6
2015 2014 2013 2012 2011
UA US Equity UnderArmour Inc 5.87 6.75 6.96 7.02 6.58
COLM US
EQUITY
ColumbiaSportswear
Corp 7.49 6.53 5.60 5.98 6.11
ADDYY US
Equity Adidas AG 3.75 3.37 5.54 3.53 4.60
NKE US EQUITY Nike Inc 10.70 9.69 9.77 9.53 10.22
The profit margin for Under Armour has been lagging recently and is a cause of concern
for the future since the higher fixed costs from the debt financing is eating away into the
profits. Under Armour is striving for long-term growth and make take some profit hits
initially but the new investments should produce further revenue growth.
Liquidity Ratios
Current Ratio:
Ticker Company Column22 Column3 Column4 Column5 Column6
2015 2014 2013 2012 2011
UA US Equity UnderArmour Inc 3.13 3.67 2.65 3.58 3.76
COLM US
EQUITY
ColumbiaSportswear
Corp 3.41 3.39 4.15 4.45 3.93
ADDYY US
Equity Adidas AG 1.40 1.68 1.45 1.57 1.46
NKE US EQUITY Nike Inc 2.52 2.72 3.44 3.05 2.85
The current ratio is a more accurate measure for the textile industry for liquidity since
their inventory is easily turned over into sales. Under Armour is one of the leaders in the
industry for the current ratio, which suggests that their ability to meet their debt
obligations should be no problem since it should be at least above 1. It has been declining
slightly over recent years and it shouldn’t be a problem but something that investors
should keep an eye on
Quick Ratio:
The quick ratio is has been decreasing for Under Armour in the last five years probably
because of the debt issuances and it is trailing far behind the leader Columbia Sportswear.
However, Under Armour has enough current assets to cover its liabilities, but it is
Ticker Company Column22 Column3 Column4 Column5 Column6
2015 2014 2013 2012 2011
UA US Equity UnderArmour Inc 1.18 2.07 1.31 2.05 1.69
COLM US
EQUITY
ColumbiaSportswear
Corp 2.03 2.10 2.78 2.66 2.23
ADDYY US
Equity AdidasAG 0.67 0.86 0.75 0.86 0.71
NKE US EQUITY Nike Inc 1.47 1.71 2.29 1.77 1.94
something to keep an eye on with their increased levels of debt to finance their assets and
to continue to expand the company.
Inventory Turnover:
Ticker Company Column22 Column3 Column4 Column5 Column6
2015 2014 2013 2012 2011
UA US Equity UnderArmour Inc 3.12 3.13 3.03 2.97 2.82
COLM US
EQUITY
ColumbiaSportswear
Corp 2.92 3.21 2.72 2.62 2.82
ADDYY US
Equity Adidas AG 3.10 2.95 2.81 3.12 3.03
NKE US EQUITY Nike Inc 3.88 4.13 4.26 4.44 4.77
The inventory turnover ratio is important for the textile industry since it represents the
ability to sell their products and have room to bring out the apparel and footwear for the
next season. Seasonality plays a key role especially for Under Armour when it relates to
different footwear or apparel for the different sports seasons. Under Armour is in the
middle of the pack for inventory turnover and Nike has a significant leg up on the
competition but it has been decreasing recently. Under Armour is doing a better job
turning over their inventory, which is directly reflected in their high revenue growth.
Leverage Ratios
Debt to Asset:
Ticker Company Column22 Column3 Column4 Column5 Column6
2015 2014 2013 2012 2011
UA US Equity UnderArmour Inc 23.32 13.57 9.69 5.35 8.46
COLM US
EQUITY
ColumbiaSportswear
Corp 0.92 0.88 - 0.01 -
ADDYY US
Equity Adidas AG 13.71 15.08 11.50 12.76 11.39
NKE US EQUITY Nike Inc 5.83 7.38 7.78 2.49 4.42
The amount of debt compared to the total number of assets has been increasing
exponentially for Under Armour over the last 5 years compared to the industry as a
whole. The greater amount of debt should allow the company to have greater financial
leverage and return for their investors should the business continue to grow. It also
increases the amount of risk Under Armour may face in the future should the company
start to go south and revenue growth starts to fall.
Operational Ratios
Days Sales Outstanding:
Ticker Company Column22 Column3 Column4 Column5 Column6
2015 2014 2013 2012 2011
UA US Equity UnderArmour Inc 32.85 28.98 30.17 30.87 29.26
COLM US
EQUITY
ColumbiaSportswear
Corp 56.20 56.58 69.45 75.18 70.21
ADDYY US
Equity Adidas AG 43.10 47.15 44.93 40.37 44.69
NKE US EQUITY Nike Inc 38.20 43.01 45.05 49.18 50.63
The number of days sales are outstanding is important ratio for the textile industry and
Under Armour is significantly lagging behind their competitors and turning their
accounts receivable into cash. This directly relates to the decreasing current and quick
ratio and is a potential reason for the decrease along with the additional levels of debt to
expand the business. Revenue growth is another reason for the increase in the days sales
outstanding since the more sales means there will be more returns and a greater bad debt
expense as a result of increased sales.
Valuation Ratios
Price to Earnings Ratio
P/E 2015 2014 2013 2012 2011
Under Armour 91.123562 77.410504 53.189832 52.055818 48.626002
Columbia
Sportswear 28.081044 26.833913 20.365024 17.660705 24.291976
Adidas 25.240706 22.573055 29.936189 17.355811 16.862191
Nike 30.132481 26.655295 24.642367 21.451481 19.929281
Under Armour has a P/E ratio of 91.12. The current price stock price of Under Armour is
$84. Under Armour may in fact be undervalued since it is still in the growth stage of its
life cycle and the P/E ratio is lower than the current stock price. The P/E ratio has nearly
doubled in the last 5 years leading me to believe there are strong signs of growth at Under
Armour including the launch of new line of shoes by the most popular NBA player Steph
Curry and sponsorship from the NFL MVP Cam Newton. Under Armour has expanded
beyond its normal reach in the textile industry of producing sweatshirts, including cold
and heat gear along with sports equipment including football cleats and basketball shoes.
Short Sales:
The dramatic increase in short sales and the short interest rate as well as the increased
volume of transactions is quite evident because of the announcement of the 2 for 1 stock
split of the company’s common stock shares. A stock split is usually not viewed highly
by investors and typically leads to a downturn in the price of the security since investors
believe that the company thinks that the stock price has gotten too high and too much
higher than its competitors in the industry. This will help provide greater liquidity in the
marketplace for Under Armour making the stock more affordable and should also
increase the volume of shares traded on a daily basis because of the lower price.
Institutional Holdings:
The largest institutional holders that hold a beneficial ownership in the company are
Vanguard Group, FMR LLC, Jennison Associates LLC, and Blackrock. Vanguard is the
top institutional holder with 8.29% of shares outstanding, FMR LLC holds 7.83%,
Jennison Associates LLC holds 7.08%, and Blackrock holds 5.37%. Should any of these
companies liquidate their shares it would cause a dramatic drop in the share price.
Vanguard Group is unlikely to liquidate their shares since they manage mutual funds.
FMR LLC is fidelity investments that also manage mutual funds making it not likely.
Jennison Associates LLC is an asset management firm so it’s not probable they will
liquidate all of their shares at once. Blackrock is a global investment firm so the
likelihood that they will liquidate their entire position in Under Armour is pretty unlikely.
Insider Transactions:
Recently over the past year there have been insider transactions in both directions,
however there have clearly been more net buys. Most of the buys are for compensation
and rewards. This means that the insider transactions are not much of a concern for an
investor since most of these are compensation options and relatively safe there is no huge
sell of shares for Under Armour.
Company News:
Under Armour had a strong earnings report for the first quarter of 2016 where the net
revenues increased by 30%1 to bring it up to a total of $1.05 billion. Additionally,
operating revenue went up 26% to $35 million. Overall the projections for 2016 increased
the net revenues to $5 billion and the operating income was raised from $503 million to
$507 million. The largest increase in revenue is attributed to the widespread success of
the Steph Curry basketball line as footwear net revenues jumped 64% to $264 million
compared to $161 million in the last quarter of 2015. For the past 6 years revenue growth
has consistently been greater than 20%. Therefore, the future outlook for the year is better
than expected and it is the reason for the recent recovery in the stock price starting on
April 21st after the devaluation from the stock split.
1 http://finance.yahoo.com/news/under-armour-reports-first-quarter-110000033.html
Daily Pricing:
The daily pricing shows how the security is not volatile in price movements proving the
low beta that now sits around 0.07.
Benchmark Comparison:
0
2000
4000
6000
8000
10000
12000
1/29/2016 2/29/2016 3/31/2016
InvestmentValue
Day
Under Armour
Under Amour Value
Benchmark Comparison:
The S&P 500 has greatly outperformed the Under Armour security throughout the
semester yielding a much greater return than Under Armour. The reason that the line is
relatively flat compared to the S&P 500 is the beta of the overall market of 1 is much
greater than the beta of Under Armour, which is around 0.07 as of right now in contrast
to where it started at 0.16 in January. This means that the volatility of Under Armour is
significantly less than the S&P 500.
Rational Assessment:
Under Armour has posted strong financial standing in regards to their profitability,
liquidity, leverage, and operational activities amongst their industry. However, especially
given the recent stock 2 for 1 split it appears that the initially intrinsic value of the stock
was overpriced. This company is definitely in the growth stage with high revenue growth,
however it hasn’t necessarily seen the increase in earnings yet. Also, given the relatively
low beta of this company I am questioning my initial decision to invest in this security.
The return on my investment so far has yielded me about 2.86 % and if it were to be
annualized it would be 11.42% would be greater than my required rate of return of
9.986%. I will continue to see how this investment moves in the coming weeks,
especially with the positive first quarter earnings.
Alphabet Inc.
Symbol: GOOGL
Exchange: NASDAQ
Closing Price as of 1/29: $761.35
Quantity purchased on 1/29: 13.1345636
Value of Investment on 1/29: $10,000
Closing Price as of 4/29: $707.48
Current Value of Investment as of 4/29: 9297.694884 (return of -7.02%)
Annual Return: -28.09%
Security Profile
Alphabet Inc. through its subsidiaries, builds technology products and provides
services to organize the information including Google search, YouTube, Google apps,
app store, mobile devices, advertising program, android, Google Maps, Google Wallet,
social media Google +, Chromebook and Chromecast, and Google Cloud Storage to
name a few. Alphabet Inc. was founded in 1998 and is headquartered in Mountain View,
California.
Financial Year End: Dec 31
Beta: 0.89
Sector: Technology
Industry: Internet Information Provider
Position in the Industry: Leader
Reasonfor Selection:
Alphabet fits well into my portfolio because they do not pay out dividends to their
shareholders but instead since they are a technology based company focus more on
innovation with investing into R&D to create new products/services. They are a large cap
company that offers potential for growth while maintaining stability.
Expected Return:
The one-year target estimate for Alphabet is $924.07.
Expected Return=(Price^1-T-Price^T)/Price^T
($924.07-$761.35)/$761.35=21.3725618966%
This gives me an annual return of 21.3726%
Financial Ratios:
The financial ratios that are most relevant are the debt to equity ratio, revenue growth,
return on equity, return on assets, return on invested capital, and EBIT margin.
Benchmark: An appropriate benchmark to measure Alphabet against is the S&P500,
which includes Alphabet Inc. and the reason I picked this as my benchmark is Alphabet is
a large cap security that is a part of the S&P 500 and could easily be compared to other
securities relevant to the internet information provider industry.
Alphabet Inc (GOOGL US)
-Income Statement
In Millions of USD except Per Share FY 2015
Percent
+/- FY 2014
Percent
+/- FY 2013
12 Months Ending 12/31/2015 12/31/2014 12/31/2013
Revenue 74,989.0 13.62% 66,001.0 18.88% 55,519.0
+ Sales & Services Revenue 67,390.0 13.02% 59,624.0 17.96% 50,547.0
+ Other Revenue 7,599.0 19.16% 6,377.0 28.26% 4,972.0
- Cost of Revenue 28,164.0 11.26% 25,313.0 15.30% 21,954.0
+ Cost of Goods & Services 28,164.0 11.26% 25,313.0 15.30% 21,954.0
Gross Profit 46,825.0 15.08% 40,688.0 21.22% 33,565.0
+ Other Operating Income 0.0 0% 0.0 0% 0.0
- Operating Expenses 27,465.0 15.35% 23,811.0 32.13% 18,021.0
+ Selling, General & Admin 15,183.0 8.59% 13,982.0 27.90% 10,932.0
+ Selling & Marketing 9,047.0 11.27% 8,131.0 24.57% 6,527.0
+ General & Administrative 6,136.0 4.87% 5,851.0 32.83% 4,405.0
+ Research & Development 12,282.0 24.92% 9,832.0 38.69% 7,089.0
+ Other Operating Expense 0.0 100.00% -3.0 -100% 0.0
Operating Income (Loss) 19,360.0 14.71% 16,877.0 8.58% 15,544.0
- Non-Operating (Income) Loss -672.0 -80.16% -373.0 5.57% -395.0
+ Interest Expense, Net -895.0 -38.76% -645.0 5.84% -685.0
+ Interest Expense 104.0 2.97% 101.0 24.69% 81.0
- Interest Income 999.0 33.91% 746.0 -2.61% 766.0
+ Foreign Exch (Gain) Loss 422.0 4.98% 402.0 6.07% 379.0
+ Other Non-Op (Income) Loss -199.0 -53.08% -130.0
-
46.07% -89.0
Pretax Income (Loss), Adjusted 20,032.0 16.13% 17,250.0 8.23% 15,939.0
- Abnormal Losses (Gains) 381.0
4333.33
% -9.0
-
122.50
% 40.0
+ Asset Write-Down — -100% 378.0 100% —
+ Sale of Business — #VALUE! — -100% 57.0
+ Legal Settlement 47.0 100% — 0% —
+ Restructuring — -100% 3.0
-
97.87% 141.0
+ Sale of Investments 334.0 185.64% -390.0
-
146.84
% -158.0
+ Other Abnormal Items — 0% — 0% —
Pretax Income (Loss), GAAP 19,651.0 13.86% 17,259.0 8.55% 15,899.0
- Income Tax Expense (Benefit) 3,303.0 -9.23% 3,639.0 42.59% 2,552.0
+ Current Income Tax 3,561.0 -2.36% 3,647.0 19.77% 3,045.0
+ Deferred Income Tax -258.0
-
3125.00
% -8.0 98.38% -493.0
+ Tax Allowance/Credit — 0% — 0% 0.0
Income (Loss) from Cont Ops 16,348.0 20.03% 13,620.0 2.05% 13,347.0
- Net Extraordinary Losses (Gains) 0.0 100.00% -516.0
-
220.84
% 427.0
+ Discontinued Operations 0.0 100.00% -516.0
-
220.84
% 427.0
+ XO & Accounting Changes 0.0 0% 0.0 0% 0.0
Income (Loss) Incl. MI 16,348.0 15.65% 14,136.0 9.41% 12,920.0
- Minority Interest 0.0 0% 0.0 0% 0.0
Net Income, GAAP 16,348.0 15.65% 14,136.0 9.41% 12,920.0
- Preferred Dividends 0.0 0% 0.0 0% 0.0
- Other Adjustments 522.0 100% 0.0 0% 0.0
Net Income Avail to Common, GAAP 15,826.0 11.96% 14,136.0 9.41% 12,920.0
Net Income Avail to Common, Adj 16,073.7 18.07% 13,614.2 1.80% 13,373.0
Net Abnormal Losses (Gains) 247.7
4333.33
% -5.9
-
122.50
% 26.0
Net Extraordinary Losses (Gains) 0.0 100.00% -516.0
-
220.84
% 427.0
Basic Weighted Avg Shares 684.6 1.29% 675.9 1.54% 665.7
Basic EPS, GAAP 23.11 10.52% 20.91 7.73% 19.41
Basic EPS from Cont Ops 20.05 -0.50% 20.15 0.50% 20.05
Basic EPS from Cont Ops, Adjusted 23.48 16.57% 20.14 0.26% 20.09
Diluted Weighted Avg Shares 744.7 0.36% 742.0 9.50% 677.6
Diluted EPS, GAAP 22.84 11.04% 20.57 7.87% 19.07
Diluted EPS from Cont Ops 22.84 15.24% 19.82 0.61% 19.70
Diluted EPS from Cont Ops, Adjusted 23.17 16.96% 19.81 0.37% 19.74
Income Statement Analysis:
Revenue Analysis
Google’s revenue was up 18.88% in 2014 for the following reasons was the Google
website revenues increased $7,663 million in 2014 since there was increase in all ad
formats, YouTube engagement ads, and slightly hampered by the increased strength of
the US dollar. The Google network Members’ websites grew $889 million because of
new and richer ad formats and growth in the number of Google Network members.
Google’s other revenues increased $1,101 million from 2014 to 2015 and also increased
as a percentage of total revenues. The increases were caused by growth of the sales of
digital content products in the Google Play store, predominantly apps. Additionally, there
was also an increase in services fees collected for cloud and apps offerings. However,
these increases were moderately offset by the increasing strength of the U.S. dollar. In
2014 other revenues increased $1,615 million when compared to 2013. The growth was
caused by sales of digital content products in the Google Play Store and primarily apps.
Expense Analysis
Costs of revenues increased $3,968 million in 2014 compared to 2013.In 2014 there was
an impairment charge totaling $378 million that was linked to a patent licensing royalty
asset acquired in relation to the acquisition of Motorola that did not happen again in
2015. Part of the increase was attributed to the traffic acquisition costs that totaled $1,239
million that stemmed from greater distribution fees for the extra traffic directed towards
Google websites. It also, included new advertiser fees paid to Google Network Members
that was caused by the upswing in advertising revenues. The rest of the upswing is
attributed to data center costs, content acquisition costs related to improved usage of
YouTube and digital content by Google’s users, and revenue share payments to mobile
carriers and OEMs. The increase is also related to previously discussed impairment
charge.
Sales and marketing expenses increased $916 million in 2015 because of the increase in
labor and facilities related costs of $329 million and an increased in stock based
compensation expense of $184 million. Additionally, there was an increase in advertising
and promotional expenses of $329 million and an increase in professional services of
$158 million. In 2014 sales and marketing expenses went up $1,577 million because of
an increased advertising and promotional expenses totaling $614 million. Additional
there was labor and facilitates related costs of $571 million and stock based
compensation expense increase of $163 million from sales going up 15%.
General and Administrative expenses increased $1,419 million in 2014 because of an
increase in labor and facility related costs of $576 million and an growth in stock based
compensation expense of $260 million that stem from a 24% increases in general and
administration headcount. Professional services went up $14 million since there were
increased legal related costs; also there were outsourced services and consulting.
Research and development increased $2,450 million in 2015 since there was an increased
in labor and facilities related costs of $1,502 million and also an upswing in stock based
compensation expense of $487 million. Additionally there was an estimated $248 million
increase in depreciated and equipment related expenses and professional services grew
$174 million since there was expenses for outsourced services and consulting. These
were the primary reasons research and development increased in 2014 with an overall
increase of $2,695 million of expenses. This was composed of increases in facilities
reacted costs of $1,289 million, stock based compensation $559 million, depreciated and
equipment related expense of $425 million and $371 million for outsourced services and
consulting.
Alphabet Inc (GOOGL
US) - Balance Sheet
In Millions of USD except Per Share FY 2015 FY 2014 FY 2013
12 Months Ending 12/31/2015
Percent
+/- 12/31/2014
Percent
+/- 12/31/2013
Total Assets
+ Cash, Cash Equivalents & STI 73,066.0 13.47% 64,395.0 9.67% 58,717.0
+ Cash & Cash Equivalents 16,549.0 -9.80% 18,347.0 -2.92% 18,898.0
+ ST Investments 56,517.0 22.73% 46,048.0 15.64% 39,819.0
+ Accounts & Notes Receiv 11,556.0 23.16% 9,383.0 5.64% 8,882.0
+ Accounts Receivable, Net 11,556.0 23.16% 9,383.0 5.64% 8,882.0
+ Notes Receivable, Net 0.0 0% 0.0 0% 0.0
+ Inventories 0.0 0% 0.0 -100.00% 426.0
+ Raw Materials 0.0 0% 0.0 -100.00% 115.0
+ Work In Process 0.0 0% 0.0 0%! 0.0
+ Finished Goods 0.0 0% 0.0 -100.00% 311.0
+ Other Inventory 0.0 0% 0.0 0% 0.0
+ Other ST Assets 5,492.0 12.59% 4,878.0 0.35% 4,861.0
+ Derivative & Hedging Assets 0.0 0% 0.0 0% 0.0
+ Deferred Tax Assets —
#VALUE
! — #VALUE! 1,526.0
+ Income Taxes Receivable 1,903.0
222.00
% 591.0 44.85% 408.0
+ Misc ST Assets 3,589.0 -16.28% 4,287.0 46.46% 2,927.0
Total Current Assets 90,114.0 14.57% 78,656.0 7.92% 72,886.0
+ Property, Plant & Equip, Net 29,016.0 21.49% 23,883.0 44.54% 16,524.0
+ Property, Plant & Equip 40,146.0 22.60% 32,746.0 37.37% 23,837.0
- Accumulated Depreciation 11,130.0 25.58% 8,863.0 21.20% 7,313.0
+ LT Investments & Receivables 5,183.0 68.33% 3,079.0 55.82% 1,976.0
+ LT Marketable Securities 5,183.0 68.33% 3,079.0 55.82% 1,976.0
+ Other LT Assets 23,148.0 -1.79% 23,569.0 20.66% 19,534.0
+ Total Intangible Assets 19,716.0 -2.43% 20,206.0 15.08% 17,558.0
+ Goodwill 15,869.0 1.73% 15,599.0 35.74% 11,492.0
+ Other Intangible Assets 3,847.0 -16.50% 4,607.0 -24.05% 6,066.0
+ Prepaid Expense 3,181.0 -0.19% 3,187.0 61.29% 1,976.0
+ Deferred Tax Assets 251.0 42.61% 176.0 100% —
+ Derivative & Hedging Assets 0.0 0% 0.0 0% 0.0
+ Misc LT Assets 0.0 0% 0.0 0% 0.0
Total Noncurrent Assets 57,347.0 13.49% 50,531.0 32.86% 38,034.0
Total Assets 147,461.0 14.15% 129,187.0 16.47% 110,920.0
Liabilities& Shareholders' Equity
+ Payables & Accruals 12,853.0 14.39% 11,236.0 7.43% 10,459.0
+ Accounts Payable 1,931.0 12.59% 1,715.0 -30.09% 2,453.0
+ Accrued Taxes 302.0
214.58
% 96.0 300.00% 24.0
+ Interest & Dividends Payable — 0% — 0% 0.0
+ Other Payables & Accruals 10,620.0 12.68% 9,425.0 18.08% 7,982.0
+ ST Debt 3,225.0 60.53% 2,009.0 -33.23% 3,009.0
+ ST Borrowings 2,000.0 0.05% 1,999.0 -0.50% 2,009.0
+ ST Capital Leases 225.0
2150.00
% 10.0 11.11% 9.0
+ Current Portion of LT Debt 1,000.0 100% 0.0 -100.00% 991.0
+ Other ST Liabilities 3,232.0 -8.55% 3,534.0 44.84% 2,440.0
+ Deferred Revenue 788.0 4.79% 752.0 -29.19% 1,062.0
+ Derivatives & Hedging 16.0
300.00
% 4.0 0.00% 4.0
+ Misc ST Liabilities 2,428.0 -12.60% 2,778.0 102.18% 1,374.0
Total Current Liabilities 19,310.0 15.08% 16,779.0 5.48% 15,908.0
+ LT Debt 1,995.0 -38.20% 3,228.0 44.36% 2,236.0
+ LT Borrowings 1,995.0 -33.32% 2,992.0 50.35% 1,990.0
+ LT Capital Leases 0.0
-
100.00
% 236.0 -4.07% 246.0
+ Other LT Liabilities 5,825.0 9.49% 5,320.0 -2.69% 5,467.0
+ Accrued Liabilities 0.0 0% 0.0 0% 0.0
+ Pension Liabilities 0.0 0% 0.0 0% 0.0
+ Pensions 0.0 0% 0.0 0% 0.0
+ Other Post-Ret Benefits 0.0 0% 0.0 0% 0.0
+ Deferred Revenue 151.0 45.19% 104.0 -25.18% 139.0
+ Deferred Tax Liabilities 189.0 -75.07% 758.0 -61.07% 1,947.0
+ Derivatives & Hedging 0.0 0% 0.0 0% 0.0
+ Misc LT Liabilities 5,485.0 23.04% 4,458.0 31.85% 3,381.0
Total Noncurrent Liabilities 7,820.0 -8.52% 8,548.0 10.97% 7,703.0
Total Liabilities 27,130.0 7.12% 25,327.0 7.27% 23,611.0
+ Preferred Equity 0.0 0% 0.0 0% 0.0
+ Share Capital & APIC 32,982.0 14.65% 28,767.0 10.98% 25,922.0
+ Common Stock 0.7 1.04% 0.7 102.56% 0.3
+ Additional Paid in Capital 32,981.3 14.65% 28,766.3 10.97% 25,921.7
- Treasury Stock 0.0 0% 0.0 0% 0.0
+ Retained Earnings 89,223.0 18.86% 75,066.0 22.53% 61,262.0
+ Other Equity -1,874.0
-
7040.74 27.0 -78.40% 125.0
%
Equity Before Minority Interest 120,331.0 15.86% 103,860.0 18.96% 87,309.0
+ Minority Interest 0.0 0% 0.0 0% 0.0
Total Equity 120,331.0 15.86% 103,860.0 18.96% 87,309.0
Total Liabilities& Equity 147,461.0 14.15% 129,187.0 16.47% 110,920.0
Current Assets
Inventories and raw materials decreased because of the sale of the Motorola Mobile
business in 2014 and the sale of the Motorola Home business in 2013 since the majority
of business consisted of hardware products. Alphabet is going with the trend of less
hardware and more software products to be offered instead.
Long Term Assets
In August 2013 Alphabet entered into a capital lease obligation for $258 million with the
intent to purchase the property in 2016 making it a long-term asset increasing the overall
value of property, plant, and equipment. The decrease in goodwill can be attributed to the
sale of the of Motorola Home business in 2013. The accumulated depreciation can be
accounted for with the new capital lease agreement that began in 2013.
Current Liabilities
In 2014 Alphabet had a liability to repay the first tranche of the $3 billion of unsecured
senior notes for corporate purposes making it a current liability since it was due in less
than 1 year. Also, a current liability includes the portion of the capital lease obligation
due in the current year for 2013, 2014, 2015 for each year. Short-term debt includes up to
$3 billion through the issuance of commercial paper and it increased $934 million in
2015 accounting for the large difference between 2015 and 2014. This short-term debt
includes the capital lease agreement where the option to purchase the property in 2016 is
expected to be executed making it a year or less, hence it becomes a current liability.
Long Term Liabilities
The long-term liabilities include the outstanding note issued in February of 2014, which
was $1 billion of an unsecured senior note in order to repay the first tranche of the
unsecured senior note for corporate purposes. The capital lease is no longer considered a
Long Term liability it is a short-term liability since it is expected that Alphabet will
exercise the option to purchase the property in 2016.
Equity
On April 2, 2014, there was a two-for-one stock split in the form of a stock dividend (the
Stock Split). On August 10, 2015, we announced plans to create a new public holding
company, Alphabet Inc. (Alphabet), and a new operating structure. On October 2, 2015,
we implemented the holding company reorganization, and as a result, Alphabet became
the successor issuer to Google Inc. (Google). In October 2015, the board of directors of
Alphabet authorized the company to repurchase up to $5,099,019,513.59 of its Class C
capital stock, commencing in the fourth quarter of 2015. The repurchases are being
executed from time to time, subject to general business and market conditions and other
investment opportunities, through open market purchases or privately negotiated
transactions.
Alphabet Inc (GOOGL
US) - Cash Flow
In Millions of USD except Per Share FY 2015 FY 2014 FY 2013
12 Months Ending 12/31/2015 Percent +/- 12/31/2014 Percent +/- 12/31/2013
Cash from Operating Activities
+ Net Income 16,348.0 15.65% 14,136.0 9.41% 12,920.0
+ Depreciation & Amortization 5,063.0 1.69% 4,979.0 26.40% 3,939.0
+ Non-Cash Items 5,022.0 93.97% 2,589.0 41.40% 1,831.0
+ Stock-Based Compensation 4,655.0 28.20% 3,631.0 26.87% 2,862.0
+ Deferred Income Taxes -179.0 -72.12% -104.0 76.20% -437.0
+ Other Non-Cash Adj 546.0 158.21% -938.0 -57.91% -594.0
+ Chg in Non-Cash Work Cap -409.0 -160.86% 672.0 2267.74% -31.0
+ (Inc) Dec in Accts Receiv -2,094.0 -27.61% -1,641.0 -25.55% -1,307.0
+ (Inc) Dec in Inventories 0.0 0% 0.0 0% —
+ Inc (Dec) in Accts Payable 203.0 -53.44% 436.0 -27.93% 605.0
+ Inc (Dec) in Other 1,482.0 -21.04% 1,877.0 179.73% 671.0
+ Net Cash From Disc Ops — 0% — 0% —
Cash from Operating Activities 26,024.0 16.30% 22,376.0 19.92% 18,659.0
Cash from Investing Activities
+ Change in Fixed & Intang -9,915.0 9.53% -10,959.0 -48.94% -7,358.0
+ Disp in Fixed & Intang 0.0 0% 0.0 0% 0.0
+ Disp of Fixed Prod Assets 0.0 0% 0.0 0% 0.0
+ Disp of Intangible Assets 0.0 0% 0.0 0% 0.0
+ Acq of Fixed & Intang -9,915.0 9.53% -10,959.0 -48.94% -7,358.0
+ Acq of Fixed Prod Assets -9,915.0 9.53% -10,959.0 -48.94% -7,358.0
+ Acq of Intangible Assets 0.0 0% 0.0 0% 0.0
+ Net Change in LT Investment 0.0 0% 0.0 0% 0.0
+ Dec in LT Investment 0.0 0% 0.0 0% —
+ Inc in LT Investment 0.0 0% 0.0 0% —
+ Net Cash From Acq & Div -236.0 94.76% -4,502.0 -518.01% 1,077.0
+ Cash from Divestitures 0.0 -100.00% 386.0 -84.71% 2,525.0
+ Cash for Acq of Subs -236.0 95.17% -4,888.0 -237.57% -1,448.0
+ Cash for JVs 0.0 0% 0.0 0% 0.0
+ Other Investing Activities -13,560.0 -142.40% -5,594.0 24.38% -7,398.0
+ Net Cash From Disc Ops — 0% — 0% —
Cash from Investing Activities -23,711.0 -12.61% -21,055.0 -53.92% -13,679.0
Cash from Financing Activities
+ Dividends Paid 0.0 0% 0.0 0% 0.0
+ Cash From (Repayment) Debt -23.0 -27.78% -18.0 96.77% -557.0
+ Cash From (Repay) ST Debt -23.0 -27.78% -18.0 96.77% -557.0
+ Cash From LT Debt 0.0 0% 0.0 0% 0.0
+ Repayments of LT Debt 0.0 0% 0.0 0% 0.0
+ Cash (Repurchase) of Equity -1,232.0 -290.12% 648.0 34.72% 481.0
+ Increase in Capital Stock 548.0 -15.43% 648.0 34.72% 481.0
+ Decrease in Capital Stock -1,780.0 -100% 0.0 0% 0.0
+ Other Financing Activities -2,422.0 -17.06% -2,069.0 -164.92% -781.0
+ Net Cash From Disc Ops — 0% — 0% —
Cash from Financing Activities -3,677.0 -155.52% -1,439.0 -67.91% -857.0
Effect of Foreign Exchange Rates -434.0 -0.23% -433.0 -14333.33% -3.0
Net Changes in Cash -1,798.0 -226.32% -551.0 -113.37% 4,120.0
Cash Paid for Taxes 3,338.0 18.41% 2,819.0 45.91% 1,932.0
Cash Paid for Interest 96.0 11.63% 86.0 19.44% 72.0
Operating Activities
The largest sources of cash provided by operations are the advertising revenues generated
by Google websites and Google Network Members’ websites. They generate cash
through the sales of apps digital content, hardware products, licensing arrangements and
services fees for the cloud and apps and Maps API. However, in 2014 there was a
divesture in October related to the Motorola Mobile business that use to generate cash
from sales of hardware products for Alphabet Inc. The primary uses of cash from
operating activities included payments to Google Network Members and distribution
partners, and payments for content acquisition costs. Prior to the sale of the Motorola
Mobile business in 2014 the use of cash included manufacturing and inventory related
costs in the Motorola Mobile business segment. Other uses of cash were compensation
and associated costs, broad corporate expenditures, and income tax expenses. Net cash
provided by operating activities increased in 2015 when compared to 2014 because of
growth in net income adjusted for depreciation and stock based compensation expense
along with the loss on sales of marketable and nonmarketable securities. It was slightly
offset with a net decrease in cash due to changes in working capital. Net cash provided by
operating activities increased in 2014 when compared to 2013 since there was increased
net income adjusted for depreciation and loss of disposal of property and stock based
compensation expense and equipment and a net increase in cash from changes in work
capital that was propelled by changes in prepaid revenue share, expenses, and other
assets.
Investing Activities
On April 17, 2013 Motorola Home business was sold to Arris for $2.4 billion in cash
including $2.238 billion that was received when the deal was closed and post close
adjustments of $174 million received in the third quarter of 2013 and also $175 million of
Arris’ common stock. This resulted in a net gain on the disposal of the asset of $757
million. On October 29, 2014 Motorola Mobile business was sold to Lenovo for $2.9
billion that was financed by $660 million in cash and $750 million in Lenovo ordinary
shares and the leftover 1.5 billion was to be paid in an interest free promissory note.
Overall the sale left Alphabet with a gain on the disposal of the asset of $740 million net
of tax. There were also several acquisitions in 2014 and 2015 that resulted in the net loss
from investing activities when comparing the year over year for the past 3 years. In 2015
bebpop Technologies was acquired for $272 million of which $1 million was paid in cash
and the rest was financed with $271 million in Alphabet Class C capital stock. Other
acquisitions totaled an estimated $263 million. In 2014 Nest was acquired for $2.6
billion, which was comprised of $2.3 billion was in goodwill; $51 million was cash,
$430 attributed to intangible assets, and $84 million to net liabilities assumed.
Financing Activities
In May 2011 Alphabet issued 3.0 billion worth of notes that would be used in 3 equal
tranches of 1.0 billion with the first one due in 2014 then 2016 and 201. During 2014 in
February there was $1 billion issued in notes that used to repay $1 billion of the initial
tranche that were issued in 2011 for corporate purposes. As of the end of 2015 the $3.0
billion of unsecured senior notes had a carrying value of $3.0 billion and fair market
value of $3.1 billion. In August 2013, Alphabet entered into an agreement for $258
million for a capital lease obligation and they are expected to purchase the property in
2016. Alphabet has authorized a repurchase of shares of approximately $5.6 billion of its
Class C capital stock that began in the fourth quarter of 2015. These repurchases will be
made depending on market and business conditions from time to time.
The income taxes and effective tax rate decreased from 2014 to 2015 because of a
discrete benefit recognized in 2015 as the resolution of a multi-year audit in the USA and
there were proportionally more earnings realized in countries that have lower tax rates.
Income taxes and the effective tax rate increased from 2013 to 2014 because of greater
earnings that have higher tax rates and there was more tax benefit recognition in 2013 in
comparison to 2014 since there was a retroactive extension of 2012 federal research and
development credit that was counterbalanced by a benefit used on a valuation allowance
release that was associated with a capital loss to carry forward in 2014.
Finding a Sustainable Growth Rate:
Formula=g=ROE (1- Payout ratio)
Alphabet Inc. 2015 ROE=18.66%
2015 Payout Ratio=0
G=18.66%
Residual Income Model:
CAPM: 𝑅 𝑟 = 𝑅𝑓 + (𝑅 𝑚 − 𝑅𝑓)𝛽
1.93 %+( 12%-1.93%) (0.89) =10.8923
𝑷 𝟎 = 𝑩 𝟎 + (𝑬𝑷𝑺 𝟎 ∗ ( 𝟏 + 𝒈) − 𝑩 𝟎 ∗ 𝒌)/(𝒌− 𝒈)
759.47=175.07+ (23.59*(1+g)-175.07)/(.108923-g)
=9.73%
Therefore after calculating the growth rate from the residual income model we reject the
sustainable growth rate as the current growth rate of the company it is in fact much closer
to around 7%.
Revenue Growth Analysis:
Year Revenue Revenue Growth% Change
2015 $ 74,989.00 $ 8,988.00 13.62%
2014 $ 66,001.00 $ 10,482.00 18.88%
2013 $ 55,519.00 $ 5,344.00 10.65%
2012 $ 50,175.00 $ 12,270.00 32.37%
2011 $ 37,905.00
GeometricAverage 17.25%
Revenue growth has declined as whole over the past 5 years and the outlier of the growth
in 2012 offsets the geometric average. The decline in revenue growth is cause of concern
for the future growth of the company as a whole and it is lower than the sustainable
growth rate. Therefore, this level of growth is sustainable, but the revenue has been pretty
volatile over the last 5 years and Alphabet may be turning into a value company with the
decreased growth in revenue.
Gross Profit Growth Analysis:
Year Gross Profit Gross ProfitGrowth % Change
2015 $ 46,825.00 $ 6,137.00 15.08%
2014 $ 40,688.00 $ 7,123.00 21.22%
2013 $ 33,565.00 $ 3,895.00 13.13%
2012 $ 29,670.00 $ 4,953.00 20.04%
2011 $ 24,717.00
GeometricAverage 17.03%
The gross profit has been declining as well since its correlated to the revenue growth and
in fact the gross profit declined about 6% last year and the declining profit and revenue
growths are concerning for investors. This also suggests that the sustainable growth rate
is inaccurate since the gross profit growth is gradually becoming significantly lower than
the sustainable growth rate. The sustainable growth level suggests that the gross profit
margin growth rate is sustainable, but the residual income model might be more accurate
given the decrease in growth recently.
Net Income Growth Analysis:
Year NetIncome NetIncome Growth % Change
2015 $ 16,073.70 $ 2,459.50 18.07%
2014 $ 13,614.20 $ 241.20 1.80%
2013 $ 13,373.00 $ 2,516.10 23.18%
2012 $ 10,856.90 $ 1,119.90 11.50%
2011 $ 9,737.00
GeometricAverage 9.65%
The net income growth suggests that Alphabet had a down year in 2014 with an
extremely small net income growth level that appears to an outlier based on the last 5
years of data. This is much lower than the sustainable growth rate probably because of
the outlier in 2014. Overall the net income growth does show that this is a profitable
company.
Projected Income Statement:
AlphabetInc (GOOGL- US) Projected -Income Statement Column1 Column2
In Millionsof USDexceptpershare
12 monthsending 12/31/16 12/31/15
Revenue $87,924.60 $74,989.00
+ Sales & Services Revenue $79,014.78 $67,390.00
+ Other Revenue $8,909.83 $7,599.00
- Cost of Revenue $33,022.29 $28,164.00
Gross Profit $54,902.31 $46,825.00
- Operating Expenses $32,202.71 $27,465.00
+ Selling, General & Admin $17,802.07 $15,183.00
+ Research & Development $14,400.65 $12,282.00
+ Other Operating Expense $- $-
Operating Income (Loss) $22,699.60 $19,360.00
- Non-Operating (Income) Loss $-672.00 $-672.00
+ Interest Expense, Net $-895.00 $-895.00
+ Other Non-Op (Income) Loss $-199.00 $-199.00
Pretax Income (Loss), Adjusted $20,933.60 $20,032.00
- Income Tax Expense (Benefit) $3,558.71 $3,030.00
+ Current Income Tax $3,561.00
+ Deferred Income Tax $-258.00
Income (Loss) from Cont Ops $17,374.89 $16,438.00
Net Income, GAAP $17,374.89 $16,438.00
Basic Weighted Avg Shares $684.60 $684.60
Basic EPS, GAAP $25.38 $22.84
Projections
In order to make my projections for 2016 I increased the revenue, cost of goods sold (cost
of revenue), the operating expenses, the pre-tax income, and the EPS. For the revenue I
took the 5 year geometric average for revenue growth and then I took the percentage of
cost of goods sold to revenue from the previous year and multiplied it by the new
projected revenue to project the cost of revenue. All extraordinary items or non-recurring
income was excluded from the projections. All of the non-operating income expenses
were held at their current levels since they are fixed costs unlike the cost of goods sold. I
used the previous year tax rate of 17% to project the income tax expense. Then I took the
new net income and divided it by the basic weighted share outstanding from the previous
year to find the new EPS.
Financial Ratios:
Profitability
ROA:
The return on assets for Alphabet Inc. is right in line with the majority of the competition
with an insignificant difference between them Microsoft and Facebook, however Apple
has almost double the ROA in comparison to its competitors. The reason for the
differences is Apple has a dominant market share in the cell phone industry. Alphabet has
a strong partnership with Android as Google products are preinstalled, but the Android
phones designed by Alphabet are not nearly as successful as Apple or Samsung. Yahoo
has been struggling as of late and there have been talks of selling the company,
ROE:
Ticker Company Column22 Column3 Column4 Column5 Column6
Year 2015 2014 2013 2012 2011
GOOGLUS EquityAlphabetInc 14.18 14.79 16.25 16.54 18.66
FB US EQUITY Facebook 9.14 11.34 10.95 0.40 22.91
YHOO US Equity Yahoo!Inc (12.86) 29.03 9.89 29.12 8.36
AAPLUS EQUITY Apple Inc 42.71 33.61 30.64 42.84 41.67
MSFT US EQUITY MicrosoftCorp 13.53 26.17 30.09 27.51 44.84
The return on equity isn’t too much higher than the ROA meaning Alphabet Inc.
probably does not have high levels of debt. In contrast to Apple that has a significantly
higher ROE than ROA giving them financial leverage. The ROE for Alphabet Inc. is the
second highest amongst its competitors and has been slowly decreasing recently along
with most of their competitors except for Apple. Alphabet Inc. has appeared to be
maturing according to the slight declines in the ROE and ROA, although they are
constantly innovative it may be harder to get their latest innovation driverless cars to
Ticker Company Column22 Column3 Column4 Column5 Column6
Year 2015 2014 2013 2012 2011
GOOGLUS
Equity AlphabetInc 11.87 11.77 12.62 12.91 14.93
FB US EQUITY Facebook 8.21 10.11 9.04 0.30 14.33
YHOO US Equity Yahoo!Inc (8.15) 19.16 8.06 24.75 7.06
AAPLUS EQUITY Apple Inc 19.36 18.01 19.34 28.54 27.06
MSFT US EQUITY MicrosoftCorp 6.4314.02 16.58 14.77 23.77
market since the public is wary of them. The ROE is consistent with the poor ROA for
Yahoo indicating that this company may not have good financial standing.
Debt to Equity:
Ticker Company Column22 Column3 Column4 Column5 Column6
Year 2015 2014 2013 2012 2011
GOOGLUS EquityAlphabetInc 4.34 5.04 6.01 7.72 7.23
FB US EQUITY Facebook 0.26 0.65 3.08 20.04 13.82
YHOO US Equity Yahoo!Inc 4.24 3.02 8.46 - -
AAPLUS EQUITY Apple Inc 54.01 31.64 13.73 - -
MSFT US EQUITY MicrosoftCorp 44.07 25.22 19.76 18.00 20.88
The decreased levels of debt in the capital structure of Alphabet could account for the
decrease in the profit margins as well since there is less financial leverage when the level
of debt declines. Alphabet overall has minimal levels of debt that has been trending
downward over the past 5 years in contrast to Microsoft and Apple who have financing
their business with high levels of debt.
ROIC:
Apple is clearly leading the industry with the efficiency to turn allocated capital into
investment returns. Alphabet is currently second in ROIC and over the past 5 years
overall it has be on the decline, which appears to be fairly consistent with its competitors.
There is room for improvement in the efficiency at which Alphabet operates; however
they could be doing far worse such as Microsoft who has seen the furthest decline in the
past 5 years.
Ticker Company Column22 Column3 Column4 Column5 Column6
Year 2015 2014 2013 2012 2011
GOOGLUS EquityAlphabetInc 13.74 12.84 15.14 14.58 16.44
FB US EQUITY Facebook 9.18 11.42 10.14 0.59 25.15
YHOO US Equity Yahoo!Inc (8.48) 3.13 9.26 7.57 8.26
AAPLUS EQUITY Apple Inc 27.97 23.74 24.78 37.64 37.03
MSFT US EQUITY MicrosoftCorp 9.61 20.76 24.47 21.84 35.83
Gross Profit Margin:
Ticker Company 2015 2014 2013 2012 2011
GOOGL
US Equity
Alphabet Inc 62.44 61.65 60.39 62.69 65.21
FB US
Equity
Facebook 84.01 82.46 77.67 77.05 82.73
YHOO US
Equity
Yahoo! Inc 58.18 69.96 71.17 67.50 68.16
AAPL US
Equity
Apple Inc 40.13 39.26 37.41 41.91 42.41
MSFT US
Equity
Microsoft Corp 64.00 65.74 71.41 75.35 76.38
The gross profit margin for Alphabet is one of the worst for the industry meaning they
have higher cost of goods sold compared to their competitors where Facebook is the clear
leader.
Operating Margin:
The operating margin is also known as the return on sales and it depicts how well each
company is generating profits from operating income. This demonstrates that Alphabet
has a healthy operating margin and probably does not have any problems with liquidity
and is right in the middle of the pack for the industry. However, they do trail Facebook
significantly and Alphabet’s operating margin has decreased recently probably because of
the sale of the Motorola business since hardware typically generates higher profit margins
than software.
Profit Margin:
Ticker Company Column22 Column3 Column4 Column5 Column6
Year 2015 2014 2013 2012 2011
GOOGLUS EquityAlphabetInc 25.82 24.99 27.74 25.43 30.98
FB US EQUITY Facebook 34.72 40.06 35.62 10.57 47.32
YHOO US Equity Yahoo!Inc (95.58) 3.10 12.60 11.36 16.06
AAPLUS EQUITY Apple Inc 30.48 28.72 28.67 35.30 31.22
MSFT US EQUITY MicrosoftCorp 19.41 31.97 34.38 29.52 38.83
The decrease in the profit margin for Alphabet Inc. can best be attributed to the sale of
Home Motorola Business in 2013 and since Alphabet Inc. is utilizing more cloud based
products and software in general and moving away from hardware products. Alphabet
Inc. is one of the leaders of profit margin for the industry only slightly trailing behind
Apple whom offers more hardware products such as the iPhone.
Liquidity Ratios
Quick Ratio:
Alphabet has a healthy quick ratio that is well above the requirement of one since the
cash and cash equivalents should be able to cover your current liabilities in order to meet
your debt obligations. However, this does not appear to be an issue going forward since
as indicated by the capital structure and leverage ratios the amount of debt compared to
the amount of equity is minimal.
Current Ratio:
Ticker Company Column22 Column3 Column4 Column5 Column6
Year 2015 2014 2013 2012 2011
GOOGLUS EquityAlphabetInc 21.80 21.42 23.27 21.40 25.69
FB US EQUITY Facebook 20.47 23.46 18.94 0.63 18.00
YHOO US Equity Yahoo!Inc (87.74) 162.87 29.19 79.12 21.04
AAPLUS EQUITY Apple Inc 22.85 21.61 21.67 26.67 23.95
MSFT US EQUITY MicrosoftCorp 13.03 25.42 28.08 23.03 33.10
Ticker Company Column22 Column3 Column4 Column5 Column6
Year 2015 2014 2013 2012 2011
GOOGLUS Equity AlphabetInc 4.38 4.40 4.25 3.90 5.62
FB US EQUITY Facebook 10.91 9.04 11.42 9.83 4.96
YHOO US Equity Yahoo!Inc 5.41 2.00 3.27 4.02 2.56
AAPLUS EQUITY Apple Inc 0.73 0.67 1.23 1.04 1.12
MSFT US EQUITY MicrosoftCorp 2.30 2.31 2.53 2.41 2.35
Ticker Company Column22 Column3 Column4 Column5 Column6
Year 2015 2014 2013 2012 2011
GOOGLUS EquityAlphabetInc 4.67 4.69 4.58 4.22 5.92
FB US EQUITY Facebook 11.25 9.40 11.88 10.71 5.12
YHOO US Equity Yahoo!Inc 5.88 2.09 3.75 4.38 2.86
AAPLUS EQUITY Apple Inc 1.11 1.08 1.68 1.50 1.61
MSFT US EQUITY MicrosoftCorp 2.50 2.50 2.71 2.60 2.60
Alphabet has a healthy current ratio as well that does not vary much from the quick ratio
since the company is moving away from hardware products transitioning towards all
software products making the difference between the quick and current ratio small.
Leverage Ratios
Debt to Assets:
Ticker Company Column22 Column3 Column4 Column5 Column6
Year 2015 2014 2013 2012 2011
GOOGLUS EquityAlphabetInc 3.54 4.05 4.73 5.90 5.79
FB US EQUITY Facebook 0.23 0.58 2.66 15.60 10.69
YHOO US Equity Yahoo!Inc 2.73 1.90 6.61 - -
AAPLUS EQUITY Apple Inc 22.19 15.22 8.19 - -
MSFT US EQUITY MicrosoftCorp 20.03 13.14 10.95 9.85 10.97
The higher the debt to assets ratio the higher the financial leverage and the higher the
level of risk since debt financing is riskier. Once again Alphabet shows a low level of
debt in contrast to Apple and Microsoft whom have much higher financial risk and
leverage. Alphabet is positioned in the middle of the industry once again.
Operational Ratios
Days Sales Outstanding:
Ticker Company Column22 Column3 Column4 Column5 Column6
Year 2015 2014 2013 2012 2011
GOOGLUS EquityAlphabetInc 50.96 50.50 55.12 48.55 46.60
FB US EQUITY Facebook 43.13 40.80 42.38 45.53 45.24
YHOO US Equity Yahoo!Inc 76.41 79.52 77.52 75.08 75.66
AAPLUS EQUITY Apple Inc 22.97 30.43 25.59 19.32 18.29
MSFT US EQUITY MicrosoftCorp 63.59 77.83 77.98 76.37 73.06
The number of days that sales are outstanding is right in the middle of the pack for the
industry as whole for Alphabet. Recently this number has been increasing for Alphabet,
but the competition and industry as a whole appears to be decreasing. This shouldn’t be a
concern as of right now since Alphabet has healthy liquidity and debt ratios, however it is
something to be mindful of should the capital structure change and they issue more debt
financing to grow the business to purchase assets.
Short Sales:
Short sales hit a high during beginning of the year it appears sometime during February
where the stock price shot down about 100 points since it got as high as $780 per share
and at the lowest point it was around $700 a share. Short sales have been on the upswing
recently indicating that the price of the security Alphabet is expected to fall in price
slightly since the trend presently is a slight upward slope of short sales. Short interest is
slightly sloping upwards. The short interest ratio indicates that right now it will take 2.37
days for all of the investors shorting Alphabet to cover their position. Also the chart
shows how the average daily volume spikes up when investors close out their short
positions and the price begins to rise once again such as in February when there was the
highest volume of shares traded and the stock price plummeted. However, it has since
recovered and the stock price is expected to decline should short sales continue to rise.
Institutional Holders:
The largest institutional holders that hold a beneficial ownership in the company are
FMR LLC, Blackrock, and Vanguard Group. FMR LLC is the top institutional holder
with 6.26% of shares outstanding, Blackrock holds 6.11%, and Vanguard holds 5.96%.
Should any of these companies liquidate their shares it would cause a dramatic drop in
the share price. Vanguard Group is unlikely to liquidate their shares since they manage
mutual funds. FMR LLC is fidelity investments that also manage mutual funds making it
not likely. Blackrock is a global investment firm so the likelihood that they will liquidate
their entire position in Under Armour is pretty unlikely.
Insider Transactions:
The insider transactions indicate that the net sell of shares are typical of the company for
the compensation options to turn their stocks into cash and means that the insider
transactions are relatively safe and not much of a concern for the future of this security.
Company News:
Alphabet had its lowest one day drop in the stock price since October 2012 after the
negative earnings report from the first quarter of 2016 where they missed the earnings
targets2.The shares dropped 5.46% on Friday April 21 after the earnings were released.
The primary reason that the earnings fell short of the target was the fact that the company
spent more money to boost internet traffic. This article indicates that the miss was more a
headline move indicating that irrational investors just read the headline instead of
analyzing the earnings that included a 20% rise in revenue from Google websites and the
number of Ads jumped 29%. Many of the analysts cut the price target of Alphabet but
none of them downgraded the security. The analysts suggest to buy according to 48 of
them and 3 of them suggest to hold. Short term costs associated with the shift to mobile
automated advertising. Essentially there is still growth prospects but increasing costs are
said to be only be short term, however it is something to be mindful of.
2 http://finance.yahoo.com/news/alphabet-stock-slips-results-brokerages-141130061.html
Daily Pricing:
As shown in the graph the daily price is volatile due to the beta of the underlying
security, which is subject to the systemic risk of the overall market and the unsystemic
risk when the earnings for the first quarter were released on April 21.
Benchmark Comparison:
8600
8800
9000
9200
9400
9600
9800
10000
10200
10400
10600
1/29/2016 2/29/2016 3/31/2016
InvestmentValue
Day
Alphabet Inc
Alphabet Value
The benchmark is appropriate since Alphabet Inc is a large cap security and the typical
benchmark of large cap securities could be the movement of the overall market which is
best represented by the S&P 500. Clearly indicated by the chart Alphabet has severely
been outperformed by the S&P500 especially since the missed earnings report. The
increased costs are a reason for concern since they cut into profits, however they claim to
be temporary so a bounce back is possible especially given the volatility of the security if
the investor truly believes the increased costs are temporary.
Rationale Assessment:
My investment so far has not yielded me any return at all in fact the stock price has gone
down since my initial investment including a rough month of February and April. Given
the recent short interest rate on this security I am not overly optimistic for the return on
this security for the end of the semester. The failure to even come close to the benchmark
is concerning especially given the fact in the very beginning of February the stock price
shot up to an all-time high, but has struggled since especially recently after the earnings
report failed to meet projections. The trending short interest ratio could potentially
indicate that there is another drop in the stock price very possible in the near future. If I
went back and had to pick my securities again and had all of this research and knowledge
about the security I don’t think this would’ve been a wise investment as proven thus far
with the negative return on investment.
HartfordCore Equity A
Security Name: Hartford Core Equity A
Symbol: HAIAX
Exchange: NASDAQ
Price as of 1/29: $22.51
Quantity purchased of 1/29: 444.2470013
Value of Investment as of 1/29: $10,000
Closing Price as of 4/29: $23.46
Current Value of Investment as of 4/29: $10,422.03 (4.22% return)
Annual Return: 16.88%
Security Profile:
This is a large-blended mutual fund that seeks growth of capital and usually has at
least 80% invested in common stocks. This mutual fund does not pay a dividend and
focuses primarily on large capitalization companies with market caps similar to that of
the S&P 500. The mutual fund may invest 20% in foreign securities. The blended
strategy incorporates value and growth stocks providing ample diversification.
Hartford Core Equity A requires an initial investment of $2000 and each
subsequent investment must be $50 or more. In total I have invested $10,000 into the
mutual fund. 91.7% of the fund is invested into the stock market while 7.36% is invested
in cash reserves. The top 10 holding companies are Microsoft, CVS, JP Morgan Chase,
Alphabet, Costco Wholesale Corporation, Mondelez International, Apple Inc., Allegran
plc Ordinary Shares, Altria Group Inc., and PNC Financial Services Group. The
benchmark that I will be using will be the S&P 500. The load-adjusted returns for one
year are -1.53%, 3 years 12.65%, 5 year 11.59%, and 10 year 6.35%. Therefore, the
expected return on this investment is 12.65%.
Beta: 0.95
Category: Large Blend
Fund Family: Hartford Mutual Funds
Reasonfor Selection:
The mutual fund provides my portfolio with ample diversification by having no more
than 2.74% of the mutual fund invested in one stock. Additionally, the mutual fund offers
a variety of different sectors including but not limited to consumer cyclical, industrials,
technology, healthcare, and consumer defensive, and financial services.
Expected Return:
Expected Return=(Price^1-T-Price^T)/Price^T
=(25.2112-22.51)/22.51
12% Return
Benchmark:
The S&P 500 is the correct benchmark for this mutual fund because the mutual fund
consists of mostly large cap stocks that are included in the S&P 500 and would be an
excellent comparison since the primary goal of a mutual fund is to do better than the
market with the incorporation of the manager of the fund.
Top 10 Holdings (20.34% of Total Assets)
Company Symbol % Assets YTD Return %
Microsoft Corporation MSFT 2.71 N/A
Alphabet Inc. GOOGL 2.20 N/A
Costco Wholesale Corporation COST 2.08 N/A
JP Morgan Chase & Co. Common St JPM 2.04 N/A
Apple Inc. AAPL 2.03 N/A
Altria Group, Inc. MO 1.98 N/A
CVS Health Corporation Common S CVS 1.88 N/A
D/B/A Chubb Limited New Common CB 1.81 N/A
Mondelez International,Inc. MDLZ 1.81 N/A
NextEra Energy, Inc. Common Sto NEE 1.80 N/A
The current 10 top holdings represent 20.34% of the total assets, which is only about 1/5
of the overall mutual fund. Additionally, 2.71% is the maximum invested in one security
of the top holding Microsoft Corporation. This makes this mutual fund a well-diversified
portfolio based on unsystemic risk since the asset allocation is well diversified across
almost all sectors of the equities market. It is still involved with large cap securities.
Overall Portfolio Composition (%)
Cash: 8.19
Stocks: 90.88
Bonds: 0.00
Other: 0.93
The composition of the portfolio is primarily invested in the equities market with a few
cash reserves in case of a collapse in the equities market. However, in the future this
mutual fund may want to consider incorporating bonds into the portfolio in order to
further diversify the mutual fund.
Sector Weightings (%)
Sector HAIAX Category Avg
Basic Materials 2.68 3.00
Consumer
Cyclical
12.47 12.69
Financial
Services
13.83 15.32
Realestate 0.00 2.00
Consumer
Defensive
15.06 9.98
Healthcare 15.78 15.35
Utilities 5.18 2.58
Communication
Services
1.95 4.21
Energy 2.78 6.15
Industrials 16.02 11.63
Technology 14.25 17.08
The mutual fund is also widely diversified based on all of the market sectors with
healthcare being the majority of the mutual fund with 15.78% of the assets invested into
it. The only sector that is not included in the mutual fund is the real-estate sector. The
sectors that makeup the vast majority of the mutual fund are technology, industrials,
healthcare, consumer defensive, financial services, and consume cyclical. Compared to
the industry average for the different sector weightings my mutual fund is pretty
consistent except for including less technology and a greater number of consumer
defensive securities.
Fees & Expenses
Expense HAIAX Category Avg
Annual ReportExpense Ratio
(net):
0.92% 1.01%
Prospectus NetExpense
Ratio:
0.80% N/A
Prospectus Gross Expense
Ratio:
0.98% N/A
Max 12b1 Fee: 0.25% N/A
Max Front End Sales Load: 5.50% 5.30%
Max Deferred Sales Load: N/A 2.03%
3 Yr Expense Projection*: 828 458
5 Yr Expense Projection*: 1,045 725
10 Yr Expense Projection*: 1,670 1,484
The annual report expense ratio is at 0.92% slightly below the category average of
1.01%. The 12b1 or marketing fee is higher than the category average at 0.25. The front
end sales load is at 5.5%, which is higher than the category average of 5.3%. Since there
is a front end sales load there is obviously no deferred sales load. Overall, the expense
projections for the next 10 years are slightly higher than the category average.
Financial Ratios:
Risk (Modern Portfolio Theory) Statistics
3 Years
Statistic HAIAX Category
Alpha (against Standard Index) 3.18 -1.94
Beta (againstStandard Index) 0.93 1.00
Mean Annual Return 1.18 0.82
R-squared (againstStandard Index) 94.26 94.21
Standard Deviation 10.84 11.66
Sharpe Ratio 1.30 0.84
Treynor Ratio 15.55 9.63
5 Years
Statistic HAIAX Category
Alpha (againstStandard Index) 1.72 -2.03
Beta (againstStandard Index) 0.95 1.03
Mean Annual Return 1.07 0.84
R-squared (againstStandard Index) 96.13 95.16
Standard Deviation 11.80 12.87
Sharpe Ratio 1.08 0.78
Treynor Ratio 13.50 9.40
The Alpha ratio is substantially higher than the average for large blend mutual funds.
This means that the mutual fund is earning much higher returns than when compared to
the standard index. The Sharpe ratio is also higher than the category average, which
means that the fund is earning above average returns regards with regards to the beta of
the mutual fund. The Treynor ratio is often used by investors to determine the systemic
risk or standard deviation. The ratio is almost double the category average making this a
risky investment for this category of mutual funds, however the higher returns shown
above require additional risk, which is the primary reason why the Treynor ratio is
higher.
Comparison against Benchmark:
This chart is a direct comparison of the performance of the S&P500 and the Hartford
Core Equity A mutual fund since I first purchased the security on January 29, 2016.
As shown by the graph the lines had almost zero separation through the end of
February, however the S&P 500 has slightly outperformed the mutual fund since the
beginning of March up until present day. Overall, the mutual fund has yet to
outperform the index, however it is a long term investment that has added
significant diversification and been my most profitable security in my portfolio.
Daily Pricing:
As seen in the graph above the daily fluctuations are similar to how the beta reacts
to movements in the marketplace Also, since it is a mutual fund it is less subject to
extreme movements since it is a well diversified fund that helps to mitigate
unsystemic risk. The overall performance is positive, but it is currently on a
downward trend probably related to interest rates remaining flat.
Rational Assessment:
So far it has been the most profitable investment and is aimed towards long-term growth
and diversification. Mutual funds are typically a long term investment and it is possible
that the manager or the fund could have a down year and not beat the market, but overall
have a higher return based on long term growth. However, given the current performance
of my mutual fund so far I would say that it has been a good investment since it is greater
than my required rate of return. However, the mutual fund has failed to outperform the
benchmark. For the future this could be a good investment since the annualized return of
16.88% is greater than the average for most large cap securities of 12%.
8600
8800
9000
9200
9400
9600
9800
10000
10200
10400
10600
10800
1/29/2016 2/29/2016 3/31/2016
InvestmentValue
Day
Hartford Core Equity A
Value
Portfolio:
Investment value as of 1/29: $30,000
Portfolio Weights as of 1/29:
Under Armour Inc: 33.33%
Alphabet Inc: 33.33%
Hartford Core Equity A: 33.33%
Beta as of 1/29:
Under Armour Inc: 0.16
Alphabet Inc: 0.89
Hartford Core Equity A: 0.95
=0.16(1/3)+0.89(1/3)+0.95(1/3)
=0.6666
Investment value as of 4/29: $30005.31006
New Portfolio Weights as of 4/29:
Under Armour Inc: (10285.58052/$30005.31006)=34.28%
Alphabet Inc: (9297.694884/$30005.31006)=30.97%
Hartford Core Equity A: ($10422.03465/$30005.31006)=34.73%
Beta as of 4/29:
Under Armour: 0.078576
Alphabet Inc: 0.908401
Hartford Core Equity A: 0.93
=0.078576(.3428)+0.908401(.3097)+0.93(.3473)
=.6313
Compare the Beta for the Portfolio
Throughout the semester the overall risk level or beta has changed throughout the
semester as the weights of the investments changed daily since the investments were
priced daily. Overall the risk level of my portfolio has decreased since the beta of the
portfolio went from 0.6666 to 0.6313 at the end of the 3 months. A lower overall beta
means there will be less fluctuations with the overall value of my portfolio. However,
since the beta of Alphabet Inc. has increased throughout the semester it will be more
volatile and subject to further fluctuations in the future, but it should have less of an
impact on the value of my portfolio since the weight of the security decreased from
33.33% to 30.97%. On the other hand Under Armour had the beta almost cut in half
decreasing the fluctuations along with lower returns since there is a lower beta. It will
have a greater impact on the value of my portfolio and the return on it since the weight of
the security in the portfolio has increased from 33.3% to 34.28%. Hartford Core Equity A
saw a slight drop in the beta over the last 3 months indicating that the price will not
fluctuate as much as well as producing a lower return as a result. The mutual fund will
have a greater impact on the value of my portfolio since the weight of the security in my
portfolio has increased from 33.33% to 34.73%. Overall, for the portfolio as whole the
beta has decreased indicating there will be less fluctuations in the investment value of the
portfolio as well as a smaller return.
Overall the portfolio has not yielded much of a return as a whole and as of late it has been
trending downwards. The volatility of the portfolio reflects the securities within it and as
you can see initially there was greater volatility when the weights were all equal,
however now since Alphabet missed their earnings the price was dropped off and
decreased the overall weight of the security in my portfolio making my portfolio less
volatile since now Under Armour has a greater weight in the portfolio.
Portfolio Return v. the Benchmark
The S&P500 produced a return of 7.05% during the 3 month investment period of my
portfolio which is much greater than the 0.02% return that my portfolio yielded.
Therefore, overall I would say that there are better investments I should have made with
my $30,000 since I only ended up with about a $5 return for the semester. Alphabet hurt
the value of my portfolio and my return the most. Therefore, I would replace that security
with another one that fits my risk level and my required rate of return and would yield a
positive return on my investment. The relevance of the benchmark to my investment style
of large and mid-cap securities is the S&P 500 is a common benchmark for large cap
securities. My choices reflects this style since Alphabet is a large cap security, Under
Armour is a mid-cap security and Hartford Core Equity A is a mutual fund compromised
of mostly large cap securities.
Comparison of the Results of the Individual Investments
Hartford Core Equity A had the highest return for the semester with a 4.22% which is
16.88% annualized, followed by Under Armour had a return for the semester of 2.86%
which is 11.42% annualized, lastly Alphabet lost money with a negative return of -7.02%
which is annualized at -28.09%. The mutual fund outperformed all of my other
investments and based on the charts over the last 3 months had less price volatility than
Alphabet. Under Armour struggled for the majority of the semester, but then was turned
around by the positive earnings report on April 21st improving the intrinsic value of the
company. In contrast to Alphabet whom suffered greatly with the earnings report that
24000
25000
26000
27000
28000
29000
30000
31000
32000
33000
1/29/2016 2/29/2016 3/31/2016
PortfolioValue
Day
Portfolio Value for 3 Months
Portfolio Value
missed the earnings targets taking positive investment for march and April and instead
yielded a negative return greater than any of the positive returns of Under Armour or the
Hartford Mutual Fund.
What Would I do differently?
First, of all I would choose my securities differently starting with the required rate of
return I would have to figure out what securities could achieve this return that are in my
beta range. Given my low beta I would probably change my investment style to investing
in large cap stocks that pay dividends. While Alphabet and the Mutual Fund fall within
this general range I firmly believe that Under Armour has too low of a beta for me to pick
it all over again as a security for my portfolio with equal weights with $10,000 invested
in each one. Also, with the mutual fund and find one that does not have a front end sales
load fee since it immediately takes away from the money the investor is investing. On the
other hand Alphabet would probably be excluded from my portfolio as well since the
extremely high price as the start of the semester could be too high based on the empirical
evidence from the results these past 3 months. Given my low beta another way for me to
increase the return on my investment would be to invest with securities that yielded a
dividend since my beta is pretty low at 0.8.
I would do all of the research prior to investing in any security that is presented in this
paper before investing in anything. The research is available to the public it is just a
matter of being able to read it and interpret what it truly means through the analysis of the
financial statements, financial ratios, beneficial owners, short interest, and projecting the
income statements. All of this information and research will be vital to determine if there
is growth for the security and could help determine the potential intrinsic value of the
security that would indicate when it is appropriate to buy or sell the security. Since my
new strategy would incorporate choosing stocks with dividends. First I would determine
the dividend growth rate. Then I would find out the sustainable growth rate. Next I would
determine if the sustainable growth rate was less than the growth rate. If the growth rate
was greater than the sustainable growth rate I would have to use the sustainable growth
rate. Then if the discount rate was less than the growth rate then I would use the dividend
discount model as useful tool in determining the intrinsic value of the stock. However if
the growth rate was greater than the discount rate I would use the residual income model.
Then I could find out if this is higher or lower than the current stock price and if the
intrinsic value meets my required rate of return then it would indicate a good time to
purchase the security.
Works Cited
http://finance.yahoo.com/echarts?s=UA+Interactive#{"customRangeStart":1454043600,"customRa
ngeEnd":1460001600,"range":"custom","allowChartStacking":true}
http://finance.yahoo.com/news/alphabet-stock-slips-results-brokerages-141130061.html
http://finance.yahoo.com/news/under-armour-reiterates-outlook-2016-133000339.html
https://finance.yahoo.com/news/google-mulls-bid-yahoos-core-193106102.html
http://finance.yahoo.com/echarts?s=GOOGL+Interactive#{"customRangeStart":1454043600,"custo
mRangeEnd":1460001600,"range":"custom","allowChartStacking":true}
http://finance.yahoo.com/echarts?s=HAIAX+Interactive#{"customRangeStart":1454043600,"custo
mRangeEnd":1460001600,"range":"custom","allowChartStacking":true}
https://abc.xyz/investor/pdf/20151231_alphabet_10K.pdf
http://investor.underarmour.com/secfiling.cfm?filingID=1336917-16-64&CIK=1336917
http://finance.yahoo.com/news/under-armour-reports-first-quarter-110000033.html

Investment Analysis

  • 1.
    Memorandum To: Professor JohnFinnigan From: Thomas Lake Date: May 4, 2016 Subject: Investment Analysis _______________________________________________________________________ Attached please find the investment analysis paper, which is due on as an assignment in Bus 420 N, Investment Analysis. The work and writing presented in this assignment unless specifically specified in appropriately cited footnote, endnote, or reference is solely ours.
  • 2.
    Table of Contents: Part1: Investment Style Part 2: Under Armour Section Alphabet Section Hartford Core Equity A Section Part 3: Portfolio Section
  • 3.
    Executive Summary: The projectpresented in this paper incorporates a fake investment portfolio of $30,000 to invest in 3 different securities of equal weight starting with $10,000 in each investment with two of the securities being US common stocks and the other one is a mutual fund. Over the course of the semester the companies may pay dividends to their investors, release their quarterly earnings, and release their annual statements if their fiscal year is December 31st. The closing prices were to be kept track of daily and the short interest for the week and the investments were to be compared to a benchmark as one way of measuring your success to comparable returns on appropriate indexes. First and the most important step before making any type of investment is to take a risk assessment test to determine how much risk you are comfortable with in your portfolio and investments as a whole. Then based off this beta the next step was to calculate the required rate of return using the CAPM formula. The investments that were chosen were supposed to be comparable to the beta of your portfolio determined from the risk assessment test. Additionally, the projected return on the investment based on the 1 year target price had to be greater than the required rate of return in order for the investment to make any sense at all. The financial statements were to be thoroughly analyzed and the investment values were to be tracked throughout the semester and compared to a benchmark. Over the course I learned how useful the notes to the financial statements are to determine all the changes from year to year. One major important thing that is clearly evident of this project is that past performance does not guarantee future success especially with choosing an individual stock security. The company specific risk is evident with the release of earnings as it had a dramatic impact on the price of one of my securities. I was able to observe firsthand how different betas affect the volatility of a security differently. It is completely irrational and unnecessarily risky to invest in securities without doing any research and as you start to piece together the analysis you begin to notice some common trends across all of the analysis. The financials of Under Armour appeared stronger with more room for growth than Alphabet and was further demonstrated by the release of the earnings report for the first quarter of 2016 on April 21st. Also, it is quite evident that picking a mutual fund or even something similar such as an ETF is much easier than selecting an individual stock that is extremely vulnerable to company specific risk such as stopping the production of a certain product could hurt earnings and the intrinsic value of the security. However, the diversification is a way to eliminate the systemic risk if the mutual fund is properly diversified. Diversification is important for all portfolios and it does not matter how old you are or how much money you have to invest. An investor should never put all of their eggs in one basket. It is ok for something in your portfolio to underperform or even suffer losses as long as the loss is mitigated by the gains on your investments. The most important indicator of diversification is the correlation between securities since they should never move exactly the same. Discipline is extremely important since depending on the volatility of the stock there is no reason to overreact to fluctuations and lock yourself in a loss as long as the security is fundamentally sound based on your analysis.
  • 4.
    Investment Style I intendto accomplish a well-diversified portfolio that helps me accomplish my financial goals. My attitude towards risk is to invest in the amount of risk I am comfortable taking on with the potential for long-term growth by having my investment strategy be to invest in mid cap and large cap growth stocks that fit my beta of 0.8. Although the temporary fluctuations may not be favorable it is important to not overreact and liquidate my shares based on a bad performance day or week. A growth investing style that I want to pursue favoring stocks of companies that are producing above average earnings and profits. That is why my investing style that favors capital gains instead of dividends to reinvest their earnings into the business including capital projects or research and development. My required return based on the portfolio beta is 9.986% based on my calculations with the risk free rate of the 10 year T-bill being 1.93%, and an estimate return on the large stocks is typically 12%. My beta was calculated by determined based on my risk assessment score to be 0.8. This was slightly below my beta calculated based on the risk assessment test and given it is the first I will be investing I am comfortable with that beta. This was my calculations for the require rate of return on my portfolio based on my beta and My selections reflect my attitude towards risk and the required return that I have already discussed by investing in a mid-cap, and large cap stocks that do not pay out dividends. Calculated as: CAPM: 𝑅 𝑟 = 𝑅𝑓 + (𝑅 𝑚 − 𝑅𝑓)𝛽 1.93%+0.8(12%-1.93%) =9.986%. Investment Choice I have chosen to invest in Under Armour (UA), Alphabet Inc. (GOOGL), and Hartford Core Equity A (HAIAX) to complete my investment portfolio.
  • 5.
    Under Armour, Inc. SecurityName: Under Armour, Inc. Ticker: UA Exchange: NYSE Closing Price as of 1/29: $85.43 Quantity purchased on 1/29: 117.0548987 shares Value of Investment on 1/29: $10,000 Closing Price as of 4/29: $43.94 2 for 1 stock split: 117.0548987 shares*2= 234.0823970037 Current Value of Investment as of 4/29: 10285.58(2.86% return) Annual Return: 11.42% Security Profile- Under Armour, Inc., together with its subsidiaries, develops, markets, and distributes branded performance apparel, footwear, and accessories for men, women, and youth primarily in North America, Europe, the Middle East, Africa, the Asia-Pacific, and Latin America. The company offers its apparel in compression, fitted, and loose types to be worn in hot, cold, and in between the extremes. It offers various footwear products, including football, baseball, lacrosse, softball and soccer cleats, slides, and performance training, running, basketball, and outdoors footwear. The company also provides accessories, which include headwear, bags, and gloves. Financial Year End: Dec 31 Beta: 0.16 Sector: Consumer Goods Industry: Textile Apparel Clothing Position in the Industry: Leader Reasonfor Selection: Under Armour offers the diversification of the retail market instead of solely focusing my stock investments on the technology sector. They also fit my portfolio as a growth mid cap security. Expected Return: Expected Return= (Price^1-T-Price^T)/Price^T ($100.23-$85.43)/$85.43=17.3241250146% The one-year target estimate for Under Armour is $100.23. This gives me an annual return of 17.3241%.
  • 6.
    Ratios: The ratios thatare most important are the quick ratio, debt to equity, revenue growth, the EBIT margin %, return on assets, return on invested capital, return on equity, average day sales outstanding, average days inventory outstanding, average days payable outstanding, average cash conversion cycle, and inventory turnover. These ratios are important because the retail industry is heavily reliant upon sales and inventory turnover. Benchmark: The S&P 500 would be the correct benchmark for Under Armour to compare its performance against for a couple of simple reasons. These reasons are Under Armour is incorporated into the S&P 500 and its competitors in the textile apparel industry are included in it as well.
  • 7.
    Under Armour Inc(UA US) Income Statement In Millions of USD except Per Share FY 2015 FY 2014 FY 2013 12 Months Ending 12/31/2015 Percent +/- 12/31/2014 Percent +/- 12/31/2013 Revenue 3,963.3 28.50% 3,084.4 32.26% 2,332.1 + Sales & Services Revenue 3,963.3 28.50% 3,084.4 32.26% 2,332.1 - Cost of Revenue 2,057.8 30.89% 1,572.2 31.52% 1,195.4 + Cost of Goods & Services 2,057.8 30.89% 1,572.2 31.52% 1,195.4 Gross Profit 1,905.5 26.01% 1,512.2 33.04% 1,136.7 + Other Operating Income 0.0 0% 0.0 0% 0.0 - Operating Expenses 1,490.2 28.66% 1,158.3 32.89% 871.6 + Selling, General & Admin 1,490.7 28.70% 1,158.3 32.89% 871.6 + Research & Development 0.0 0% 0.0 0% 0.0 + Other Operating Expense -0.5 -100% 0.0 0% 0.0 Operating Income (Loss) 415.4 17.36% 354.0 33.52% 265.1 - Non-Operating (Income) Loss 21.9 86.14% 11.7 186.11% 4.1 + Interest Expense, Net 14.6 174.19% 5.3 81.90% 2.9 + Foreign Exch (Gain) Loss 0.0 0% 0.0 0% 0.0 + (Income) Loss from Affiliates — #VALUE! 0.0 0% 0.0 + Other Non-Op (Income) Loss 7.2 12.85% 6.4 446.93% 1.2 Pretax Income (Loss), Adjusted 393.5 15.00% 342.2 31.12% 261.0 - Abnormal Losses (Gains) 6.8 100% 0.0 0% 0.0 + Merger/Acquisition Expense 6.3 100% — #VALUE! — + Disposal of Assets 0.5 100% — #VALUE! — Pretax Income (Loss), GAAP 386.7 13.00% 342.2 31.12% 261.0 - Income Tax Expense (Benefit) 154.1 14.86% 134.2 35.99% 98.7 + Current Income Tax 158.2 4.50% 151.3 28.30% 118.0 + Deferred Income Tax -4.0 76.48% -17.2 11.01% -19.3 + Tax Allowance/Credit — #VALUE! 0.0 0% 0.0 Income (Loss) from Cont Ops 232.6 11.79% 208.0 28.16% 162.3 - Net Extraordinary Losses (Gains) 0.0 0% 0.0 0% 0.0 + Discontinued Operations 0.0 0% 0.0 0% 0.0
  • 8.
    + XO &Accounting Changes 0.0 0% 0.0 0% 0.0 Income (Loss) Incl. MI 232.6 11.79% 208.0 28.16% 162.3 - Minority Interest 0.0 0% 0.0 0% 0.0 Net Income, GAAP 232.6 11.79% 208.0 28.16% 162.3 - Preferred Dividends 0.0 0% 0.0 0% 0.0 - Other Adjustments 0.0 0% 0.0 0% 0.0 Net Income Avail to Common, GAAP 232.6 11.79% 208.0 28.16% 162.3 Net Income Avail to Common, Adj 237.0 13.93% 208.0 28.16% 162.3 Net Abnormal Losses (Gains) 4.5 100% 0.0 0% 0.0 Net Extraordinary Losses (Gains) 0.0 0% 0.0 0% 0.0 Basic Weighted Avg Shares 215.5 1.07% 213.2 1.20% 210.7 Basic EPS, GAAP 1.08 10.20% 0.98 27.27% 0.77 Basic EPS from Cont Ops 1.08 10.20% 0.98 27.27% 0.77 Basic EPS from Cont Ops, Adjusted 1.10 12.23% 0.98 27.27% 0.77 Diluted Weighted Avg Shares 220.9 0.68% 219.4 1.58% 216.0 Diluted EPS, GAAP 1.05 10.53% 0.95 26.67% 0.75 Diluted EPS from Cont Ops 1.05 10.53% 0.95 26.67% 0.75 Diluted EPS from Cont Ops, Adjusted 1.07 12.65% 0.95 26.67% 0.75 Income Analysis: Revenue Analysis The income statement begins with revenue and it is clear that revenue has increased over 50% over the last 3 years. The increase in net sales was driven primarily by apparel unit sales growth and new offerings in multiple lines led by training, golf; and footwear growth unit sales growth, led by running and basketball and the expansion of footwear offerings globally. License revenue increased from $67.2 million in 2014 to $84.2 million in 2015 a 25% increase. This increase was primarily driven by increased distribution on officially licensed products in North America and Japan. Connected Fitness revenue increased $34.2 million or 177.8% to $53.4 million in 2015 from $19.2 million in 2014 primarily driven by the acquisitions for the connected fitness business in the first quarter 2015 and overall revenue growth in the connected fitness business segment. This was the
  • 9.
    primary source forthe increase in sales because of the recognition of the benefits of the healthy lifestyle benefiting the connected fitness segment. The connected fitness business segment consists of digital advertising, digital fitness platform licenses, and subscriptions for the connected fitness business segment. The Under Armour Connected Business Platform provides the world’s largest digital health and fitness community changing the way athletes train, perform, and live. Gross Profit increased to $393.3 million to $1,905.5 million in 2015 from $1,512.2 million in 2014. Gross Profit as a percentage of net revenue decreased by 90 basis points to 48.1% in 2015 compared to 49% in 2014. The cause of the decrease was negative 70 basis points from the strengthening US dollar, 30 basis points decrease from increased inbound airfreight costs, 30 basis point decrease from sales mix, and 20 basis point decrease from increased liquidation in both apparel and footwear. The above basis point decreases were offset by a 60 basis point increase from favorable product input costs throughout the world that is expected to continue in 2016. Expense Analysis Operating expenses have increased by over 60% the past 3 years. Selling, general, and administrative expenses increased to 338.7 million to 1,497.0 million in 2015 from 1,158.3 million in 2014. As a percentage of net revenue, selling general and administrative revenues went up to 37.8% from 37.5% in 2014. The causes of these changes were due to the fact that marketing costs increased to $84.8 million to $417.8 million in 2015 compared to 2014 when it was $333 million. Marketing costs increased because key marketing campaigns and increases in sponsorships including Steph Curry, Jordan Spieth, and Cam Newton. Other costs increased $235.9 million to $1,079.2 million in 2015 compared to $825.3 million in 2014. These costs shot up because higher personnel and other costs incurred for the expansion of the direct distribution channel, which includes more investments for the company owned stores. Another reason for the increase is the Connected Fitness platform. When taken as a percentage of net revenue other cots increased to 27.2% from 26.8% in the past fiscal year. Income from operations increased $54.5 million or 15.4% from 2014 to 2015. Income from operations as a percent of net revenue is 10.3% in 2015 down from 11.5% in 2014. Interest expense increased to $14.6 million in 2015 compared to $5.3 million the previous year. It went up because of higher term loan and revolving credit facility borrowings in order to pay for the two connected fitness acquisitions. Other expense net increased 0.8 million to 7.2 million in 2015 because of higher net losses on foreign currency exchange rates. Provision for income taxes increased 19.9 million in 2015 to 154.1 million because of the effective tax in 2015 was 39.9% compared to 2014 when it was 39.2%. The effective tax increased since there were more non-deductible costs because of the two Connected Fitness acquisitions of Endomondo and MyFitnessPal.
  • 10.
    Under Armour Inc(UA US) - Balance Sheet In Millions of USD except Per Share FY 2015 FY 2014 FY 2013 12 Months Ending 12/31/2015 Percent+/- 12/31/2014 Percent +/- 12/31/2013 Total Assets + Cash, Cash Equivalents & STI 129.9 -78.11% 593.2 70.70% 347.5 + Cash & Cash Equivalents 129.9 -78.11% 593.2 70.70% 347.5 + ST Investments 0.0 0% 0.0 0% 0.0 + Accounts & Notes Receiv 433.6 54.96% 279.8 33.29% 210.0 + Accounts Receivable, Net 433.6 54.96% 279.8 33.29% 210.0 + Notes Receivable, Net 0.0 0% 0.0 0% 0.0 + Inventories 783.0 45.89% 536.7 14.44% 469.0 + Other ST Assets 152.2 9.00% 139.7 36.45% 102.4 + Derivative & Hedging Assets 3.8 100% 0.0 0% 0.0 + Deferred Tax Assets 0.0 -100.00% 52.5 36.80% 38.4 + Misc ST Assets 148.4 70.28% 87.2 36.24% 64.0 Total Current Assets 1,498.8 -3.27% 1,549.4 37.26% 1,128.8 + Property, Plant & Equip, Net 538.5 76.24% 305.6 36.44% 224.0 + Property, Plant & Equip 831.8 59.23% 522.4 31.88% 396.1 - Accumulated Depreciation 293.2 35.25% 216.8 25.96% 172.1 + LT Investments & Receivables 0.0 0% 0.0 0% 0.0 + Other LT Assets 831.6 246.33% 240.1 6.73% 225.0 + Total Intangible Assets 660.9 342.09% 149.5 2.15% 146.3 + Goodwill 585.2 374.77% 123.3 0.83% 122.2 + Other Intangible Assets 75.7 188.55% 26.2 8.85% 24.1 + Deferred Tax Assets 92.2 174.52% 33.6 7.96% 31.1 + Derivative & Hedging Assets 0.0 0% 0.0 0% 0.0 + Misc LT Assets 78.6 37.71% 57.1 20.03% 47.5 Total Noncurrent Assets 1,370.1 151.09% 545.7 21.55% 448.9 Total Assets 2,868.9 36.93% 2,095.1 32.79% 1,577.7 Liabilities& Shareholders' Equity + Payables & Accruals 393.4 9.85% 358.1 19.70% 299.2 + Accounts Payable 200.5 -4.74% 210.4 27.18% 165.5 + Accrued Taxes — 0% — 0% 0.0
  • 11.
    + Interest &Dividends Payable — 0% — 0% 0.0 + Other Payables & Accruals 192.9 30.64% 147.7 10.43% 133.7 + ST Debt 42.0 45.07% 29.0 - 72.42% 105.0 + ST Borrowings 0.0 0% 0.0 - 100.00 % 100.0 + ST Capital Leases 0.0 0% 0.0 0% 0.0 + Current Portion of LT Debt 42.0 45.07% 29.0 482.28 % 5.0 + Other ST Liabilities 43.4 25.61% 34.6 53.80% 22.5 + Deferred Revenue 0.0 0% 0.0 0% 0.0 + Derivatives & Hedging 0.0 0% 0.0 0% 0.0 + Misc ST Liabilities 43.4 25.61% 34.6 53.80% 22.5 Total Current Liabilities 478.8 13.56% 421.6 -1.17% 426.6 + LT Debt 627.0 145.64% 255.3 432.31 % 48.0 + LT Borrowings 627.0 145.64% 255.3 432.31 % 48.0 + LT Capital Leases 0.0 0% 0.0 0% 0.0 + Other LT Liabilities 94.9 39.70% 67.9 36.34% 49.8 + Accrued Liabilities 0.0 0% 0.0 0% 0.0 + Pension Liabilities 0.0 0% 0.0 0% 0.0 + Pensions 0.0 0% 0.0 0% 0.0 + Other Post-Ret Benefits 0.0 0% 0.0 0% 0.0 + Deferred Revenue 0.0 0% 0.0 0% 0.0 + Derivatives & Hedging 1.5 100% 0.0 0% 0.0 + Misc LT Liabilities 93.4 37.50% 67.9 36.34% 49.8 Total Noncurrent Liabilities 721.9 123.38% 323.2 230.57 % 97.8 Total Liabilities 1,200.7 61.21% 744.8 42.03% 524.4 + Preferred Equity 0.0 0% 0.0 0% 0.0 + Share Capital & APIC 636.7 25.23% 508.4 27.96% 397.3
  • 12.
    + Common Stock0.1 1.41% 0.1 102.86 % 0.0 + Additional Paid in Capital 636.6 25.23% 508.4 27.96% 397.3 - Treasury Stock 0.0 0% 0.0 0% 0.0 + Retained Earnings 1,076.5 25.66% 856.7 31.02% 653.8 + Other Equity -45.0 -203.98% -14.8 - 774.93 % 2.2 Equity Before Minority Interest 1,668.2 23.54% 1,350.3 28.19% 1,053.4 + Minority Interest 0.0 0% 0.0 0% 0.0 Total Equity 1,668.2 23.54% 1,350.3 28.19% 1,053.4 Total Liabilities& Equity 2,868.9 36.93% 2,095.1 32.79% 1,577.7 Balance Sheet Analysis: Current Assets: Cash and cash equivalents went down significantly by 78.11% because of the acquisition to acquire Endomondo and MyFitnessPal in the first quarter of 2015. Accounts receivable had an increase of 90.8 million in 2015 when in comparison to 2014 because of shipping time. In 2014 Accounts receivable increased $65.1 million in 2014 as compared to 2013, because there was a higher proportion of sales to international customers with lengthier payment terms compared to the 2013. Long Term Assets: Net Property Plant, and Equipment increased 76.24% in 2015 and 36.44% in 2014 because of the expansion of their offices in Baltimore. Other long-term assets increased in 2015 in part due to goodwill increasing by 374.77% resulting from the acquisition of Endomondo and MyFitnessPal during 2015. Goodwill is associated with the acquisition of a company as well as the intangible assets, which is the primary reason why they went up significantly in 2015 when compared to 2014. Current Liabilities: In March 2015 a term loan of $150 million was issued. In January of 2016, another term loan was issued of $138.8 million in order to repay the term loan from 2015 decreasing short-term debt obligations and short-term debt.
  • 13.
    Long Term Liabilities: InMay 2014, Under Armour entered into a long-term $650 million credit agreement for both revolving credit facility borrowings and term loan borrowings with a term of 5 years ending in May 2019. In March 2015 there was an amendment to the original agreement where there was an additional $150 million of term loan borrowings that made a total aggregate loan borrowings of $350 million and increased the credit facility agreements from $650 million to $800 million. At the end of the physical year of 2015 Under Armour had $275 million of revolving borrowings and $525 million remaining availability. Equity: On March 17, 2014, the Board of Directors declared a two-for-one stock split of the Company's Class A and Class B common stock, which was effected in the form of a 100% common stock dividend distributed on April 14, 2014. Stockholders' equity and all references to share and per share amounts in the accompanying consolidated financial statements have been retroactively adjusted to reflect the two-for-one stock split for all periods presented. On January 5, 2015, the Company acquired 100% of the outstanding equity of Endomondo ApS (“Endomondo”), a Denmark-based digital connected fitness company. On March 17, 2015, the Company acquired 100% of the outstanding equity of MyFitnessPal, Inc. (“MFP”), a digital nutrition and connected Fitness Company. Both companies were acquired to expand the Under Armour Connected Fitness community. The purchase price allocation for each acquisition is reflected in the consolidated balance sheet as of December 31, 2015.
  • 14.
    Under Armour Inc(UA US) - Statement of Cash Flows In Millions of USD except Per Share FY 2015 FY 2014 FY 2013 12 Months Ending 12/31/2015 Percent+/- 12/31/2014 Percent+/- 12/31/2013 Cash from Operating Activities + Net Income 232.6 11.79% 208.0 28.16% 162.3 + Depreciation & Amortization 100.9 40.01% 72.1 42.62% 50.5 + Non-Cash Items 130.2 70.09% 76.6 88.92% 40.5 + Stock-Based Compensation 60.4 18.82% 50.8 17.66% 43.2 + Deferred Income Taxes -4.4 74.83% -17.6 6.63% -18.8 + Other Non-Cash Adj 74.3 71.39% 43.4 167.89% 16.2 + Chg in Non-Cash Work Cap -507.9 -268.87% -137.7 -3.25% -133.3 + (Inc) Dec in Accts Receiv -191.9 -89.87% -101.1 -181.03% -36.0 + (Inc) Dec in Inventories -278.5 -229.00% -84.7 46.04% -156.9 + Inc (Dec) in Accts Payable -22.6 -145.96% 49.1 235.59% 14.6 + Inc (Dec) in Other -14.9 - 1250.54 % -1.1 -102.46% 44.9 + Net Cash From Disc Ops 0.0 0% 0.0 0% 0.0 Cash from Operating Activities -44.1 -120.14% 219.0 82.42% 120.1 Cash from Investing Activities + Change in Fixed & Intang -298.9 -112.72% -140.5 -60.00% -87.8 + Disp in Fixed & Intang 0.0 0% 0.0 0% 0.0 + Disp of Fixed Prod Assets 0.0 0% — 0% — + Disp of Intangible Assets 0.0 0% 0.0 0% 0.0 + Acq of Fixed & Intang -298.9 -112.72% -140.5 -60.00% -87.8 + Acq of Fixed Prod Assets -298.9 -112.72% -140.5 -60.00% -87.8 + Acq of Intangible Assets 0.0 0% 0.0 0% 0.0 + Net Change in LT Investment 0.0 0% 0.0 0% 0.0 + Dec in LT Investment 0.0 0% 0.0 0% 0.0 + Inc in LT Investment 0.0 0% 0.0 0% 0.0 + Net Cash From Acq & Div -539.5 - 4838.30 % -10.9 92.62% -148.1
  • 15.
    + Cash fromDivestitures 0.0 0% 0.0 0% 0.0 + Cash for Acq of Subs -539.5 - 4838.30 % -10.9 92.62% -148.1 + Cash for JVs 0.0 0% 0.0 0% 0.0 + Other Investing Activities -9.1 -956.63% -0.9 60.46% -2.2 + Net Cash From Disc Ops 0.0 0% 0.0 0% 0.0 Cash from Investing Activities -847.5 -456.41% -152.3 36.03% -238.1 Cash from Financing Activities + Dividends Paid 0.0 0% 0.0 0% 0.0 + Cash From (Repayment) Debt 384.8 193.12% 131.3 38.88% 94.5 + Cash From (Repay) ST Debt 0.0 100.00% -100.0 -200.00% 100.0 + Cash From LT Debt 650.0 160.00% 250.0 100% — + Repayments of LT Debt -265.2 - 1316.53 % -18.7 -242.20% -5.5 + Cash (Repurchase) of Equity 56.2 6.61% 52.7 63.46% 32.3 + Increase in Capital Stock 56.2 6.61% 52.7 63.46% 32.3 + Decrease in Capital Stock 0.0 0% 0.0 0% 0.0 + Other Financing Activities -0.9 44.72% -1.7 - 100% 0.0 + Net Cash From Disc Ops 0.0 0% 0.0 0% 0.0 Cash from Financing Activities 440.1 141.40% 182.3 43.78% 126.8 Effect of Foreign Exchange Rates -11.8 -253.85% -3.3 -7.26% -3.1 Net Changes in Cash -463.3 -288.58% 245.7 4249.96 % 5.6 Cash Paid for Taxes 99.7 -3.46% 103.3 20.70% 85.6 Cash Paid for Interest 11.2 169.56% 4.1 175.48% 1.5
  • 16.
    Cash Flow Analysis: OperatingActivities: Cash flows from operations decreased to $263.1 million to $44.1 million in 2015 from $219 million provided by operations in 2014. The decrease in cash from operating activities was driven by a decrease in cash flows from operating assets of $370.1 million and it was offset by adjustments to non-cash items which increased 82.5 million as well as an increase in net income of 24.5 million from the previous year. These were caused by an increase in inventory investments of $193 million because of early deliveries of products to ensure they met seasonal floor set dates and it also included the automated inventory replenishment system as well. There was also a large increase in accounts receivable of 90.8 million because of the shipping time. Adjustments to net income for non-cash items increased in 2015 since there were higher depreciation and amortization expenses. During 2014 cash from operating activities increased to $98.9 million. It went up because adjustments to net income of non-cash items increased 57.5 million and increase of net income of 45.7 million was offset by a decrease in cash flows from operating assets and liabilities of $4.3 million. In 2014 there was a decrease in inventory investments of $72.2 million since there was early deliveries of products for seasonality purposes and incremental inventory investments in 2013. Investing Activities: Cash from investing activities increased $695.2 million in 2015 to $847.5 million because of the acquisitions of MyFitnessPal and Endomondo during the first quarter of 2015 and capital expenditures to improve corporate headquarters and invest in the new SAP platform. Cash used in investing activities decreased $85.8 million to $152.3 million in 2014. The decrease was caused by the acquisition of MapMyFitness in the prior year and was somewhat offset by increased capital expenditures expansion of corporate headquarters, SAP platform and retail store build outs. Financing Activities: Cash provided from financing activities increased $257.8 million to $440.1 million in 2015 from $182.3 million in 2014. It increased because of the amended credit agreement providing $650 million in term loans and revolving credit facility proceeds in 2015 counterbalanced by payments of $261.3 million. Financing activities in 2014 increased $55.5 million to $182.3 million because of $150 million in net borrowings under the new credit facility in 2014, however when it was compared to 2013 there was $100 million of borrowings under the revolving credit facility. On March 17, 2014, the Board of Directors declared a two-for-one stock split of the Company's Class A and Class B
  • 17.
    common stock, whichwas effected in the form of a 100% common stock dividend distributed on April 14, 2014. Finding a Sustainable Growth Rate: Formula=g=ROE (1- Payout ratio) Under Armour 2015 ROE=15.41 2015 Payout Ratio=0 G=15.41% Residual Income Model: For the residual Income I used the last price before the split $85.97 CAPM: 𝑅 𝑟 = 𝑅𝑓 + (𝑅 𝑚 − 𝑅𝑓) ∗ 𝛽 1.93 %+( 12%-1.93%) (0.16) =3.5412% 𝑷 𝟎 = 𝑩 𝟎 + (𝑬𝑷𝑺 𝟎 ∗ ( 𝟏 + 𝒈) − 𝑩 𝟎 ∗ 𝒌)/(𝒌− 𝒈) 85.97=7.72+ (1.05*(1+g)-7.72*0.035412)/ (0.035412-g) g =6.81% Revenue Growth Analysis: Year Revenue Revenue Growth% Change 2015 $ 3,963.30 $ 878.90 28.50% 2014 $ 3,084.40 $ 752.30 32.26% 2013 $ 2,332.10 $ 497.20 27.10% 2012 $ 1,834.90 $ 362.20 24.59% 2011 $ 1,472.70 GeometricAverage 27.98% Revenue growth gives us a good idea of how the company’s sales have growth over the past 5 years. This table demonstrates how revenue growth has a 5 year geometric growth of 27.98%. Sales seem to be increasing exponentially that is to be expected from a growth company and it is greater than the sustainable growth rate since they have issued debt to finance their growth.
  • 18.
    Gross Profit GrowthAnalysis: Year Gross Profit Gross ProfitGrowth % Change 2015 $ 1,905.50 $ 393.30 26.01% 2014 $ 1,512.20 $ 375.50 33.03% 2013 $ 1,136.70 $ 257.40 29.27% 2012 $ 879.30 $ 166.50 23.36% 2011 $ 712.80 GeometricAverage 27.69% The gross profit margin is well above 25% it appears to indicate high profits from Under Armour. This is greater than the sustained growth rate because Under Armour has issued debt financing to further the growth of the company, however the growth appears to have slowed down according to the gross profit growth over the past year. Net Income Growth Analysis: Year NetIncome NetIncome Growth % Change 2015 $ 237.00 $ 29.00 13.94% 2014 $ 208.00 $ 45.70 28.16% 2013 $ 162.30 $ 33.90 26.40% 2012 $ 128.40 $ 31.50 32.51% 2011 $ 96.90 GeometricAverage 24.09% Net income growth has been slowed down in recent years as the percentages have gone down a lot recently especially between 2014 and 2015 the net income growth was almost cut in half. The geometric growth average is a healthy average for the past 5 years, however the recent decrease where the growth was cut in half is cause for concern. The primary reason for this is the increase in the amount of debt financing issued by the company to facilitate the further growth of the company and it is the reason the geometric average over the last 5 years is greater than the sustainable growth rate.
  • 19.
    Projected Income Statement: UnderArmourInc (UALUS) Projected -Income Statement Column1 Column2 In Millionsof USDexceptpershare 12 monthsending 12/31/16 12/31/15 Revenue $5,072.23 $3,963.30 - Cost of Revenue $2,633.57 $2,057.80 Gross Profit $2,438.66 $1,572.20 - Operating Expenses $1,907.16 $1,490.20 + Selling, General & Admin $1,907.80 $1,490.70 + Research & Development $- $- + Other Operating Expense $-0.64 $-0.50 Operating Income (Loss) $531.50 $415.50 - Non-Operating (Income) Loss $21.90 $21.90 + Interest Expense, Net $14.60 $14.60 + Other Non-Op (Income) Loss $7.20 $7.20 Pretax Income (Loss), Adjusted $487.80 $393.50 - Income Tax Expense (Benefit) $194.63 $154.10 Income (Loss) from Cont Ops $293.17 $232.60 Net Income, GAAP $293.17 $232.60 Basic Weighted Avg Shares $215.50 $215.50 Basic EPS, GAAP $1.36 $1.08 Projections In order to make my projections for 2016 I increased the revenue, cost of goods sold (cost of revenue), the operating expenses, the pre-tax income, and the EPS. For the revenue I took the 5 year geometric average for revenue growth and then I took the percentage of cost of goods sold to revenue from the previous year and multiplied it by the new projected revenue to project the cost of revenue. All extraordinary items or non-recurring income was excluded from the projections. All of the non-operating income expenses were held at their current levels since they are fixed costs unlike the cost of goods sold. I used the previous year tax rate of 39.9% to project the income tax expense. Then I took the new net income and divided it by the basic weighted share outstanding from the previous year to find the new EPS.
  • 20.
    Financial Ratios Profitability ROA: Ticker CompanyColumn22 Column3 Column4 Column5 Column6 2015 2014 2013 2012 2011 UA US Equity UnderArmour Inc 9.37 11.33 11.87 12.40 12.16 COLM US EQUITY ColumbiaSportswear Corp 9.58 8.07 6.16 7.03 7.73 ADDYY US Equity Adidas AG 4.92 4.08 6.77 4.60 5.61 NKE US EQUITY Nike Inc 18.20 14.90 14.98 14.59 14.50 Under Armour is one of the leaders in return on assets only trailing Nike, an established value stock. These differences exist since Nike is a value stock and Under Armour is still growing, although there was a slight drop in the ROA last year for Under Armour. However, the net income has been increasing steadily and the asset turnover ratio is consistent with its competitors. Under Armour has purchased more assets and investing for the future and it is the reason the return on assets has slightly declined. ROE: Ticker Company Column22 Column3 Column4 Column5 Column6 2015 2014 2013 2012 2011 UA US Equity UnderArmour Inc 15.41 17.31 17.36 17.67 17.10 COLM US EQUITY ColumbiaSportswear Corp 12.71 10.60 7.82 8.91 9.97 ADDYY US Equity Adidas AG 11.23 8.82 14.58 10.08 12.57 NKE US EQUITY Nike Inc 30.64 24.59 23.04 21.98 21.77 Under Armour has consistently maintained the second best ROE ratio amongst its competitors although it slightly dropped the last fiscal year. Nike has a healthy advantage over the competition. The ROE isn’t too much higher than the ROA, which bodes well for Under Armour with their consistent profit margins and the fact that it did not require them to increase their financial leverage.
  • 21.
    ROIC: Ticker Company Column22Column3 Column4 Column5 Column6 2015 2014 2013 2012 2011 UA US Equity UnderArmour Inc 12.61 15.11 15.77 16.55 16.39 COLM US EQUITY ColumbiaSportswear Corp 13.24 10.82 7.78 8.97 9.90 ADDYY US Equity Adidas AG 9.46 8.38 12.25 8.68 10.53 NKE US EQUITY Nike Inc 25.86 22.46 21.21 21.94 20.35 Return on invested capital is the ability of the company to take the money they raise through investors and the return the investors receive on their capital. Nike is once again dominant in the industry for return on invested capital since a lot of their supply chain is outsourced from overseas manufacturing all the way up to distribution. It is concerning as an investor in Under Armour that their return on invested capital has steadily declined over the past 5 years with a significant drop in the last fiscal year. This is the opposite of the trend of the industry, which is concerning given the industry trend. The reason for this is Under Armour has opted for more debt financing recently giving them higher fixed costs unlike the competitors who are using less debt financing. Debt to Equity: Ticker Company Column22 Column3 Column4 Column5 Column6 2015 2014 2013 2012 2011 UA US Equity UnderArmour Inc 40.10 21.05 14.52 7.58 12.21 COLM US EQUITY ColumbiaSportswear Corp 1.20 1.16 - 0.01 - ADDYY US Equity AdidasAG 32.38 33.32 24.34 28.10 24.96 NKE US EQUITY Nike Inc 9.92 12.68 12.32 3.71 6.74 The increased issuance of debt has dramatically changed the corporate structure of Under Armour especially in the last year it changed 100%. Now 40% of the capital structure is composed of debt and it is common for the retail industry as seen with Adidas, however other companies such as Nike have been successful at maintaining low levels of debt. Under Armor has a greater level of debt giving them more financial leverage causing greater volatility in their earnings.
  • 22.
    Gross Profit Margin: TickerCompany 2015 2014 2013 2012 2011 UA US Equity Under Armour Inc 48.08 49.03 48.74 47.92 48.40 COLM US Equity Columbia Sportswear Corp 46.15 45.46 44.13 42.91 43.41 ADDYY US Equity Adidas AG 48.28 47.64 49.29 47.73 47.51 NKE US Equity Nike Inc 46.32 45.49 44.26 43.22 44.31 The Gross Profit margin has been relatively the same for Under Armour and it is one of the leaders so it should not be an issue going forward. Operating Margin: Ticker Company Column22 Column3 Column4 Column5 Column6 2015 2014 2013 2012 2011 UA US Equity UnderArmour Inc 10.31 11.48 11.37 11.37 11.05 COLM US EQUITY ColumbiaSportswear Corp 10.74 9.47 7.82 8.00 8.05 ADDYY US Equity Adidas AG 6.26 6.08 8.32 6.18 7.15 NKE US EQUITY Nike Inc 13.64 13.24 12.79 13.21 13.49 The operating margin is right in the middle of the pack of the industry where Nike is still clearly the leader in the industry with the greatest operating margin. Nike outsources a lot of their manufacturing and distribution processes while Under Armour is known for its direct distribution channel to their consumers and are increasing their number of company owned stores in outlets across America. The recent decline in operating margin for Under Armour probably has to do with the increased fixed costs associated with debt financing. Profit Margin: Ticker Company Column22 Column3 Column4 Column5 Column6 2015 2014 2013 2012 2011 UA US Equity UnderArmour Inc 5.87 6.75 6.96 7.02 6.58 COLM US EQUITY ColumbiaSportswear Corp 7.49 6.53 5.60 5.98 6.11 ADDYY US Equity Adidas AG 3.75 3.37 5.54 3.53 4.60 NKE US EQUITY Nike Inc 10.70 9.69 9.77 9.53 10.22
  • 23.
    The profit marginfor Under Armour has been lagging recently and is a cause of concern for the future since the higher fixed costs from the debt financing is eating away into the profits. Under Armour is striving for long-term growth and make take some profit hits initially but the new investments should produce further revenue growth. Liquidity Ratios Current Ratio: Ticker Company Column22 Column3 Column4 Column5 Column6 2015 2014 2013 2012 2011 UA US Equity UnderArmour Inc 3.13 3.67 2.65 3.58 3.76 COLM US EQUITY ColumbiaSportswear Corp 3.41 3.39 4.15 4.45 3.93 ADDYY US Equity Adidas AG 1.40 1.68 1.45 1.57 1.46 NKE US EQUITY Nike Inc 2.52 2.72 3.44 3.05 2.85 The current ratio is a more accurate measure for the textile industry for liquidity since their inventory is easily turned over into sales. Under Armour is one of the leaders in the industry for the current ratio, which suggests that their ability to meet their debt obligations should be no problem since it should be at least above 1. It has been declining slightly over recent years and it shouldn’t be a problem but something that investors should keep an eye on Quick Ratio: The quick ratio is has been decreasing for Under Armour in the last five years probably because of the debt issuances and it is trailing far behind the leader Columbia Sportswear. However, Under Armour has enough current assets to cover its liabilities, but it is Ticker Company Column22 Column3 Column4 Column5 Column6 2015 2014 2013 2012 2011 UA US Equity UnderArmour Inc 1.18 2.07 1.31 2.05 1.69 COLM US EQUITY ColumbiaSportswear Corp 2.03 2.10 2.78 2.66 2.23 ADDYY US Equity AdidasAG 0.67 0.86 0.75 0.86 0.71 NKE US EQUITY Nike Inc 1.47 1.71 2.29 1.77 1.94
  • 24.
    something to keepan eye on with their increased levels of debt to finance their assets and to continue to expand the company. Inventory Turnover: Ticker Company Column22 Column3 Column4 Column5 Column6 2015 2014 2013 2012 2011 UA US Equity UnderArmour Inc 3.12 3.13 3.03 2.97 2.82 COLM US EQUITY ColumbiaSportswear Corp 2.92 3.21 2.72 2.62 2.82 ADDYY US Equity Adidas AG 3.10 2.95 2.81 3.12 3.03 NKE US EQUITY Nike Inc 3.88 4.13 4.26 4.44 4.77 The inventory turnover ratio is important for the textile industry since it represents the ability to sell their products and have room to bring out the apparel and footwear for the next season. Seasonality plays a key role especially for Under Armour when it relates to different footwear or apparel for the different sports seasons. Under Armour is in the middle of the pack for inventory turnover and Nike has a significant leg up on the competition but it has been decreasing recently. Under Armour is doing a better job turning over their inventory, which is directly reflected in their high revenue growth. Leverage Ratios Debt to Asset: Ticker Company Column22 Column3 Column4 Column5 Column6 2015 2014 2013 2012 2011 UA US Equity UnderArmour Inc 23.32 13.57 9.69 5.35 8.46 COLM US EQUITY ColumbiaSportswear Corp 0.92 0.88 - 0.01 - ADDYY US Equity Adidas AG 13.71 15.08 11.50 12.76 11.39 NKE US EQUITY Nike Inc 5.83 7.38 7.78 2.49 4.42 The amount of debt compared to the total number of assets has been increasing exponentially for Under Armour over the last 5 years compared to the industry as a whole. The greater amount of debt should allow the company to have greater financial leverage and return for their investors should the business continue to grow. It also
  • 25.
    increases the amountof risk Under Armour may face in the future should the company start to go south and revenue growth starts to fall. Operational Ratios Days Sales Outstanding: Ticker Company Column22 Column3 Column4 Column5 Column6 2015 2014 2013 2012 2011 UA US Equity UnderArmour Inc 32.85 28.98 30.17 30.87 29.26 COLM US EQUITY ColumbiaSportswear Corp 56.20 56.58 69.45 75.18 70.21 ADDYY US Equity Adidas AG 43.10 47.15 44.93 40.37 44.69 NKE US EQUITY Nike Inc 38.20 43.01 45.05 49.18 50.63 The number of days sales are outstanding is important ratio for the textile industry and Under Armour is significantly lagging behind their competitors and turning their accounts receivable into cash. This directly relates to the decreasing current and quick ratio and is a potential reason for the decrease along with the additional levels of debt to expand the business. Revenue growth is another reason for the increase in the days sales outstanding since the more sales means there will be more returns and a greater bad debt expense as a result of increased sales. Valuation Ratios Price to Earnings Ratio P/E 2015 2014 2013 2012 2011 Under Armour 91.123562 77.410504 53.189832 52.055818 48.626002 Columbia Sportswear 28.081044 26.833913 20.365024 17.660705 24.291976 Adidas 25.240706 22.573055 29.936189 17.355811 16.862191 Nike 30.132481 26.655295 24.642367 21.451481 19.929281 Under Armour has a P/E ratio of 91.12. The current price stock price of Under Armour is $84. Under Armour may in fact be undervalued since it is still in the growth stage of its life cycle and the P/E ratio is lower than the current stock price. The P/E ratio has nearly doubled in the last 5 years leading me to believe there are strong signs of growth at Under Armour including the launch of new line of shoes by the most popular NBA player Steph Curry and sponsorship from the NFL MVP Cam Newton. Under Armour has expanded
  • 26.
    beyond its normalreach in the textile industry of producing sweatshirts, including cold and heat gear along with sports equipment including football cleats and basketball shoes. Short Sales: The dramatic increase in short sales and the short interest rate as well as the increased volume of transactions is quite evident because of the announcement of the 2 for 1 stock split of the company’s common stock shares. A stock split is usually not viewed highly by investors and typically leads to a downturn in the price of the security since investors believe that the company thinks that the stock price has gotten too high and too much higher than its competitors in the industry. This will help provide greater liquidity in the marketplace for Under Armour making the stock more affordable and should also increase the volume of shares traded on a daily basis because of the lower price.
  • 27.
    Institutional Holdings: The largestinstitutional holders that hold a beneficial ownership in the company are Vanguard Group, FMR LLC, Jennison Associates LLC, and Blackrock. Vanguard is the top institutional holder with 8.29% of shares outstanding, FMR LLC holds 7.83%, Jennison Associates LLC holds 7.08%, and Blackrock holds 5.37%. Should any of these companies liquidate their shares it would cause a dramatic drop in the share price. Vanguard Group is unlikely to liquidate their shares since they manage mutual funds. FMR LLC is fidelity investments that also manage mutual funds making it not likely. Jennison Associates LLC is an asset management firm so it’s not probable they will liquidate all of their shares at once. Blackrock is a global investment firm so the likelihood that they will liquidate their entire position in Under Armour is pretty unlikely.
  • 28.
    Insider Transactions: Recently overthe past year there have been insider transactions in both directions, however there have clearly been more net buys. Most of the buys are for compensation and rewards. This means that the insider transactions are not much of a concern for an investor since most of these are compensation options and relatively safe there is no huge sell of shares for Under Armour. Company News: Under Armour had a strong earnings report for the first quarter of 2016 where the net revenues increased by 30%1 to bring it up to a total of $1.05 billion. Additionally, operating revenue went up 26% to $35 million. Overall the projections for 2016 increased the net revenues to $5 billion and the operating income was raised from $503 million to $507 million. The largest increase in revenue is attributed to the widespread success of the Steph Curry basketball line as footwear net revenues jumped 64% to $264 million compared to $161 million in the last quarter of 2015. For the past 6 years revenue growth has consistently been greater than 20%. Therefore, the future outlook for the year is better than expected and it is the reason for the recent recovery in the stock price starting on April 21st after the devaluation from the stock split. 1 http://finance.yahoo.com/news/under-armour-reports-first-quarter-110000033.html
  • 29.
    Daily Pricing: The dailypricing shows how the security is not volatile in price movements proving the low beta that now sits around 0.07. Benchmark Comparison: 0 2000 4000 6000 8000 10000 12000 1/29/2016 2/29/2016 3/31/2016 InvestmentValue Day Under Armour Under Amour Value
  • 30.
    Benchmark Comparison: The S&P500 has greatly outperformed the Under Armour security throughout the semester yielding a much greater return than Under Armour. The reason that the line is relatively flat compared to the S&P 500 is the beta of the overall market of 1 is much greater than the beta of Under Armour, which is around 0.07 as of right now in contrast to where it started at 0.16 in January. This means that the volatility of Under Armour is significantly less than the S&P 500. Rational Assessment: Under Armour has posted strong financial standing in regards to their profitability, liquidity, leverage, and operational activities amongst their industry. However, especially given the recent stock 2 for 1 split it appears that the initially intrinsic value of the stock was overpriced. This company is definitely in the growth stage with high revenue growth, however it hasn’t necessarily seen the increase in earnings yet. Also, given the relatively low beta of this company I am questioning my initial decision to invest in this security. The return on my investment so far has yielded me about 2.86 % and if it were to be annualized it would be 11.42% would be greater than my required rate of return of 9.986%. I will continue to see how this investment moves in the coming weeks, especially with the positive first quarter earnings.
  • 31.
    Alphabet Inc. Symbol: GOOGL Exchange:NASDAQ Closing Price as of 1/29: $761.35 Quantity purchased on 1/29: 13.1345636 Value of Investment on 1/29: $10,000 Closing Price as of 4/29: $707.48 Current Value of Investment as of 4/29: 9297.694884 (return of -7.02%) Annual Return: -28.09% Security Profile Alphabet Inc. through its subsidiaries, builds technology products and provides services to organize the information including Google search, YouTube, Google apps, app store, mobile devices, advertising program, android, Google Maps, Google Wallet, social media Google +, Chromebook and Chromecast, and Google Cloud Storage to name a few. Alphabet Inc. was founded in 1998 and is headquartered in Mountain View, California. Financial Year End: Dec 31 Beta: 0.89 Sector: Technology Industry: Internet Information Provider Position in the Industry: Leader Reasonfor Selection: Alphabet fits well into my portfolio because they do not pay out dividends to their shareholders but instead since they are a technology based company focus more on innovation with investing into R&D to create new products/services. They are a large cap company that offers potential for growth while maintaining stability. Expected Return: The one-year target estimate for Alphabet is $924.07. Expected Return=(Price^1-T-Price^T)/Price^T ($924.07-$761.35)/$761.35=21.3725618966% This gives me an annual return of 21.3726% Financial Ratios: The financial ratios that are most relevant are the debt to equity ratio, revenue growth, return on equity, return on assets, return on invested capital, and EBIT margin.
  • 32.
    Benchmark: An appropriatebenchmark to measure Alphabet against is the S&P500, which includes Alphabet Inc. and the reason I picked this as my benchmark is Alphabet is a large cap security that is a part of the S&P 500 and could easily be compared to other securities relevant to the internet information provider industry.
  • 33.
    Alphabet Inc (GOOGLUS) -Income Statement In Millions of USD except Per Share FY 2015 Percent +/- FY 2014 Percent +/- FY 2013 12 Months Ending 12/31/2015 12/31/2014 12/31/2013 Revenue 74,989.0 13.62% 66,001.0 18.88% 55,519.0 + Sales & Services Revenue 67,390.0 13.02% 59,624.0 17.96% 50,547.0 + Other Revenue 7,599.0 19.16% 6,377.0 28.26% 4,972.0 - Cost of Revenue 28,164.0 11.26% 25,313.0 15.30% 21,954.0 + Cost of Goods & Services 28,164.0 11.26% 25,313.0 15.30% 21,954.0 Gross Profit 46,825.0 15.08% 40,688.0 21.22% 33,565.0 + Other Operating Income 0.0 0% 0.0 0% 0.0 - Operating Expenses 27,465.0 15.35% 23,811.0 32.13% 18,021.0 + Selling, General & Admin 15,183.0 8.59% 13,982.0 27.90% 10,932.0 + Selling & Marketing 9,047.0 11.27% 8,131.0 24.57% 6,527.0 + General & Administrative 6,136.0 4.87% 5,851.0 32.83% 4,405.0 + Research & Development 12,282.0 24.92% 9,832.0 38.69% 7,089.0 + Other Operating Expense 0.0 100.00% -3.0 -100% 0.0 Operating Income (Loss) 19,360.0 14.71% 16,877.0 8.58% 15,544.0 - Non-Operating (Income) Loss -672.0 -80.16% -373.0 5.57% -395.0 + Interest Expense, Net -895.0 -38.76% -645.0 5.84% -685.0 + Interest Expense 104.0 2.97% 101.0 24.69% 81.0 - Interest Income 999.0 33.91% 746.0 -2.61% 766.0 + Foreign Exch (Gain) Loss 422.0 4.98% 402.0 6.07% 379.0 + Other Non-Op (Income) Loss -199.0 -53.08% -130.0 - 46.07% -89.0 Pretax Income (Loss), Adjusted 20,032.0 16.13% 17,250.0 8.23% 15,939.0 - Abnormal Losses (Gains) 381.0 4333.33 % -9.0 - 122.50 % 40.0 + Asset Write-Down — -100% 378.0 100% — + Sale of Business — #VALUE! — -100% 57.0 + Legal Settlement 47.0 100% — 0% — + Restructuring — -100% 3.0 - 97.87% 141.0 + Sale of Investments 334.0 185.64% -390.0 - 146.84 % -158.0 + Other Abnormal Items — 0% — 0% — Pretax Income (Loss), GAAP 19,651.0 13.86% 17,259.0 8.55% 15,899.0 - Income Tax Expense (Benefit) 3,303.0 -9.23% 3,639.0 42.59% 2,552.0
  • 34.
    + Current IncomeTax 3,561.0 -2.36% 3,647.0 19.77% 3,045.0 + Deferred Income Tax -258.0 - 3125.00 % -8.0 98.38% -493.0 + Tax Allowance/Credit — 0% — 0% 0.0 Income (Loss) from Cont Ops 16,348.0 20.03% 13,620.0 2.05% 13,347.0 - Net Extraordinary Losses (Gains) 0.0 100.00% -516.0 - 220.84 % 427.0 + Discontinued Operations 0.0 100.00% -516.0 - 220.84 % 427.0 + XO & Accounting Changes 0.0 0% 0.0 0% 0.0 Income (Loss) Incl. MI 16,348.0 15.65% 14,136.0 9.41% 12,920.0 - Minority Interest 0.0 0% 0.0 0% 0.0 Net Income, GAAP 16,348.0 15.65% 14,136.0 9.41% 12,920.0 - Preferred Dividends 0.0 0% 0.0 0% 0.0 - Other Adjustments 522.0 100% 0.0 0% 0.0 Net Income Avail to Common, GAAP 15,826.0 11.96% 14,136.0 9.41% 12,920.0 Net Income Avail to Common, Adj 16,073.7 18.07% 13,614.2 1.80% 13,373.0 Net Abnormal Losses (Gains) 247.7 4333.33 % -5.9 - 122.50 % 26.0 Net Extraordinary Losses (Gains) 0.0 100.00% -516.0 - 220.84 % 427.0 Basic Weighted Avg Shares 684.6 1.29% 675.9 1.54% 665.7 Basic EPS, GAAP 23.11 10.52% 20.91 7.73% 19.41 Basic EPS from Cont Ops 20.05 -0.50% 20.15 0.50% 20.05 Basic EPS from Cont Ops, Adjusted 23.48 16.57% 20.14 0.26% 20.09 Diluted Weighted Avg Shares 744.7 0.36% 742.0 9.50% 677.6 Diluted EPS, GAAP 22.84 11.04% 20.57 7.87% 19.07 Diluted EPS from Cont Ops 22.84 15.24% 19.82 0.61% 19.70 Diluted EPS from Cont Ops, Adjusted 23.17 16.96% 19.81 0.37% 19.74
  • 35.
    Income Statement Analysis: RevenueAnalysis Google’s revenue was up 18.88% in 2014 for the following reasons was the Google website revenues increased $7,663 million in 2014 since there was increase in all ad formats, YouTube engagement ads, and slightly hampered by the increased strength of the US dollar. The Google network Members’ websites grew $889 million because of new and richer ad formats and growth in the number of Google Network members. Google’s other revenues increased $1,101 million from 2014 to 2015 and also increased as a percentage of total revenues. The increases were caused by growth of the sales of digital content products in the Google Play store, predominantly apps. Additionally, there was also an increase in services fees collected for cloud and apps offerings. However, these increases were moderately offset by the increasing strength of the U.S. dollar. In 2014 other revenues increased $1,615 million when compared to 2013. The growth was caused by sales of digital content products in the Google Play Store and primarily apps. Expense Analysis Costs of revenues increased $3,968 million in 2014 compared to 2013.In 2014 there was an impairment charge totaling $378 million that was linked to a patent licensing royalty asset acquired in relation to the acquisition of Motorola that did not happen again in 2015. Part of the increase was attributed to the traffic acquisition costs that totaled $1,239 million that stemmed from greater distribution fees for the extra traffic directed towards Google websites. It also, included new advertiser fees paid to Google Network Members that was caused by the upswing in advertising revenues. The rest of the upswing is attributed to data center costs, content acquisition costs related to improved usage of YouTube and digital content by Google’s users, and revenue share payments to mobile carriers and OEMs. The increase is also related to previously discussed impairment charge. Sales and marketing expenses increased $916 million in 2015 because of the increase in labor and facilities related costs of $329 million and an increased in stock based compensation expense of $184 million. Additionally, there was an increase in advertising and promotional expenses of $329 million and an increase in professional services of $158 million. In 2014 sales and marketing expenses went up $1,577 million because of an increased advertising and promotional expenses totaling $614 million. Additional there was labor and facilitates related costs of $571 million and stock based compensation expense increase of $163 million from sales going up 15%. General and Administrative expenses increased $1,419 million in 2014 because of an increase in labor and facility related costs of $576 million and an growth in stock based compensation expense of $260 million that stem from a 24% increases in general and administration headcount. Professional services went up $14 million since there were increased legal related costs; also there were outsourced services and consulting.
  • 36.
    Research and developmentincreased $2,450 million in 2015 since there was an increased in labor and facilities related costs of $1,502 million and also an upswing in stock based compensation expense of $487 million. Additionally there was an estimated $248 million increase in depreciated and equipment related expenses and professional services grew $174 million since there was expenses for outsourced services and consulting. These were the primary reasons research and development increased in 2014 with an overall increase of $2,695 million of expenses. This was composed of increases in facilities reacted costs of $1,289 million, stock based compensation $559 million, depreciated and equipment related expense of $425 million and $371 million for outsourced services and consulting.
  • 37.
    Alphabet Inc (GOOGL US)- Balance Sheet In Millions of USD except Per Share FY 2015 FY 2014 FY 2013 12 Months Ending 12/31/2015 Percent +/- 12/31/2014 Percent +/- 12/31/2013 Total Assets + Cash, Cash Equivalents & STI 73,066.0 13.47% 64,395.0 9.67% 58,717.0 + Cash & Cash Equivalents 16,549.0 -9.80% 18,347.0 -2.92% 18,898.0 + ST Investments 56,517.0 22.73% 46,048.0 15.64% 39,819.0 + Accounts & Notes Receiv 11,556.0 23.16% 9,383.0 5.64% 8,882.0 + Accounts Receivable, Net 11,556.0 23.16% 9,383.0 5.64% 8,882.0 + Notes Receivable, Net 0.0 0% 0.0 0% 0.0 + Inventories 0.0 0% 0.0 -100.00% 426.0 + Raw Materials 0.0 0% 0.0 -100.00% 115.0 + Work In Process 0.0 0% 0.0 0%! 0.0 + Finished Goods 0.0 0% 0.0 -100.00% 311.0 + Other Inventory 0.0 0% 0.0 0% 0.0 + Other ST Assets 5,492.0 12.59% 4,878.0 0.35% 4,861.0 + Derivative & Hedging Assets 0.0 0% 0.0 0% 0.0 + Deferred Tax Assets — #VALUE ! — #VALUE! 1,526.0 + Income Taxes Receivable 1,903.0 222.00 % 591.0 44.85% 408.0 + Misc ST Assets 3,589.0 -16.28% 4,287.0 46.46% 2,927.0 Total Current Assets 90,114.0 14.57% 78,656.0 7.92% 72,886.0 + Property, Plant & Equip, Net 29,016.0 21.49% 23,883.0 44.54% 16,524.0 + Property, Plant & Equip 40,146.0 22.60% 32,746.0 37.37% 23,837.0 - Accumulated Depreciation 11,130.0 25.58% 8,863.0 21.20% 7,313.0 + LT Investments & Receivables 5,183.0 68.33% 3,079.0 55.82% 1,976.0 + LT Marketable Securities 5,183.0 68.33% 3,079.0 55.82% 1,976.0 + Other LT Assets 23,148.0 -1.79% 23,569.0 20.66% 19,534.0 + Total Intangible Assets 19,716.0 -2.43% 20,206.0 15.08% 17,558.0 + Goodwill 15,869.0 1.73% 15,599.0 35.74% 11,492.0 + Other Intangible Assets 3,847.0 -16.50% 4,607.0 -24.05% 6,066.0 + Prepaid Expense 3,181.0 -0.19% 3,187.0 61.29% 1,976.0 + Deferred Tax Assets 251.0 42.61% 176.0 100% — + Derivative & Hedging Assets 0.0 0% 0.0 0% 0.0 + Misc LT Assets 0.0 0% 0.0 0% 0.0 Total Noncurrent Assets 57,347.0 13.49% 50,531.0 32.86% 38,034.0 Total Assets 147,461.0 14.15% 129,187.0 16.47% 110,920.0
  • 38.
    Liabilities& Shareholders' Equity +Payables & Accruals 12,853.0 14.39% 11,236.0 7.43% 10,459.0 + Accounts Payable 1,931.0 12.59% 1,715.0 -30.09% 2,453.0 + Accrued Taxes 302.0 214.58 % 96.0 300.00% 24.0 + Interest & Dividends Payable — 0% — 0% 0.0 + Other Payables & Accruals 10,620.0 12.68% 9,425.0 18.08% 7,982.0 + ST Debt 3,225.0 60.53% 2,009.0 -33.23% 3,009.0 + ST Borrowings 2,000.0 0.05% 1,999.0 -0.50% 2,009.0 + ST Capital Leases 225.0 2150.00 % 10.0 11.11% 9.0 + Current Portion of LT Debt 1,000.0 100% 0.0 -100.00% 991.0 + Other ST Liabilities 3,232.0 -8.55% 3,534.0 44.84% 2,440.0 + Deferred Revenue 788.0 4.79% 752.0 -29.19% 1,062.0 + Derivatives & Hedging 16.0 300.00 % 4.0 0.00% 4.0 + Misc ST Liabilities 2,428.0 -12.60% 2,778.0 102.18% 1,374.0 Total Current Liabilities 19,310.0 15.08% 16,779.0 5.48% 15,908.0 + LT Debt 1,995.0 -38.20% 3,228.0 44.36% 2,236.0 + LT Borrowings 1,995.0 -33.32% 2,992.0 50.35% 1,990.0 + LT Capital Leases 0.0 - 100.00 % 236.0 -4.07% 246.0 + Other LT Liabilities 5,825.0 9.49% 5,320.0 -2.69% 5,467.0 + Accrued Liabilities 0.0 0% 0.0 0% 0.0 + Pension Liabilities 0.0 0% 0.0 0% 0.0 + Pensions 0.0 0% 0.0 0% 0.0 + Other Post-Ret Benefits 0.0 0% 0.0 0% 0.0 + Deferred Revenue 151.0 45.19% 104.0 -25.18% 139.0 + Deferred Tax Liabilities 189.0 -75.07% 758.0 -61.07% 1,947.0 + Derivatives & Hedging 0.0 0% 0.0 0% 0.0 + Misc LT Liabilities 5,485.0 23.04% 4,458.0 31.85% 3,381.0 Total Noncurrent Liabilities 7,820.0 -8.52% 8,548.0 10.97% 7,703.0 Total Liabilities 27,130.0 7.12% 25,327.0 7.27% 23,611.0 + Preferred Equity 0.0 0% 0.0 0% 0.0 + Share Capital & APIC 32,982.0 14.65% 28,767.0 10.98% 25,922.0 + Common Stock 0.7 1.04% 0.7 102.56% 0.3 + Additional Paid in Capital 32,981.3 14.65% 28,766.3 10.97% 25,921.7 - Treasury Stock 0.0 0% 0.0 0% 0.0 + Retained Earnings 89,223.0 18.86% 75,066.0 22.53% 61,262.0 + Other Equity -1,874.0 - 7040.74 27.0 -78.40% 125.0
  • 39.
    % Equity Before MinorityInterest 120,331.0 15.86% 103,860.0 18.96% 87,309.0 + Minority Interest 0.0 0% 0.0 0% 0.0 Total Equity 120,331.0 15.86% 103,860.0 18.96% 87,309.0 Total Liabilities& Equity 147,461.0 14.15% 129,187.0 16.47% 110,920.0 Current Assets Inventories and raw materials decreased because of the sale of the Motorola Mobile business in 2014 and the sale of the Motorola Home business in 2013 since the majority of business consisted of hardware products. Alphabet is going with the trend of less hardware and more software products to be offered instead. Long Term Assets In August 2013 Alphabet entered into a capital lease obligation for $258 million with the intent to purchase the property in 2016 making it a long-term asset increasing the overall value of property, plant, and equipment. The decrease in goodwill can be attributed to the sale of the of Motorola Home business in 2013. The accumulated depreciation can be accounted for with the new capital lease agreement that began in 2013. Current Liabilities In 2014 Alphabet had a liability to repay the first tranche of the $3 billion of unsecured senior notes for corporate purposes making it a current liability since it was due in less than 1 year. Also, a current liability includes the portion of the capital lease obligation due in the current year for 2013, 2014, 2015 for each year. Short-term debt includes up to $3 billion through the issuance of commercial paper and it increased $934 million in 2015 accounting for the large difference between 2015 and 2014. This short-term debt includes the capital lease agreement where the option to purchase the property in 2016 is expected to be executed making it a year or less, hence it becomes a current liability. Long Term Liabilities The long-term liabilities include the outstanding note issued in February of 2014, which was $1 billion of an unsecured senior note in order to repay the first tranche of the unsecured senior note for corporate purposes. The capital lease is no longer considered a Long Term liability it is a short-term liability since it is expected that Alphabet will exercise the option to purchase the property in 2016.
  • 40.
    Equity On April 2,2014, there was a two-for-one stock split in the form of a stock dividend (the Stock Split). On August 10, 2015, we announced plans to create a new public holding company, Alphabet Inc. (Alphabet), and a new operating structure. On October 2, 2015, we implemented the holding company reorganization, and as a result, Alphabet became the successor issuer to Google Inc. (Google). In October 2015, the board of directors of Alphabet authorized the company to repurchase up to $5,099,019,513.59 of its Class C capital stock, commencing in the fourth quarter of 2015. The repurchases are being executed from time to time, subject to general business and market conditions and other investment opportunities, through open market purchases or privately negotiated transactions.
  • 41.
    Alphabet Inc (GOOGL US)- Cash Flow In Millions of USD except Per Share FY 2015 FY 2014 FY 2013 12 Months Ending 12/31/2015 Percent +/- 12/31/2014 Percent +/- 12/31/2013 Cash from Operating Activities + Net Income 16,348.0 15.65% 14,136.0 9.41% 12,920.0 + Depreciation & Amortization 5,063.0 1.69% 4,979.0 26.40% 3,939.0 + Non-Cash Items 5,022.0 93.97% 2,589.0 41.40% 1,831.0 + Stock-Based Compensation 4,655.0 28.20% 3,631.0 26.87% 2,862.0 + Deferred Income Taxes -179.0 -72.12% -104.0 76.20% -437.0 + Other Non-Cash Adj 546.0 158.21% -938.0 -57.91% -594.0 + Chg in Non-Cash Work Cap -409.0 -160.86% 672.0 2267.74% -31.0 + (Inc) Dec in Accts Receiv -2,094.0 -27.61% -1,641.0 -25.55% -1,307.0 + (Inc) Dec in Inventories 0.0 0% 0.0 0% — + Inc (Dec) in Accts Payable 203.0 -53.44% 436.0 -27.93% 605.0 + Inc (Dec) in Other 1,482.0 -21.04% 1,877.0 179.73% 671.0 + Net Cash From Disc Ops — 0% — 0% — Cash from Operating Activities 26,024.0 16.30% 22,376.0 19.92% 18,659.0 Cash from Investing Activities + Change in Fixed & Intang -9,915.0 9.53% -10,959.0 -48.94% -7,358.0 + Disp in Fixed & Intang 0.0 0% 0.0 0% 0.0 + Disp of Fixed Prod Assets 0.0 0% 0.0 0% 0.0 + Disp of Intangible Assets 0.0 0% 0.0 0% 0.0 + Acq of Fixed & Intang -9,915.0 9.53% -10,959.0 -48.94% -7,358.0 + Acq of Fixed Prod Assets -9,915.0 9.53% -10,959.0 -48.94% -7,358.0 + Acq of Intangible Assets 0.0 0% 0.0 0% 0.0 + Net Change in LT Investment 0.0 0% 0.0 0% 0.0 + Dec in LT Investment 0.0 0% 0.0 0% — + Inc in LT Investment 0.0 0% 0.0 0% — + Net Cash From Acq & Div -236.0 94.76% -4,502.0 -518.01% 1,077.0 + Cash from Divestitures 0.0 -100.00% 386.0 -84.71% 2,525.0 + Cash for Acq of Subs -236.0 95.17% -4,888.0 -237.57% -1,448.0 + Cash for JVs 0.0 0% 0.0 0% 0.0 + Other Investing Activities -13,560.0 -142.40% -5,594.0 24.38% -7,398.0 + Net Cash From Disc Ops — 0% — 0% — Cash from Investing Activities -23,711.0 -12.61% -21,055.0 -53.92% -13,679.0 Cash from Financing Activities
  • 42.
    + Dividends Paid0.0 0% 0.0 0% 0.0 + Cash From (Repayment) Debt -23.0 -27.78% -18.0 96.77% -557.0 + Cash From (Repay) ST Debt -23.0 -27.78% -18.0 96.77% -557.0 + Cash From LT Debt 0.0 0% 0.0 0% 0.0 + Repayments of LT Debt 0.0 0% 0.0 0% 0.0 + Cash (Repurchase) of Equity -1,232.0 -290.12% 648.0 34.72% 481.0 + Increase in Capital Stock 548.0 -15.43% 648.0 34.72% 481.0 + Decrease in Capital Stock -1,780.0 -100% 0.0 0% 0.0 + Other Financing Activities -2,422.0 -17.06% -2,069.0 -164.92% -781.0 + Net Cash From Disc Ops — 0% — 0% — Cash from Financing Activities -3,677.0 -155.52% -1,439.0 -67.91% -857.0 Effect of Foreign Exchange Rates -434.0 -0.23% -433.0 -14333.33% -3.0 Net Changes in Cash -1,798.0 -226.32% -551.0 -113.37% 4,120.0 Cash Paid for Taxes 3,338.0 18.41% 2,819.0 45.91% 1,932.0 Cash Paid for Interest 96.0 11.63% 86.0 19.44% 72.0 Operating Activities The largest sources of cash provided by operations are the advertising revenues generated by Google websites and Google Network Members’ websites. They generate cash through the sales of apps digital content, hardware products, licensing arrangements and services fees for the cloud and apps and Maps API. However, in 2014 there was a divesture in October related to the Motorola Mobile business that use to generate cash from sales of hardware products for Alphabet Inc. The primary uses of cash from operating activities included payments to Google Network Members and distribution partners, and payments for content acquisition costs. Prior to the sale of the Motorola Mobile business in 2014 the use of cash included manufacturing and inventory related costs in the Motorola Mobile business segment. Other uses of cash were compensation and associated costs, broad corporate expenditures, and income tax expenses. Net cash provided by operating activities increased in 2015 when compared to 2014 because of growth in net income adjusted for depreciation and stock based compensation expense along with the loss on sales of marketable and nonmarketable securities. It was slightly offset with a net decrease in cash due to changes in working capital. Net cash provided by operating activities increased in 2014 when compared to 2013 since there was increased net income adjusted for depreciation and loss of disposal of property and stock based compensation expense and equipment and a net increase in cash from changes in work capital that was propelled by changes in prepaid revenue share, expenses, and other assets.
  • 43.
    Investing Activities On April17, 2013 Motorola Home business was sold to Arris for $2.4 billion in cash including $2.238 billion that was received when the deal was closed and post close adjustments of $174 million received in the third quarter of 2013 and also $175 million of Arris’ common stock. This resulted in a net gain on the disposal of the asset of $757 million. On October 29, 2014 Motorola Mobile business was sold to Lenovo for $2.9 billion that was financed by $660 million in cash and $750 million in Lenovo ordinary shares and the leftover 1.5 billion was to be paid in an interest free promissory note. Overall the sale left Alphabet with a gain on the disposal of the asset of $740 million net of tax. There were also several acquisitions in 2014 and 2015 that resulted in the net loss from investing activities when comparing the year over year for the past 3 years. In 2015 bebpop Technologies was acquired for $272 million of which $1 million was paid in cash and the rest was financed with $271 million in Alphabet Class C capital stock. Other acquisitions totaled an estimated $263 million. In 2014 Nest was acquired for $2.6 billion, which was comprised of $2.3 billion was in goodwill; $51 million was cash, $430 attributed to intangible assets, and $84 million to net liabilities assumed. Financing Activities In May 2011 Alphabet issued 3.0 billion worth of notes that would be used in 3 equal tranches of 1.0 billion with the first one due in 2014 then 2016 and 201. During 2014 in February there was $1 billion issued in notes that used to repay $1 billion of the initial tranche that were issued in 2011 for corporate purposes. As of the end of 2015 the $3.0 billion of unsecured senior notes had a carrying value of $3.0 billion and fair market value of $3.1 billion. In August 2013, Alphabet entered into an agreement for $258 million for a capital lease obligation and they are expected to purchase the property in 2016. Alphabet has authorized a repurchase of shares of approximately $5.6 billion of its Class C capital stock that began in the fourth quarter of 2015. These repurchases will be made depending on market and business conditions from time to time. The income taxes and effective tax rate decreased from 2014 to 2015 because of a discrete benefit recognized in 2015 as the resolution of a multi-year audit in the USA and there were proportionally more earnings realized in countries that have lower tax rates. Income taxes and the effective tax rate increased from 2013 to 2014 because of greater earnings that have higher tax rates and there was more tax benefit recognition in 2013 in comparison to 2014 since there was a retroactive extension of 2012 federal research and development credit that was counterbalanced by a benefit used on a valuation allowance release that was associated with a capital loss to carry forward in 2014.
  • 44.
    Finding a SustainableGrowth Rate: Formula=g=ROE (1- Payout ratio) Alphabet Inc. 2015 ROE=18.66% 2015 Payout Ratio=0 G=18.66% Residual Income Model: CAPM: 𝑅 𝑟 = 𝑅𝑓 + (𝑅 𝑚 − 𝑅𝑓)𝛽 1.93 %+( 12%-1.93%) (0.89) =10.8923 𝑷 𝟎 = 𝑩 𝟎 + (𝑬𝑷𝑺 𝟎 ∗ ( 𝟏 + 𝒈) − 𝑩 𝟎 ∗ 𝒌)/(𝒌− 𝒈) 759.47=175.07+ (23.59*(1+g)-175.07)/(.108923-g) =9.73% Therefore after calculating the growth rate from the residual income model we reject the sustainable growth rate as the current growth rate of the company it is in fact much closer to around 7%. Revenue Growth Analysis: Year Revenue Revenue Growth% Change 2015 $ 74,989.00 $ 8,988.00 13.62% 2014 $ 66,001.00 $ 10,482.00 18.88% 2013 $ 55,519.00 $ 5,344.00 10.65% 2012 $ 50,175.00 $ 12,270.00 32.37% 2011 $ 37,905.00 GeometricAverage 17.25% Revenue growth has declined as whole over the past 5 years and the outlier of the growth in 2012 offsets the geometric average. The decline in revenue growth is cause of concern for the future growth of the company as a whole and it is lower than the sustainable growth rate. Therefore, this level of growth is sustainable, but the revenue has been pretty volatile over the last 5 years and Alphabet may be turning into a value company with the decreased growth in revenue.
  • 45.
    Gross Profit GrowthAnalysis: Year Gross Profit Gross ProfitGrowth % Change 2015 $ 46,825.00 $ 6,137.00 15.08% 2014 $ 40,688.00 $ 7,123.00 21.22% 2013 $ 33,565.00 $ 3,895.00 13.13% 2012 $ 29,670.00 $ 4,953.00 20.04% 2011 $ 24,717.00 GeometricAverage 17.03% The gross profit has been declining as well since its correlated to the revenue growth and in fact the gross profit declined about 6% last year and the declining profit and revenue growths are concerning for investors. This also suggests that the sustainable growth rate is inaccurate since the gross profit growth is gradually becoming significantly lower than the sustainable growth rate. The sustainable growth level suggests that the gross profit margin growth rate is sustainable, but the residual income model might be more accurate given the decrease in growth recently. Net Income Growth Analysis: Year NetIncome NetIncome Growth % Change 2015 $ 16,073.70 $ 2,459.50 18.07% 2014 $ 13,614.20 $ 241.20 1.80% 2013 $ 13,373.00 $ 2,516.10 23.18% 2012 $ 10,856.90 $ 1,119.90 11.50% 2011 $ 9,737.00 GeometricAverage 9.65% The net income growth suggests that Alphabet had a down year in 2014 with an extremely small net income growth level that appears to an outlier based on the last 5 years of data. This is much lower than the sustainable growth rate probably because of the outlier in 2014. Overall the net income growth does show that this is a profitable company.
  • 46.
    Projected Income Statement: AlphabetInc(GOOGL- US) Projected -Income Statement Column1 Column2 In Millionsof USDexceptpershare 12 monthsending 12/31/16 12/31/15 Revenue $87,924.60 $74,989.00 + Sales & Services Revenue $79,014.78 $67,390.00 + Other Revenue $8,909.83 $7,599.00 - Cost of Revenue $33,022.29 $28,164.00 Gross Profit $54,902.31 $46,825.00 - Operating Expenses $32,202.71 $27,465.00 + Selling, General & Admin $17,802.07 $15,183.00 + Research & Development $14,400.65 $12,282.00 + Other Operating Expense $- $- Operating Income (Loss) $22,699.60 $19,360.00 - Non-Operating (Income) Loss $-672.00 $-672.00 + Interest Expense, Net $-895.00 $-895.00 + Other Non-Op (Income) Loss $-199.00 $-199.00 Pretax Income (Loss), Adjusted $20,933.60 $20,032.00 - Income Tax Expense (Benefit) $3,558.71 $3,030.00 + Current Income Tax $3,561.00 + Deferred Income Tax $-258.00 Income (Loss) from Cont Ops $17,374.89 $16,438.00 Net Income, GAAP $17,374.89 $16,438.00 Basic Weighted Avg Shares $684.60 $684.60 Basic EPS, GAAP $25.38 $22.84 Projections In order to make my projections for 2016 I increased the revenue, cost of goods sold (cost of revenue), the operating expenses, the pre-tax income, and the EPS. For the revenue I took the 5 year geometric average for revenue growth and then I took the percentage of cost of goods sold to revenue from the previous year and multiplied it by the new projected revenue to project the cost of revenue. All extraordinary items or non-recurring income was excluded from the projections. All of the non-operating income expenses were held at their current levels since they are fixed costs unlike the cost of goods sold. I used the previous year tax rate of 17% to project the income tax expense. Then I took the new net income and divided it by the basic weighted share outstanding from the previous year to find the new EPS.
  • 47.
    Financial Ratios: Profitability ROA: The returnon assets for Alphabet Inc. is right in line with the majority of the competition with an insignificant difference between them Microsoft and Facebook, however Apple has almost double the ROA in comparison to its competitors. The reason for the differences is Apple has a dominant market share in the cell phone industry. Alphabet has a strong partnership with Android as Google products are preinstalled, but the Android phones designed by Alphabet are not nearly as successful as Apple or Samsung. Yahoo has been struggling as of late and there have been talks of selling the company, ROE: Ticker Company Column22 Column3 Column4 Column5 Column6 Year 2015 2014 2013 2012 2011 GOOGLUS EquityAlphabetInc 14.18 14.79 16.25 16.54 18.66 FB US EQUITY Facebook 9.14 11.34 10.95 0.40 22.91 YHOO US Equity Yahoo!Inc (12.86) 29.03 9.89 29.12 8.36 AAPLUS EQUITY Apple Inc 42.71 33.61 30.64 42.84 41.67 MSFT US EQUITY MicrosoftCorp 13.53 26.17 30.09 27.51 44.84 The return on equity isn’t too much higher than the ROA meaning Alphabet Inc. probably does not have high levels of debt. In contrast to Apple that has a significantly higher ROE than ROA giving them financial leverage. The ROE for Alphabet Inc. is the second highest amongst its competitors and has been slowly decreasing recently along with most of their competitors except for Apple. Alphabet Inc. has appeared to be maturing according to the slight declines in the ROE and ROA, although they are constantly innovative it may be harder to get their latest innovation driverless cars to Ticker Company Column22 Column3 Column4 Column5 Column6 Year 2015 2014 2013 2012 2011 GOOGLUS Equity AlphabetInc 11.87 11.77 12.62 12.91 14.93 FB US EQUITY Facebook 8.21 10.11 9.04 0.30 14.33 YHOO US Equity Yahoo!Inc (8.15) 19.16 8.06 24.75 7.06 AAPLUS EQUITY Apple Inc 19.36 18.01 19.34 28.54 27.06 MSFT US EQUITY MicrosoftCorp 6.4314.02 16.58 14.77 23.77
  • 48.
    market since thepublic is wary of them. The ROE is consistent with the poor ROA for Yahoo indicating that this company may not have good financial standing. Debt to Equity: Ticker Company Column22 Column3 Column4 Column5 Column6 Year 2015 2014 2013 2012 2011 GOOGLUS EquityAlphabetInc 4.34 5.04 6.01 7.72 7.23 FB US EQUITY Facebook 0.26 0.65 3.08 20.04 13.82 YHOO US Equity Yahoo!Inc 4.24 3.02 8.46 - - AAPLUS EQUITY Apple Inc 54.01 31.64 13.73 - - MSFT US EQUITY MicrosoftCorp 44.07 25.22 19.76 18.00 20.88 The decreased levels of debt in the capital structure of Alphabet could account for the decrease in the profit margins as well since there is less financial leverage when the level of debt declines. Alphabet overall has minimal levels of debt that has been trending downward over the past 5 years in contrast to Microsoft and Apple who have financing their business with high levels of debt. ROIC: Apple is clearly leading the industry with the efficiency to turn allocated capital into investment returns. Alphabet is currently second in ROIC and over the past 5 years overall it has be on the decline, which appears to be fairly consistent with its competitors. There is room for improvement in the efficiency at which Alphabet operates; however they could be doing far worse such as Microsoft who has seen the furthest decline in the past 5 years. Ticker Company Column22 Column3 Column4 Column5 Column6 Year 2015 2014 2013 2012 2011 GOOGLUS EquityAlphabetInc 13.74 12.84 15.14 14.58 16.44 FB US EQUITY Facebook 9.18 11.42 10.14 0.59 25.15 YHOO US Equity Yahoo!Inc (8.48) 3.13 9.26 7.57 8.26 AAPLUS EQUITY Apple Inc 27.97 23.74 24.78 37.64 37.03 MSFT US EQUITY MicrosoftCorp 9.61 20.76 24.47 21.84 35.83
  • 49.
    Gross Profit Margin: TickerCompany 2015 2014 2013 2012 2011 GOOGL US Equity Alphabet Inc 62.44 61.65 60.39 62.69 65.21 FB US Equity Facebook 84.01 82.46 77.67 77.05 82.73 YHOO US Equity Yahoo! Inc 58.18 69.96 71.17 67.50 68.16 AAPL US Equity Apple Inc 40.13 39.26 37.41 41.91 42.41 MSFT US Equity Microsoft Corp 64.00 65.74 71.41 75.35 76.38 The gross profit margin for Alphabet is one of the worst for the industry meaning they have higher cost of goods sold compared to their competitors where Facebook is the clear leader. Operating Margin: The operating margin is also known as the return on sales and it depicts how well each company is generating profits from operating income. This demonstrates that Alphabet has a healthy operating margin and probably does not have any problems with liquidity and is right in the middle of the pack for the industry. However, they do trail Facebook significantly and Alphabet’s operating margin has decreased recently probably because of the sale of the Motorola business since hardware typically generates higher profit margins than software. Profit Margin: Ticker Company Column22 Column3 Column4 Column5 Column6 Year 2015 2014 2013 2012 2011 GOOGLUS EquityAlphabetInc 25.82 24.99 27.74 25.43 30.98 FB US EQUITY Facebook 34.72 40.06 35.62 10.57 47.32 YHOO US Equity Yahoo!Inc (95.58) 3.10 12.60 11.36 16.06 AAPLUS EQUITY Apple Inc 30.48 28.72 28.67 35.30 31.22 MSFT US EQUITY MicrosoftCorp 19.41 31.97 34.38 29.52 38.83
  • 50.
    The decrease inthe profit margin for Alphabet Inc. can best be attributed to the sale of Home Motorola Business in 2013 and since Alphabet Inc. is utilizing more cloud based products and software in general and moving away from hardware products. Alphabet Inc. is one of the leaders of profit margin for the industry only slightly trailing behind Apple whom offers more hardware products such as the iPhone. Liquidity Ratios Quick Ratio: Alphabet has a healthy quick ratio that is well above the requirement of one since the cash and cash equivalents should be able to cover your current liabilities in order to meet your debt obligations. However, this does not appear to be an issue going forward since as indicated by the capital structure and leverage ratios the amount of debt compared to the amount of equity is minimal. Current Ratio: Ticker Company Column22 Column3 Column4 Column5 Column6 Year 2015 2014 2013 2012 2011 GOOGLUS EquityAlphabetInc 21.80 21.42 23.27 21.40 25.69 FB US EQUITY Facebook 20.47 23.46 18.94 0.63 18.00 YHOO US Equity Yahoo!Inc (87.74) 162.87 29.19 79.12 21.04 AAPLUS EQUITY Apple Inc 22.85 21.61 21.67 26.67 23.95 MSFT US EQUITY MicrosoftCorp 13.03 25.42 28.08 23.03 33.10 Ticker Company Column22 Column3 Column4 Column5 Column6 Year 2015 2014 2013 2012 2011 GOOGLUS Equity AlphabetInc 4.38 4.40 4.25 3.90 5.62 FB US EQUITY Facebook 10.91 9.04 11.42 9.83 4.96 YHOO US Equity Yahoo!Inc 5.41 2.00 3.27 4.02 2.56 AAPLUS EQUITY Apple Inc 0.73 0.67 1.23 1.04 1.12 MSFT US EQUITY MicrosoftCorp 2.30 2.31 2.53 2.41 2.35
  • 51.
    Ticker Company Column22Column3 Column4 Column5 Column6 Year 2015 2014 2013 2012 2011 GOOGLUS EquityAlphabetInc 4.67 4.69 4.58 4.22 5.92 FB US EQUITY Facebook 11.25 9.40 11.88 10.71 5.12 YHOO US Equity Yahoo!Inc 5.88 2.09 3.75 4.38 2.86 AAPLUS EQUITY Apple Inc 1.11 1.08 1.68 1.50 1.61 MSFT US EQUITY MicrosoftCorp 2.50 2.50 2.71 2.60 2.60 Alphabet has a healthy current ratio as well that does not vary much from the quick ratio since the company is moving away from hardware products transitioning towards all software products making the difference between the quick and current ratio small. Leverage Ratios Debt to Assets: Ticker Company Column22 Column3 Column4 Column5 Column6 Year 2015 2014 2013 2012 2011 GOOGLUS EquityAlphabetInc 3.54 4.05 4.73 5.90 5.79 FB US EQUITY Facebook 0.23 0.58 2.66 15.60 10.69 YHOO US Equity Yahoo!Inc 2.73 1.90 6.61 - - AAPLUS EQUITY Apple Inc 22.19 15.22 8.19 - - MSFT US EQUITY MicrosoftCorp 20.03 13.14 10.95 9.85 10.97 The higher the debt to assets ratio the higher the financial leverage and the higher the level of risk since debt financing is riskier. Once again Alphabet shows a low level of debt in contrast to Apple and Microsoft whom have much higher financial risk and leverage. Alphabet is positioned in the middle of the industry once again. Operational Ratios
  • 52.
    Days Sales Outstanding: TickerCompany Column22 Column3 Column4 Column5 Column6 Year 2015 2014 2013 2012 2011 GOOGLUS EquityAlphabetInc 50.96 50.50 55.12 48.55 46.60 FB US EQUITY Facebook 43.13 40.80 42.38 45.53 45.24 YHOO US Equity Yahoo!Inc 76.41 79.52 77.52 75.08 75.66 AAPLUS EQUITY Apple Inc 22.97 30.43 25.59 19.32 18.29 MSFT US EQUITY MicrosoftCorp 63.59 77.83 77.98 76.37 73.06 The number of days that sales are outstanding is right in the middle of the pack for the industry as whole for Alphabet. Recently this number has been increasing for Alphabet, but the competition and industry as a whole appears to be decreasing. This shouldn’t be a concern as of right now since Alphabet has healthy liquidity and debt ratios, however it is something to be mindful of should the capital structure change and they issue more debt financing to grow the business to purchase assets.
  • 53.
    Short Sales: Short saleshit a high during beginning of the year it appears sometime during February where the stock price shot down about 100 points since it got as high as $780 per share and at the lowest point it was around $700 a share. Short sales have been on the upswing recently indicating that the price of the security Alphabet is expected to fall in price slightly since the trend presently is a slight upward slope of short sales. Short interest is slightly sloping upwards. The short interest ratio indicates that right now it will take 2.37 days for all of the investors shorting Alphabet to cover their position. Also the chart shows how the average daily volume spikes up when investors close out their short positions and the price begins to rise once again such as in February when there was the highest volume of shares traded and the stock price plummeted. However, it has since recovered and the stock price is expected to decline should short sales continue to rise.
  • 54.
    Institutional Holders: The largestinstitutional holders that hold a beneficial ownership in the company are FMR LLC, Blackrock, and Vanguard Group. FMR LLC is the top institutional holder with 6.26% of shares outstanding, Blackrock holds 6.11%, and Vanguard holds 5.96%. Should any of these companies liquidate their shares it would cause a dramatic drop in the share price. Vanguard Group is unlikely to liquidate their shares since they manage mutual funds. FMR LLC is fidelity investments that also manage mutual funds making it not likely. Blackrock is a global investment firm so the likelihood that they will liquidate their entire position in Under Armour is pretty unlikely.
  • 55.
    Insider Transactions: The insidertransactions indicate that the net sell of shares are typical of the company for the compensation options to turn their stocks into cash and means that the insider transactions are relatively safe and not much of a concern for the future of this security. Company News: Alphabet had its lowest one day drop in the stock price since October 2012 after the negative earnings report from the first quarter of 2016 where they missed the earnings targets2.The shares dropped 5.46% on Friday April 21 after the earnings were released. The primary reason that the earnings fell short of the target was the fact that the company spent more money to boost internet traffic. This article indicates that the miss was more a headline move indicating that irrational investors just read the headline instead of analyzing the earnings that included a 20% rise in revenue from Google websites and the number of Ads jumped 29%. Many of the analysts cut the price target of Alphabet but none of them downgraded the security. The analysts suggest to buy according to 48 of them and 3 of them suggest to hold. Short term costs associated with the shift to mobile automated advertising. Essentially there is still growth prospects but increasing costs are said to be only be short term, however it is something to be mindful of. 2 http://finance.yahoo.com/news/alphabet-stock-slips-results-brokerages-141130061.html
  • 56.
    Daily Pricing: As shownin the graph the daily price is volatile due to the beta of the underlying security, which is subject to the systemic risk of the overall market and the unsystemic risk when the earnings for the first quarter were released on April 21. Benchmark Comparison: 8600 8800 9000 9200 9400 9600 9800 10000 10200 10400 10600 1/29/2016 2/29/2016 3/31/2016 InvestmentValue Day Alphabet Inc Alphabet Value
  • 57.
    The benchmark isappropriate since Alphabet Inc is a large cap security and the typical benchmark of large cap securities could be the movement of the overall market which is best represented by the S&P 500. Clearly indicated by the chart Alphabet has severely been outperformed by the S&P500 especially since the missed earnings report. The increased costs are a reason for concern since they cut into profits, however they claim to be temporary so a bounce back is possible especially given the volatility of the security if the investor truly believes the increased costs are temporary. Rationale Assessment: My investment so far has not yielded me any return at all in fact the stock price has gone down since my initial investment including a rough month of February and April. Given the recent short interest rate on this security I am not overly optimistic for the return on this security for the end of the semester. The failure to even come close to the benchmark is concerning especially given the fact in the very beginning of February the stock price shot up to an all-time high, but has struggled since especially recently after the earnings report failed to meet projections. The trending short interest ratio could potentially indicate that there is another drop in the stock price very possible in the near future. If I went back and had to pick my securities again and had all of this research and knowledge about the security I don’t think this would’ve been a wise investment as proven thus far with the negative return on investment.
  • 58.
    HartfordCore Equity A SecurityName: Hartford Core Equity A Symbol: HAIAX Exchange: NASDAQ Price as of 1/29: $22.51 Quantity purchased of 1/29: 444.2470013 Value of Investment as of 1/29: $10,000 Closing Price as of 4/29: $23.46 Current Value of Investment as of 4/29: $10,422.03 (4.22% return) Annual Return: 16.88% Security Profile: This is a large-blended mutual fund that seeks growth of capital and usually has at least 80% invested in common stocks. This mutual fund does not pay a dividend and focuses primarily on large capitalization companies with market caps similar to that of the S&P 500. The mutual fund may invest 20% in foreign securities. The blended strategy incorporates value and growth stocks providing ample diversification. Hartford Core Equity A requires an initial investment of $2000 and each subsequent investment must be $50 or more. In total I have invested $10,000 into the mutual fund. 91.7% of the fund is invested into the stock market while 7.36% is invested in cash reserves. The top 10 holding companies are Microsoft, CVS, JP Morgan Chase, Alphabet, Costco Wholesale Corporation, Mondelez International, Apple Inc., Allegran plc Ordinary Shares, Altria Group Inc., and PNC Financial Services Group. The benchmark that I will be using will be the S&P 500. The load-adjusted returns for one year are -1.53%, 3 years 12.65%, 5 year 11.59%, and 10 year 6.35%. Therefore, the expected return on this investment is 12.65%. Beta: 0.95 Category: Large Blend Fund Family: Hartford Mutual Funds Reasonfor Selection: The mutual fund provides my portfolio with ample diversification by having no more than 2.74% of the mutual fund invested in one stock. Additionally, the mutual fund offers a variety of different sectors including but not limited to consumer cyclical, industrials, technology, healthcare, and consumer defensive, and financial services. Expected Return: Expected Return=(Price^1-T-Price^T)/Price^T =(25.2112-22.51)/22.51 12% Return
  • 59.
    Benchmark: The S&P 500is the correct benchmark for this mutual fund because the mutual fund consists of mostly large cap stocks that are included in the S&P 500 and would be an excellent comparison since the primary goal of a mutual fund is to do better than the market with the incorporation of the manager of the fund. Top 10 Holdings (20.34% of Total Assets) Company Symbol % Assets YTD Return % Microsoft Corporation MSFT 2.71 N/A Alphabet Inc. GOOGL 2.20 N/A Costco Wholesale Corporation COST 2.08 N/A JP Morgan Chase & Co. Common St JPM 2.04 N/A Apple Inc. AAPL 2.03 N/A Altria Group, Inc. MO 1.98 N/A CVS Health Corporation Common S CVS 1.88 N/A D/B/A Chubb Limited New Common CB 1.81 N/A Mondelez International,Inc. MDLZ 1.81 N/A NextEra Energy, Inc. Common Sto NEE 1.80 N/A The current 10 top holdings represent 20.34% of the total assets, which is only about 1/5 of the overall mutual fund. Additionally, 2.71% is the maximum invested in one security of the top holding Microsoft Corporation. This makes this mutual fund a well-diversified portfolio based on unsystemic risk since the asset allocation is well diversified across almost all sectors of the equities market. It is still involved with large cap securities. Overall Portfolio Composition (%) Cash: 8.19 Stocks: 90.88 Bonds: 0.00 Other: 0.93 The composition of the portfolio is primarily invested in the equities market with a few cash reserves in case of a collapse in the equities market. However, in the future this mutual fund may want to consider incorporating bonds into the portfolio in order to further diversify the mutual fund.
  • 60.
    Sector Weightings (%) SectorHAIAX Category Avg Basic Materials 2.68 3.00 Consumer Cyclical 12.47 12.69 Financial Services 13.83 15.32 Realestate 0.00 2.00 Consumer Defensive 15.06 9.98 Healthcare 15.78 15.35 Utilities 5.18 2.58 Communication Services 1.95 4.21 Energy 2.78 6.15 Industrials 16.02 11.63 Technology 14.25 17.08 The mutual fund is also widely diversified based on all of the market sectors with healthcare being the majority of the mutual fund with 15.78% of the assets invested into it. The only sector that is not included in the mutual fund is the real-estate sector. The sectors that makeup the vast majority of the mutual fund are technology, industrials, healthcare, consumer defensive, financial services, and consume cyclical. Compared to the industry average for the different sector weightings my mutual fund is pretty consistent except for including less technology and a greater number of consumer defensive securities.
  • 61.
    Fees & Expenses ExpenseHAIAX Category Avg Annual ReportExpense Ratio (net): 0.92% 1.01% Prospectus NetExpense Ratio: 0.80% N/A Prospectus Gross Expense Ratio: 0.98% N/A Max 12b1 Fee: 0.25% N/A Max Front End Sales Load: 5.50% 5.30% Max Deferred Sales Load: N/A 2.03% 3 Yr Expense Projection*: 828 458 5 Yr Expense Projection*: 1,045 725 10 Yr Expense Projection*: 1,670 1,484 The annual report expense ratio is at 0.92% slightly below the category average of 1.01%. The 12b1 or marketing fee is higher than the category average at 0.25. The front end sales load is at 5.5%, which is higher than the category average of 5.3%. Since there is a front end sales load there is obviously no deferred sales load. Overall, the expense projections for the next 10 years are slightly higher than the category average. Financial Ratios: Risk (Modern Portfolio Theory) Statistics 3 Years Statistic HAIAX Category Alpha (against Standard Index) 3.18 -1.94 Beta (againstStandard Index) 0.93 1.00 Mean Annual Return 1.18 0.82 R-squared (againstStandard Index) 94.26 94.21 Standard Deviation 10.84 11.66 Sharpe Ratio 1.30 0.84 Treynor Ratio 15.55 9.63
  • 62.
    5 Years Statistic HAIAXCategory Alpha (againstStandard Index) 1.72 -2.03 Beta (againstStandard Index) 0.95 1.03 Mean Annual Return 1.07 0.84 R-squared (againstStandard Index) 96.13 95.16 Standard Deviation 11.80 12.87 Sharpe Ratio 1.08 0.78 Treynor Ratio 13.50 9.40 The Alpha ratio is substantially higher than the average for large blend mutual funds. This means that the mutual fund is earning much higher returns than when compared to the standard index. The Sharpe ratio is also higher than the category average, which means that the fund is earning above average returns regards with regards to the beta of the mutual fund. The Treynor ratio is often used by investors to determine the systemic risk or standard deviation. The ratio is almost double the category average making this a risky investment for this category of mutual funds, however the higher returns shown above require additional risk, which is the primary reason why the Treynor ratio is higher. Comparison against Benchmark:
  • 63.
    This chart isa direct comparison of the performance of the S&P500 and the Hartford Core Equity A mutual fund since I first purchased the security on January 29, 2016. As shown by the graph the lines had almost zero separation through the end of February, however the S&P 500 has slightly outperformed the mutual fund since the beginning of March up until present day. Overall, the mutual fund has yet to outperform the index, however it is a long term investment that has added significant diversification and been my most profitable security in my portfolio. Daily Pricing: As seen in the graph above the daily fluctuations are similar to how the beta reacts to movements in the marketplace Also, since it is a mutual fund it is less subject to extreme movements since it is a well diversified fund that helps to mitigate unsystemic risk. The overall performance is positive, but it is currently on a downward trend probably related to interest rates remaining flat. Rational Assessment: So far it has been the most profitable investment and is aimed towards long-term growth and diversification. Mutual funds are typically a long term investment and it is possible that the manager or the fund could have a down year and not beat the market, but overall have a higher return based on long term growth. However, given the current performance of my mutual fund so far I would say that it has been a good investment since it is greater than my required rate of return. However, the mutual fund has failed to outperform the benchmark. For the future this could be a good investment since the annualized return of 16.88% is greater than the average for most large cap securities of 12%. 8600 8800 9000 9200 9400 9600 9800 10000 10200 10400 10600 10800 1/29/2016 2/29/2016 3/31/2016 InvestmentValue Day Hartford Core Equity A Hartford Core Equity A Value
  • 64.
    Portfolio: Investment value asof 1/29: $30,000 Portfolio Weights as of 1/29: Under Armour Inc: 33.33% Alphabet Inc: 33.33% Hartford Core Equity A: 33.33% Beta as of 1/29: Under Armour Inc: 0.16 Alphabet Inc: 0.89 Hartford Core Equity A: 0.95 =0.16(1/3)+0.89(1/3)+0.95(1/3) =0.6666 Investment value as of 4/29: $30005.31006 New Portfolio Weights as of 4/29: Under Armour Inc: (10285.58052/$30005.31006)=34.28% Alphabet Inc: (9297.694884/$30005.31006)=30.97% Hartford Core Equity A: ($10422.03465/$30005.31006)=34.73% Beta as of 4/29: Under Armour: 0.078576 Alphabet Inc: 0.908401 Hartford Core Equity A: 0.93 =0.078576(.3428)+0.908401(.3097)+0.93(.3473) =.6313 Compare the Beta for the Portfolio Throughout the semester the overall risk level or beta has changed throughout the semester as the weights of the investments changed daily since the investments were priced daily. Overall the risk level of my portfolio has decreased since the beta of the portfolio went from 0.6666 to 0.6313 at the end of the 3 months. A lower overall beta means there will be less fluctuations with the overall value of my portfolio. However, since the beta of Alphabet Inc. has increased throughout the semester it will be more volatile and subject to further fluctuations in the future, but it should have less of an impact on the value of my portfolio since the weight of the security decreased from 33.33% to 30.97%. On the other hand Under Armour had the beta almost cut in half decreasing the fluctuations along with lower returns since there is a lower beta. It will have a greater impact on the value of my portfolio and the return on it since the weight of the security in the portfolio has increased from 33.3% to 34.28%. Hartford Core Equity A saw a slight drop in the beta over the last 3 months indicating that the price will not fluctuate as much as well as producing a lower return as a result. The mutual fund will have a greater impact on the value of my portfolio since the weight of the security in my portfolio has increased from 33.33% to 34.73%. Overall, for the portfolio as whole the beta has decreased indicating there will be less fluctuations in the investment value of the portfolio as well as a smaller return.
  • 65.
    Overall the portfoliohas not yielded much of a return as a whole and as of late it has been trending downwards. The volatility of the portfolio reflects the securities within it and as you can see initially there was greater volatility when the weights were all equal, however now since Alphabet missed their earnings the price was dropped off and decreased the overall weight of the security in my portfolio making my portfolio less volatile since now Under Armour has a greater weight in the portfolio. Portfolio Return v. the Benchmark The S&P500 produced a return of 7.05% during the 3 month investment period of my portfolio which is much greater than the 0.02% return that my portfolio yielded. Therefore, overall I would say that there are better investments I should have made with my $30,000 since I only ended up with about a $5 return for the semester. Alphabet hurt the value of my portfolio and my return the most. Therefore, I would replace that security with another one that fits my risk level and my required rate of return and would yield a positive return on my investment. The relevance of the benchmark to my investment style of large and mid-cap securities is the S&P 500 is a common benchmark for large cap securities. My choices reflects this style since Alphabet is a large cap security, Under Armour is a mid-cap security and Hartford Core Equity A is a mutual fund compromised of mostly large cap securities. Comparison of the Results of the Individual Investments Hartford Core Equity A had the highest return for the semester with a 4.22% which is 16.88% annualized, followed by Under Armour had a return for the semester of 2.86% which is 11.42% annualized, lastly Alphabet lost money with a negative return of -7.02% which is annualized at -28.09%. The mutual fund outperformed all of my other investments and based on the charts over the last 3 months had less price volatility than Alphabet. Under Armour struggled for the majority of the semester, but then was turned around by the positive earnings report on April 21st improving the intrinsic value of the company. In contrast to Alphabet whom suffered greatly with the earnings report that 24000 25000 26000 27000 28000 29000 30000 31000 32000 33000 1/29/2016 2/29/2016 3/31/2016 PortfolioValue Day Portfolio Value for 3 Months Portfolio Value
  • 66.
    missed the earningstargets taking positive investment for march and April and instead yielded a negative return greater than any of the positive returns of Under Armour or the Hartford Mutual Fund. What Would I do differently? First, of all I would choose my securities differently starting with the required rate of return I would have to figure out what securities could achieve this return that are in my beta range. Given my low beta I would probably change my investment style to investing in large cap stocks that pay dividends. While Alphabet and the Mutual Fund fall within this general range I firmly believe that Under Armour has too low of a beta for me to pick it all over again as a security for my portfolio with equal weights with $10,000 invested in each one. Also, with the mutual fund and find one that does not have a front end sales load fee since it immediately takes away from the money the investor is investing. On the other hand Alphabet would probably be excluded from my portfolio as well since the extremely high price as the start of the semester could be too high based on the empirical evidence from the results these past 3 months. Given my low beta another way for me to increase the return on my investment would be to invest with securities that yielded a dividend since my beta is pretty low at 0.8. I would do all of the research prior to investing in any security that is presented in this paper before investing in anything. The research is available to the public it is just a matter of being able to read it and interpret what it truly means through the analysis of the financial statements, financial ratios, beneficial owners, short interest, and projecting the income statements. All of this information and research will be vital to determine if there is growth for the security and could help determine the potential intrinsic value of the security that would indicate when it is appropriate to buy or sell the security. Since my new strategy would incorporate choosing stocks with dividends. First I would determine the dividend growth rate. Then I would find out the sustainable growth rate. Next I would determine if the sustainable growth rate was less than the growth rate. If the growth rate was greater than the sustainable growth rate I would have to use the sustainable growth rate. Then if the discount rate was less than the growth rate then I would use the dividend discount model as useful tool in determining the intrinsic value of the stock. However if the growth rate was greater than the discount rate I would use the residual income model. Then I could find out if this is higher or lower than the current stock price and if the intrinsic value meets my required rate of return then it would indicate a good time to purchase the security.
  • 67.
    Works Cited http://finance.yahoo.com/echarts?s=UA+Interactive#{"customRangeStart":1454043600,"customRa ngeEnd":1460001600,"range":"custom","allowChartStacking":true} http://finance.yahoo.com/news/alphabet-stock-slips-results-brokerages-141130061.html http://finance.yahoo.com/news/under-armour-reiterates-outlook-2016-133000339.html https://finance.yahoo.com/news/google-mulls-bid-yahoos-core-193106102.html http://finance.yahoo.com/echarts?s=GOOGL+Interactive#{"customRangeStart":1454043600,"custo mRangeEnd":1460001600,"range":"custom","allowChartStacking":true} http://finance.yahoo.com/echarts?s=HAIAX+Interactive#{"customRangeStart":1454043600,"custo mRangeEnd":1460001600,"range":"custom","allowChartStacking":true} https://abc.xyz/investor/pdf/20151231_alphabet_10K.pdf http://investor.underarmour.com/secfiling.cfm?filingID=1336917-16-64&CIK=1336917 http://finance.yahoo.com/news/under-armour-reports-first-quarter-110000033.html