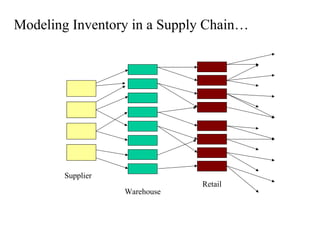
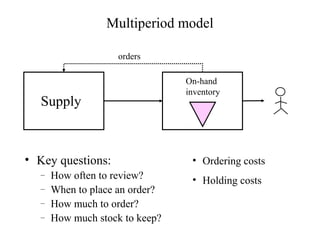
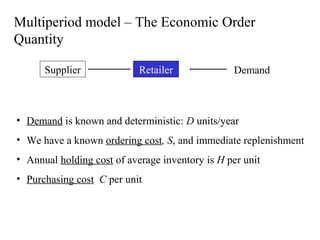
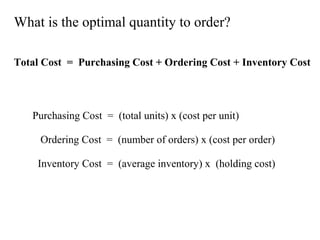
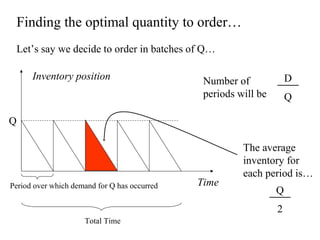
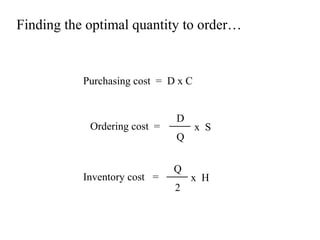
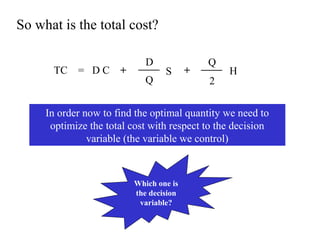
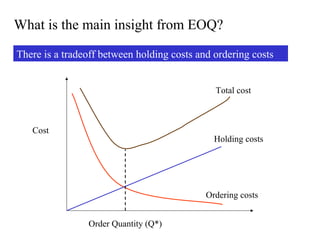
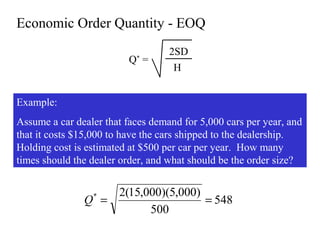
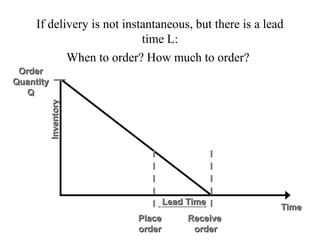
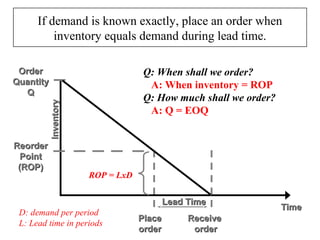
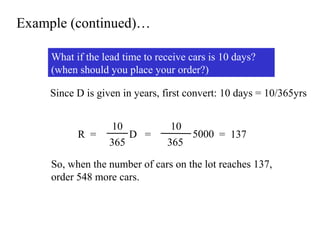
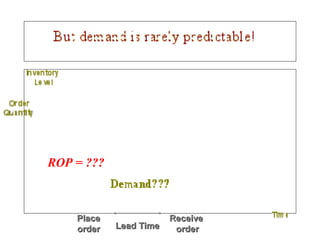
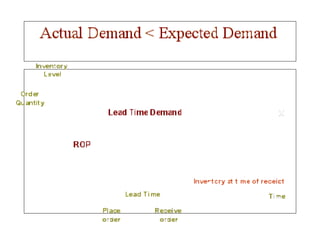
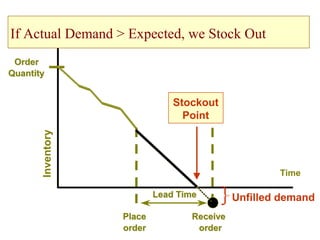
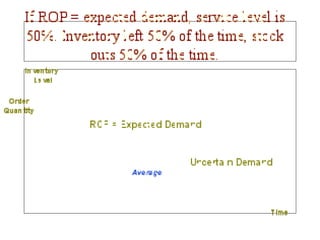
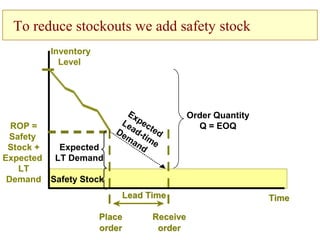
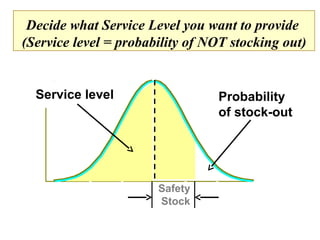
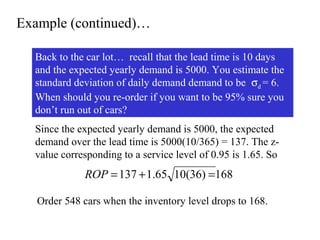
Inventory Management
What is inventory?

Inventory is the raw materials, component
parts, work-in-process, or finished products
that are held at a location in the supply chain.
Why do we care?
At the macro level:
Inventory is one of the biggest corporate assets ($).
Investment in inventory is currently over $1.25
Trillion (U.S. Department of Commerce).
This figure accounts for almost 25% of GNP.

Enormous potential for efficiency increase by
controlling inventories
Why do we care?
At the firm level:
– Sales growth: right inventory at the right place
at the right time
– Cost reduction: less money tied up in inventory,
inventory management, obsolescence

Higher profit
Why do we care?
Each of Solectron’s big customers, which include Cisco,
Ericsson, and Lucent was expecting explosive growth for
wireless phones and networking gear….when the bottom
finally fell out, it was too late for Solectron to halt orders
from all of its 4,000 suppliers. Now, Solectron has $4.7
billion in inventory. (BW, March 19, 2001)
“When Palm formally reported its quarterly numbers in
June, the damage was gruesome. Its loss totaled $392
million, a big chunk of which was attributable to writing
down excess inventory - piles of unsold devices.” (The
Industry Standard, June 16, 2001)
“Liz Claiborne said its unexpected earnings decline is the
consequence of higher than anticipated excess
inventories”. (WSJ, August 1993)
How do you manage your inventory?
How much do you buy? When?
•
•
•
•
•
•

Soda
Milk
Toilet paper
Gas
Cereal
Cash
What Do you Consider?
• Cost of not having it.
• Cost of going to the grocery or gas station (time,
money), cost of drawing money.
• Cost of holding and storing, lost interest.
• Price discounts.
• How much you consume.
• Some safety against uncertainty.
Costs of Inventory
• Physical holding costs:
– out of pocket expenses for storing inventory (insurance,
security, warehouse rental, cooling)
– All costs that may be entailed before you sell it
(obsolescence, spoilage, rework...)

• Opportunity cost of inventory: foregone return on
the funds invested.
• Operational costs:
– Delay in detection of quality problems.
– Delay the introduction of new products.
– Increase throughput times.
Benefits of Inventory
• Hedge against uncertain demand
• Hedge against uncertain supply
• Economize on ordering costs
• Smoothing
To summarize, we build and keep inventory in
order to match supply and demand in the most
cost effective way.
Modeling Inventory in a Supply Chain…

Supplier
Warehouse

Retail
Home Depot
• “Our inventory consists of up to 35,000
different kinds of building materials, home
improvement supplies, and lawn and garden
products.”
• “We currently offer thousands of products in
our online store.”
• “We offer approximately 250,000 more
products through our special order services.”
Different types of inventory models
1. Multi-period model
•

Repeat business, multiple orders

2. Single period models
•

Single selling season, single order
Multiperiod model
orders

Supply

• Key questions:
–
–
–
–

How often to review?
When to place an order?
How much to order?
How much stock to keep?

On-hand
inventory

• Ordering costs
• Holding costs
Multiperiod model – The Economic Order
Quantity
Supplier

Retailer

Demand

• Demand is known and deterministic: D units/year
• We have a known ordering cost, S, and immediate replenishment
• Annual holding cost of average inventory is H per unit
• Purchasing cost C per unit
What is the optimal quantity to order?
Total Cost = Purchasing Cost + Ordering Cost + Inventory Cost

Purchasing Cost = (total units) x (cost per unit)
Ordering Cost = (number of orders) x (cost per order)
Inventory Cost = (average inventory) x (holding cost)
Finding the optimal quantity to order…
Let’s say we decide to order in batches of Q…
Inventory position

D

Number of
periods will be

Q

Q

Period over which demand for Q has occurred

Time

The average
inventory for
each period is…
Q
2

Total Time
Finding the optimal quantity to order…

Purchasing cost = D x C

Ordering cost =

Inventory cost =

D
Q
Q
2

x S

x H
So what is the total cost?
TC

= DC

+

D
Q

S

+

Q
2

H

In order now to find the optimal quantity we need to
optimize the total cost with respect to the decision
variable (the variable we control)

Which one is
the decision
variable?
What is the main insight from EOQ?
There is a tradeoff between holding costs and ordering costs
Total cost

Cost

Holding costs

Ordering costs
Order Quantity (Q*)
Economic Order Quantity - EOQ
Q =
*

2SD
H

Example:
Assume a car dealer that faces demand for 5,000 cars per year, and
that it costs $15,000 to have the cars shipped to the dealership.
Holding cost is estimated at $500 per car per year. How many
times should the dealer order, and what should be the order size?

2(15,000)(5,000)
Q =
= 548
500
*
If delivery is not instantaneous, but there is a lead
time L:
When to order? How much to order?

Inventory

Order
Quantity
Q

Lead Time
Place
order

Receive
order

Time
If demand is known exactly, place an order when
inventory equals demand during lead time.
Order
Quantity
Q
Inventory

Q: When shall we order?
A: When inventory = ROP
Q: How much shall we order?
A: Q = EOQ

Reorder
Point
(ROP)

ROP = LxD
Lead Time

D: demand per period
L: Lead time in periods

Place
order

Receive
order

Time
Example (continued)…
What if the lead time to receive cars is 10 days?
(when should you place your order?)
Since D is given in years, first convert: 10 days = 10/365yrs

R =

10
D =
365

10
5000 = 137
365

So, when the number of cars on the lot reaches 137,
order 548 more cars.
ROP = ???

Place
order

Lead Time

Receive
order
If Actual Demand > Expected, we Stock Out
Order
Quantity

Inventory

Stockout
Point

Time
Lead Time
Place
order

Receive
order

Unfilled demand
To reduce stockouts we add safety stock
Inventory
Level

ROP =
Safety
Stock +
Expected
Expected LT Demand
LT
Demand Safety Stock

Ex
Le pec
D e ad- t t ed
ma im
nd e

Lead Time
Place
order

Receive
order

Order Quantity
Q = EOQ

Time
Decide what Service Level you want to provide
(Service level = probability of NOT stocking out)

Service level

Probability
of stock-out

Safety
Stock
Safety stock =
(safety factor z)(std deviation in LT demand )

Service level

Probability
of stock-out

Safety
Stock
Read z from Normal table for a given service level
Caution: Std deviation in LT demand
Variance over multiple periods = the sum of
the variances of each period (assuming
independence)
Standard deviation over multiple periods is
the square root of the sum of the variances,
not the sum of the standard deviations!!!
Average Inventory =
(Order Qty)/2 + Safety Stock
Inventory
Level

Order
Quantity
EOQ/2

Safety Stock (SS)
Lead Time
Place
order

Receive
order

Time

Average
Inventory
How to find ROP & Q
2SD
H

1. Order quantity Q = EOQ =
2. To find ROP, determine the service level (i.e., the
probability of NOT stocking out.)
Find the safety factor from a z-table or from the graph.
Find std deviation in LT demand: square root law.
std dev in LT demand = ( std dev in daily demand )

days in LT

σLT = σD LT

Safety stock is given by:

SS = (safety factor)(std dev in LT demand)
Reorder point is: ROP = Expected LT demand + SS

3. Average Inventory is: SS + EOQ/2
Example (continued)…
Back to the car lot… recall that the lead time is 10 days
and the expected yearly demand is 5000. You estimate the
standard deviation of daily demand demand to be σd = 6.
When should you re-order if you want to be 95% sure you
don’t run out of cars?
Since the expected yearly demand is 5000, the expected
demand over the lead time is 5000(10/365) = 137. The zvalue corresponding to a service level of 0.95 is 1.65. So

ROP = 137 + 1.65 10(36) =168
Order 548 cars when the inventory level drops to 168.

Inventory management

  • 1.
  • 2.
    What is inventory? Inventoryis the raw materials, component parts, work-in-process, or finished products that are held at a location in the supply chain.
  • 3.
    Why do wecare? At the macro level: Inventory is one of the biggest corporate assets ($). Investment in inventory is currently over $1.25 Trillion (U.S. Department of Commerce). This figure accounts for almost 25% of GNP. Enormous potential for efficiency increase by controlling inventories
  • 4.
    Why do wecare? At the firm level: – Sales growth: right inventory at the right place at the right time – Cost reduction: less money tied up in inventory, inventory management, obsolescence Higher profit
  • 5.
    Why do wecare? Each of Solectron’s big customers, which include Cisco, Ericsson, and Lucent was expecting explosive growth for wireless phones and networking gear….when the bottom finally fell out, it was too late for Solectron to halt orders from all of its 4,000 suppliers. Now, Solectron has $4.7 billion in inventory. (BW, March 19, 2001) “When Palm formally reported its quarterly numbers in June, the damage was gruesome. Its loss totaled $392 million, a big chunk of which was attributable to writing down excess inventory - piles of unsold devices.” (The Industry Standard, June 16, 2001) “Liz Claiborne said its unexpected earnings decline is the consequence of higher than anticipated excess inventories”. (WSJ, August 1993)
  • 6.
    How do youmanage your inventory? How much do you buy? When? • • • • • • Soda Milk Toilet paper Gas Cereal Cash
  • 7.
    What Do youConsider? • Cost of not having it. • Cost of going to the grocery or gas station (time, money), cost of drawing money. • Cost of holding and storing, lost interest. • Price discounts. • How much you consume. • Some safety against uncertainty.
  • 8.
    Costs of Inventory •Physical holding costs: – out of pocket expenses for storing inventory (insurance, security, warehouse rental, cooling) – All costs that may be entailed before you sell it (obsolescence, spoilage, rework...) • Opportunity cost of inventory: foregone return on the funds invested. • Operational costs: – Delay in detection of quality problems. – Delay the introduction of new products. – Increase throughput times.
  • 9.
    Benefits of Inventory •Hedge against uncertain demand • Hedge against uncertain supply • Economize on ordering costs • Smoothing To summarize, we build and keep inventory in order to match supply and demand in the most cost effective way.
  • 10.
    Modeling Inventory ina Supply Chain… Supplier Warehouse Retail
  • 11.
    Home Depot • “Ourinventory consists of up to 35,000 different kinds of building materials, home improvement supplies, and lawn and garden products.” • “We currently offer thousands of products in our online store.” • “We offer approximately 250,000 more products through our special order services.”
  • 12.
    Different types ofinventory models 1. Multi-period model • Repeat business, multiple orders 2. Single period models • Single selling season, single order
  • 13.
    Multiperiod model orders Supply • Keyquestions: – – – – How often to review? When to place an order? How much to order? How much stock to keep? On-hand inventory • Ordering costs • Holding costs
  • 14.
    Multiperiod model –The Economic Order Quantity Supplier Retailer Demand • Demand is known and deterministic: D units/year • We have a known ordering cost, S, and immediate replenishment • Annual holding cost of average inventory is H per unit • Purchasing cost C per unit
  • 15.
    What is theoptimal quantity to order? Total Cost = Purchasing Cost + Ordering Cost + Inventory Cost Purchasing Cost = (total units) x (cost per unit) Ordering Cost = (number of orders) x (cost per order) Inventory Cost = (average inventory) x (holding cost)
  • 16.
    Finding the optimalquantity to order… Let’s say we decide to order in batches of Q… Inventory position D Number of periods will be Q Q Period over which demand for Q has occurred Time The average inventory for each period is… Q 2 Total Time
  • 17.
    Finding the optimalquantity to order… Purchasing cost = D x C Ordering cost = Inventory cost = D Q Q 2 x S x H
  • 18.
    So what isthe total cost? TC = DC + D Q S + Q 2 H In order now to find the optimal quantity we need to optimize the total cost with respect to the decision variable (the variable we control) Which one is the decision variable?
  • 19.
    What is themain insight from EOQ? There is a tradeoff between holding costs and ordering costs Total cost Cost Holding costs Ordering costs Order Quantity (Q*)
  • 20.
    Economic Order Quantity- EOQ Q = * 2SD H Example: Assume a car dealer that faces demand for 5,000 cars per year, and that it costs $15,000 to have the cars shipped to the dealership. Holding cost is estimated at $500 per car per year. How many times should the dealer order, and what should be the order size? 2(15,000)(5,000) Q = = 548 500 *
  • 21.
    If delivery isnot instantaneous, but there is a lead time L: When to order? How much to order? Inventory Order Quantity Q Lead Time Place order Receive order Time
  • 22.
    If demand isknown exactly, place an order when inventory equals demand during lead time. Order Quantity Q Inventory Q: When shall we order? A: When inventory = ROP Q: How much shall we order? A: Q = EOQ Reorder Point (ROP) ROP = LxD Lead Time D: demand per period L: Lead time in periods Place order Receive order Time
  • 23.
    Example (continued)… What ifthe lead time to receive cars is 10 days? (when should you place your order?) Since D is given in years, first convert: 10 days = 10/365yrs R = 10 D = 365 10 5000 = 137 365 So, when the number of cars on the lot reaches 137, order 548 more cars.
  • 24.
    ROP = ??? Place order LeadTime Receive order
  • 26.
    If Actual Demand> Expected, we Stock Out Order Quantity Inventory Stockout Point Time Lead Time Place order Receive order Unfilled demand
  • 28.
    To reduce stockoutswe add safety stock Inventory Level ROP = Safety Stock + Expected Expected LT Demand LT Demand Safety Stock Ex Le pec D e ad- t t ed ma im nd e Lead Time Place order Receive order Order Quantity Q = EOQ Time
  • 29.
    Decide what ServiceLevel you want to provide (Service level = probability of NOT stocking out) Service level Probability of stock-out Safety Stock
  • 30.
    Safety stock = (safetyfactor z)(std deviation in LT demand ) Service level Probability of stock-out Safety Stock Read z from Normal table for a given service level
  • 31.
    Caution: Std deviationin LT demand Variance over multiple periods = the sum of the variances of each period (assuming independence) Standard deviation over multiple periods is the square root of the sum of the variances, not the sum of the standard deviations!!!
  • 32.
    Average Inventory = (OrderQty)/2 + Safety Stock Inventory Level Order Quantity EOQ/2 Safety Stock (SS) Lead Time Place order Receive order Time Average Inventory
  • 33.
    How to findROP & Q 2SD H 1. Order quantity Q = EOQ = 2. To find ROP, determine the service level (i.e., the probability of NOT stocking out.) Find the safety factor from a z-table or from the graph. Find std deviation in LT demand: square root law. std dev in LT demand = ( std dev in daily demand ) days in LT σLT = σD LT Safety stock is given by: SS = (safety factor)(std dev in LT demand) Reorder point is: ROP = Expected LT demand + SS 3. Average Inventory is: SS + EOQ/2
  • 34.
    Example (continued)… Back tothe car lot… recall that the lead time is 10 days and the expected yearly demand is 5000. You estimate the standard deviation of daily demand demand to be σd = 6. When should you re-order if you want to be 95% sure you don’t run out of cars? Since the expected yearly demand is 5000, the expected demand over the lead time is 5000(10/365) = 137. The zvalue corresponding to a service level of 0.95 is 1.65. So ROP = 137 + 1.65 10(36) =168 Order 548 cars when the inventory level drops to 168.

Editor's Notes

  • #14 Consider the following setting: customer demand is satisfied from on-hand inventory. For replenishment, we review our stocks on a periodic basis (say, every week) and place orders to an upstream supplier. There is a non-negligible lead time for replenishment. We refer to the total of on-hand stock (that can be used to meet customer demand) and the pipeline stock (inventory on the trucks) as the inventory position. To balance out inventory cost with customer service, we have three decisions to make: how often to review the stock, when to place a replenishment order, and how much to order. Together, these three decisions constitute an inventory control policy.