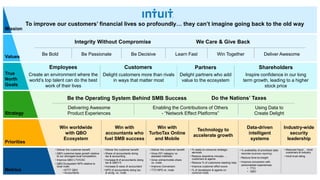
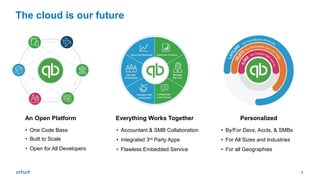
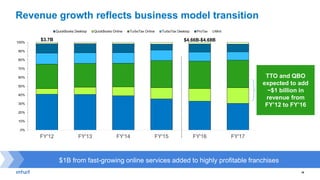
- The document provides an overview of Intuit, including forward-looking statements and metrics. It discusses Intuit's strategy to win with QuickBooks Online, accountants, and TurboTax Online and Mobile.
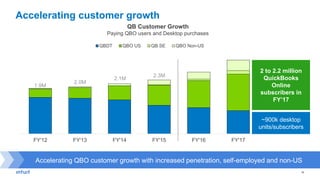
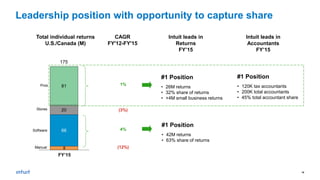
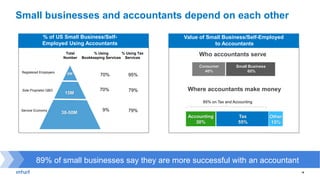
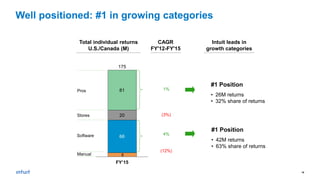
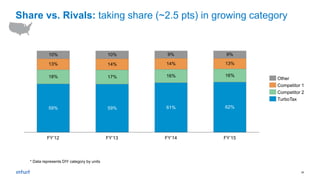
- Key goals include accelerating QuickBooks Online customer growth, increasing the number of accountants using Intuit's tax and accounting solutions, and growing Intuit's online/mobile share versus rivals in the tax preparation market.
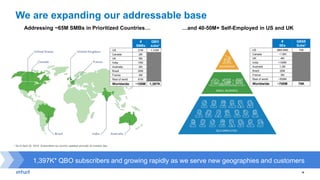
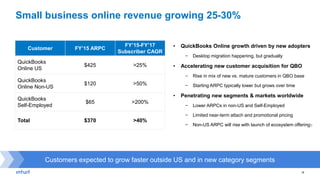
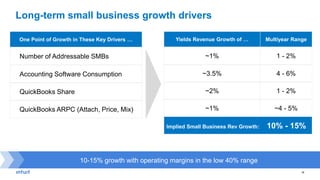
- Intuit aims to expand its total addressable market by entering new markets with QuickBooks and addressing small businesses and self-employed individuals worldwide.