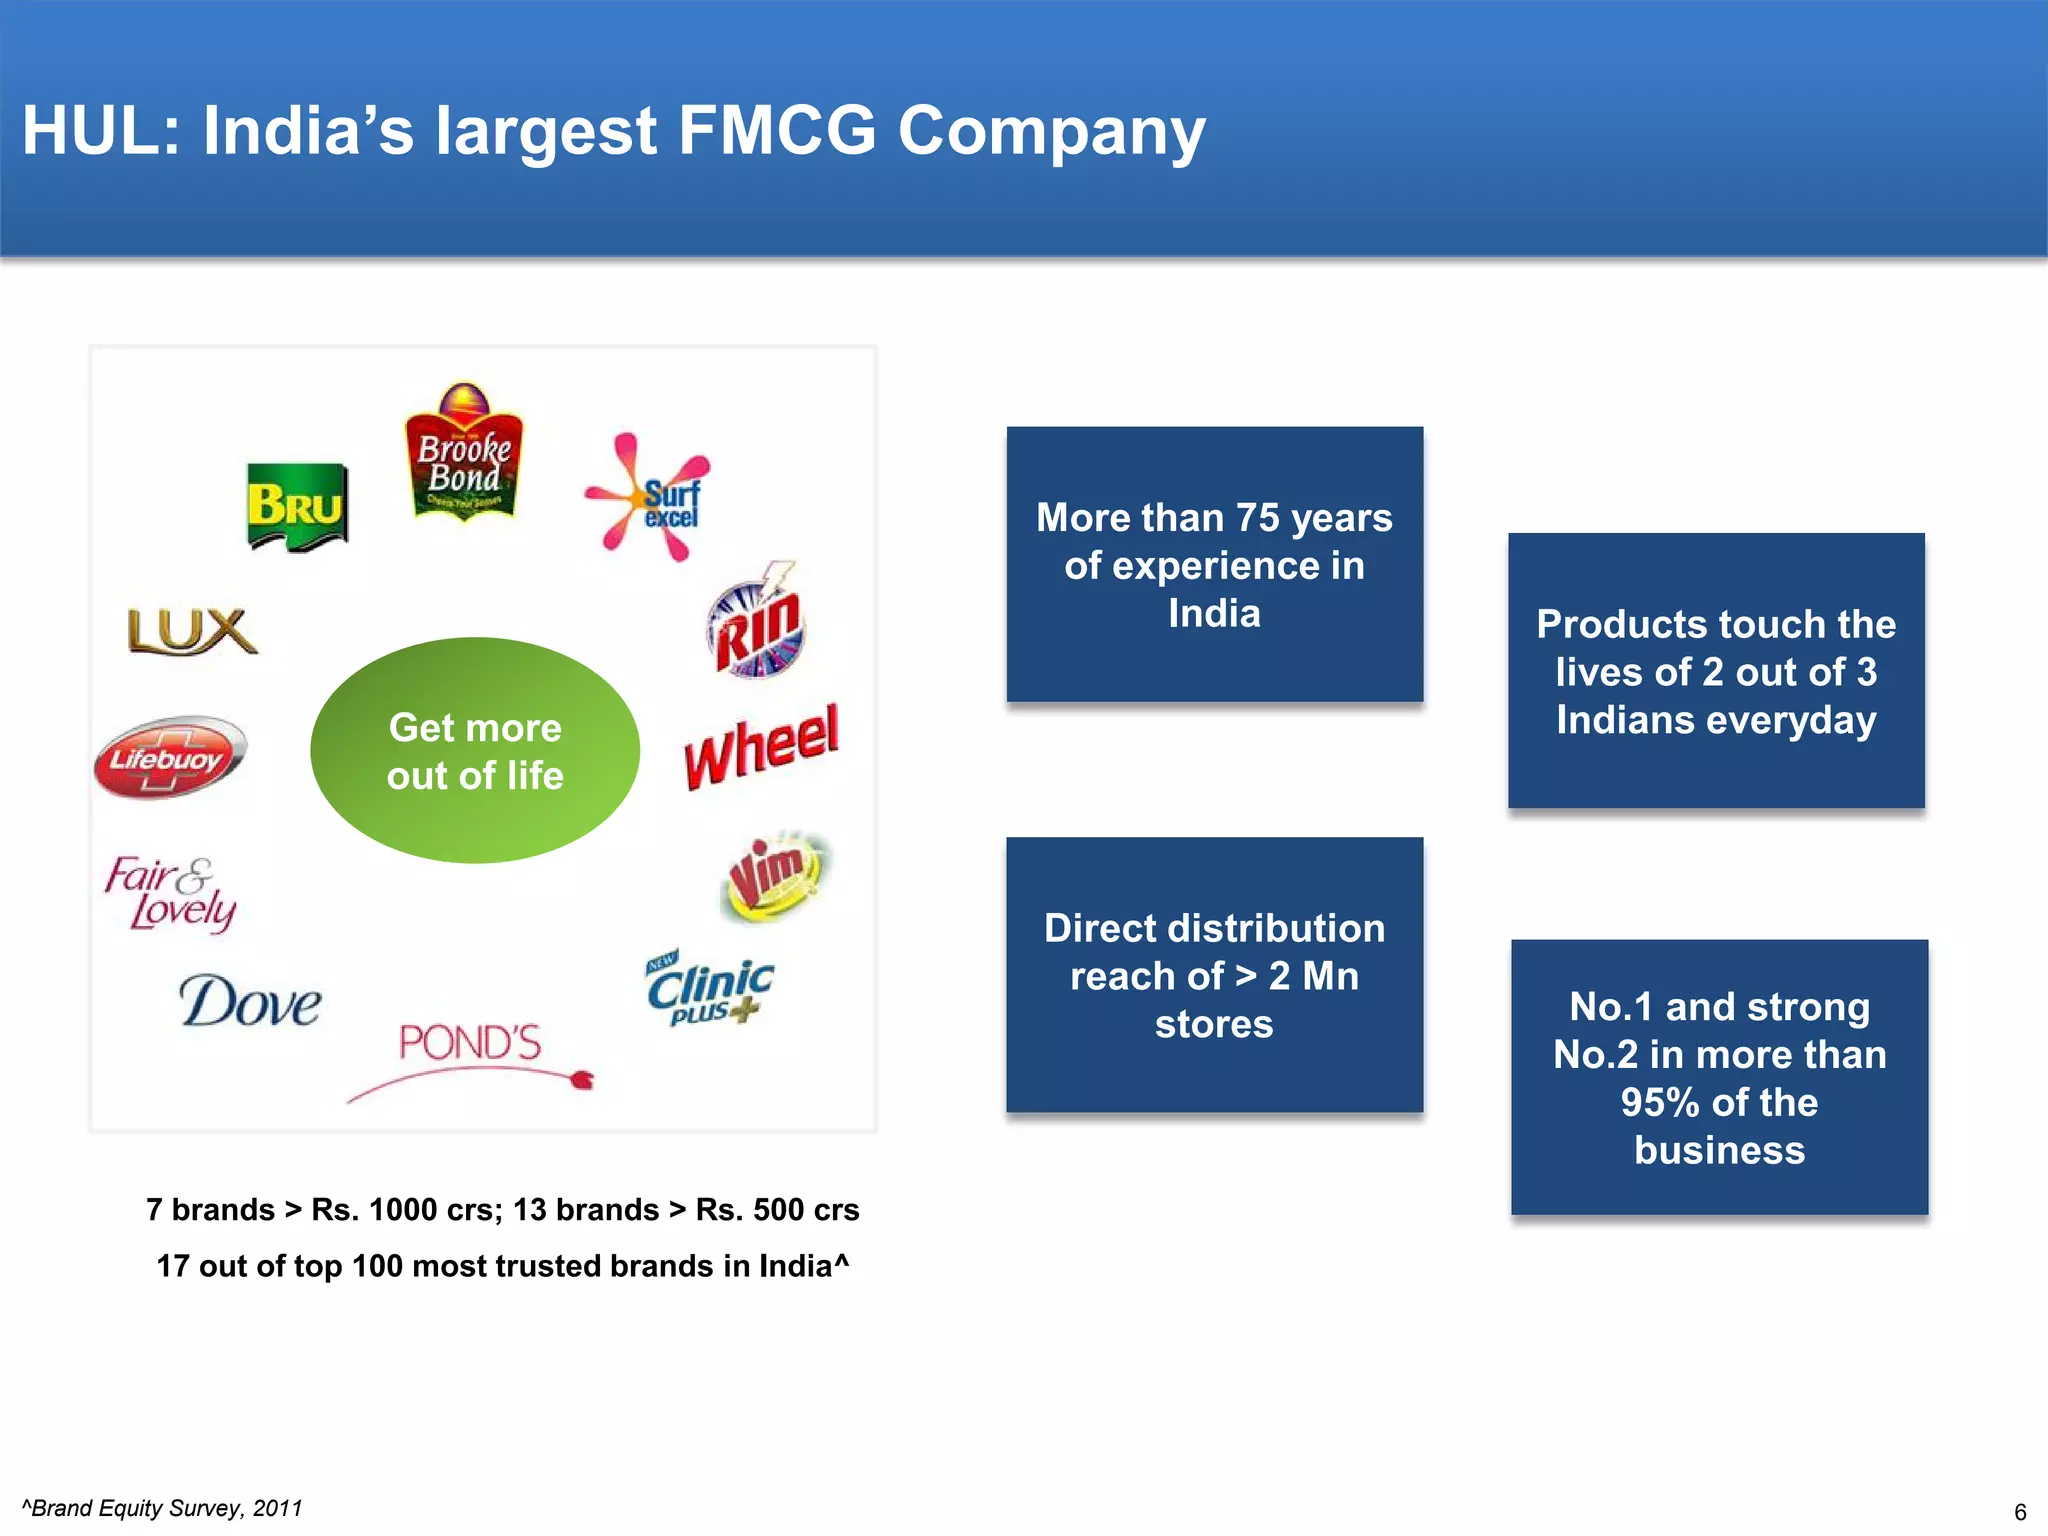
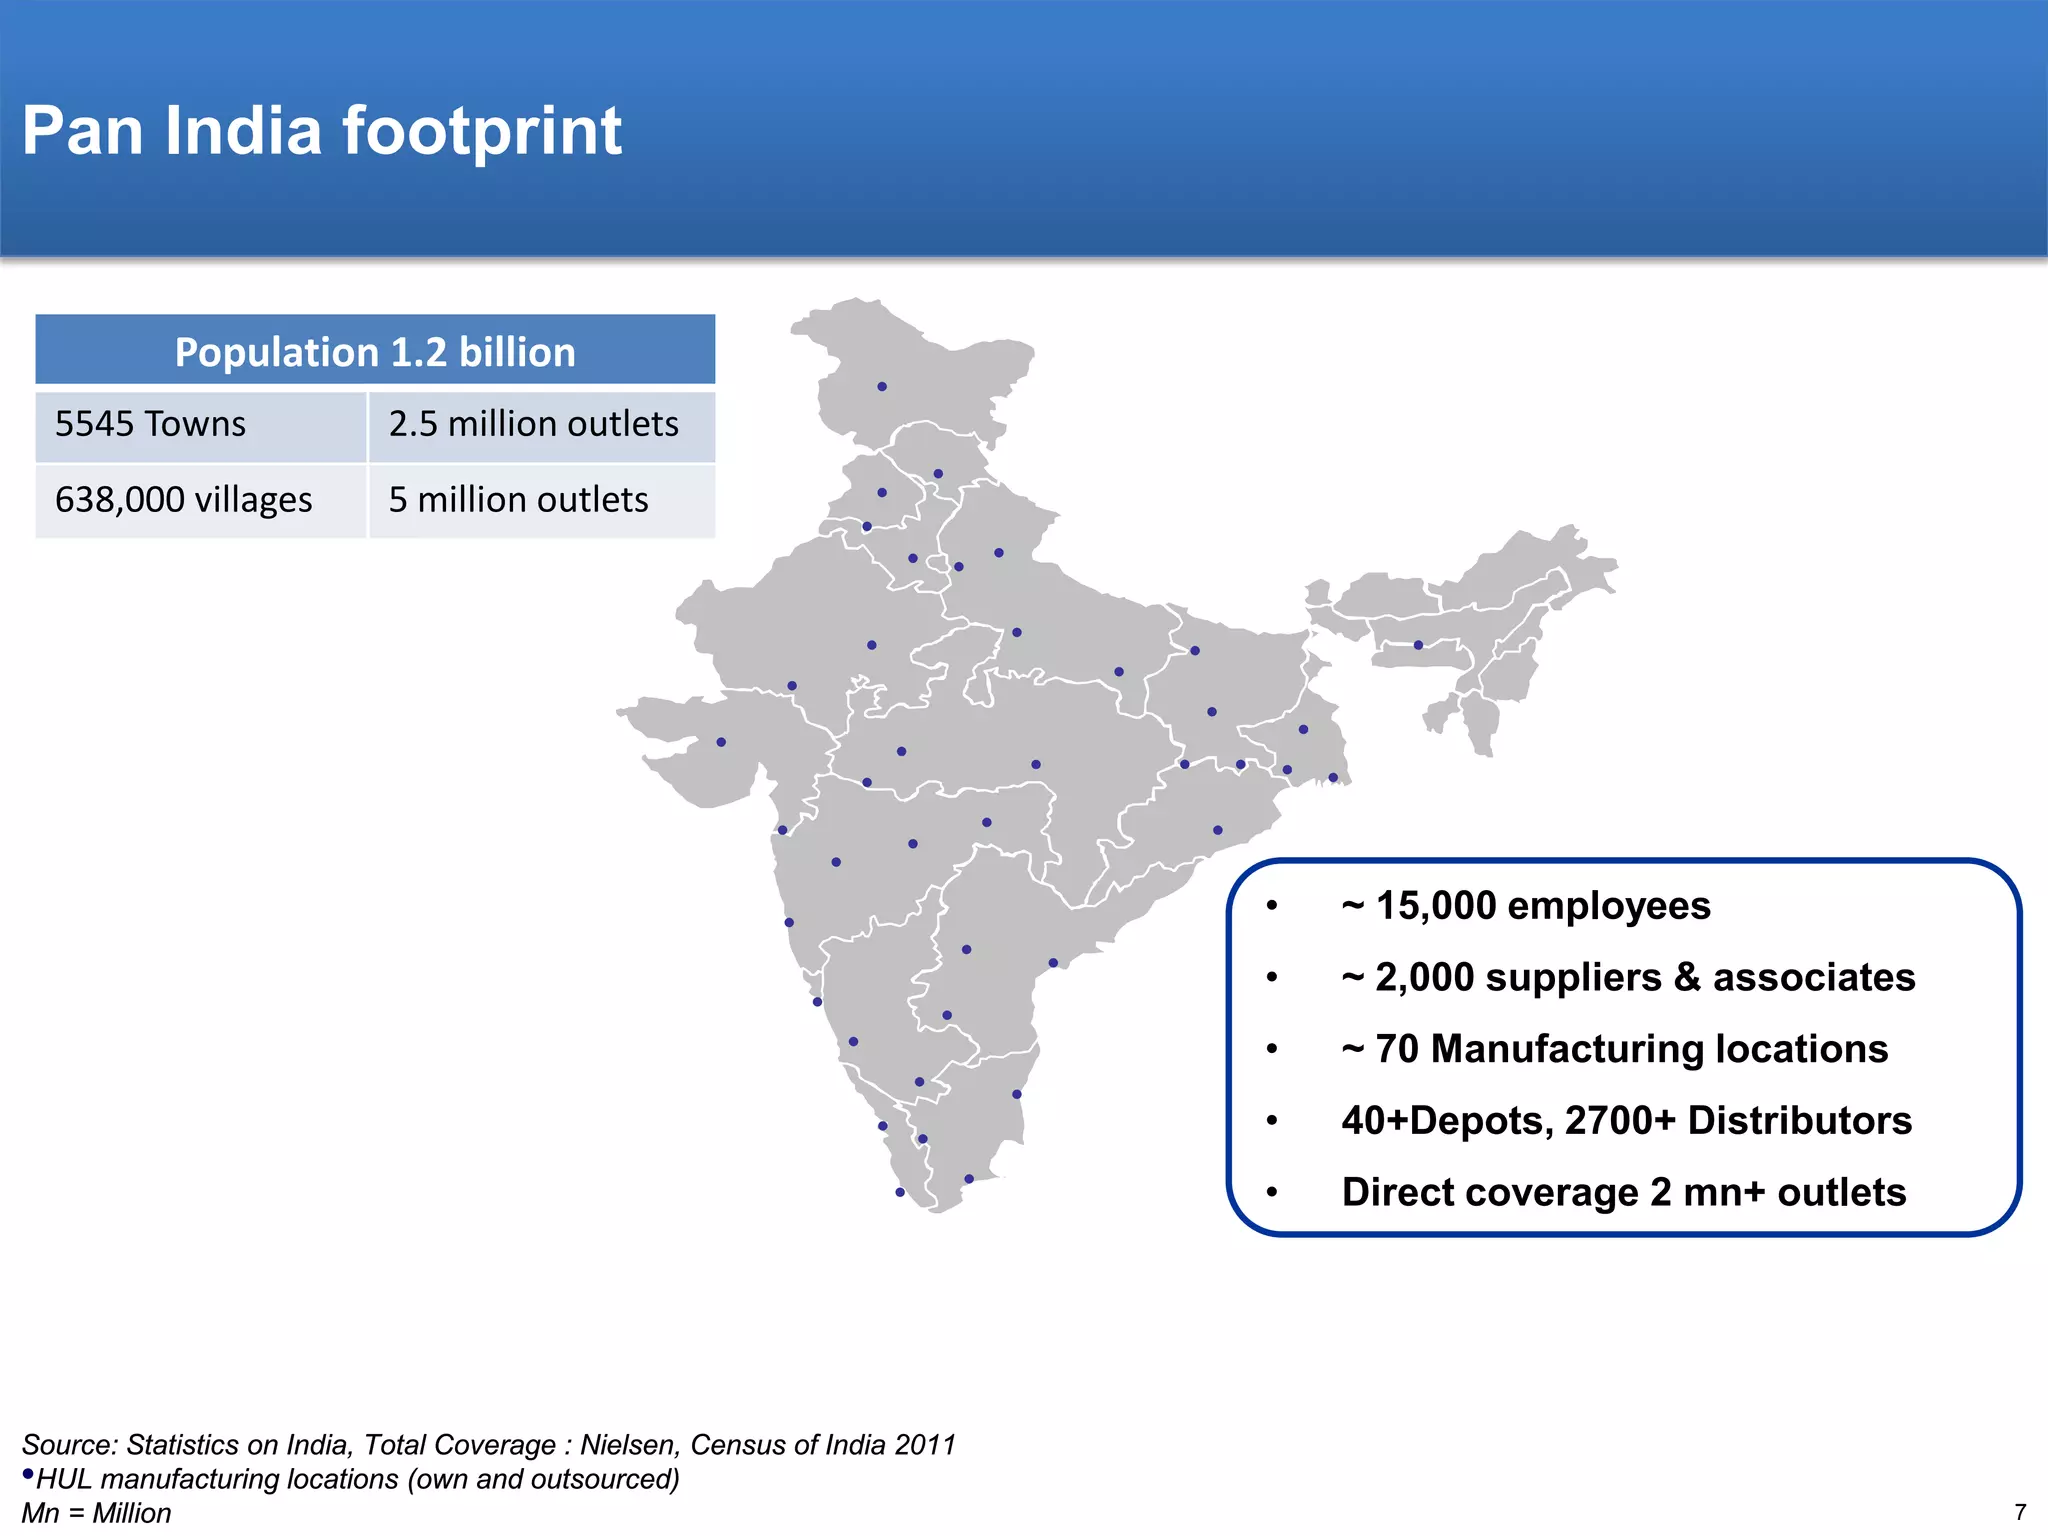
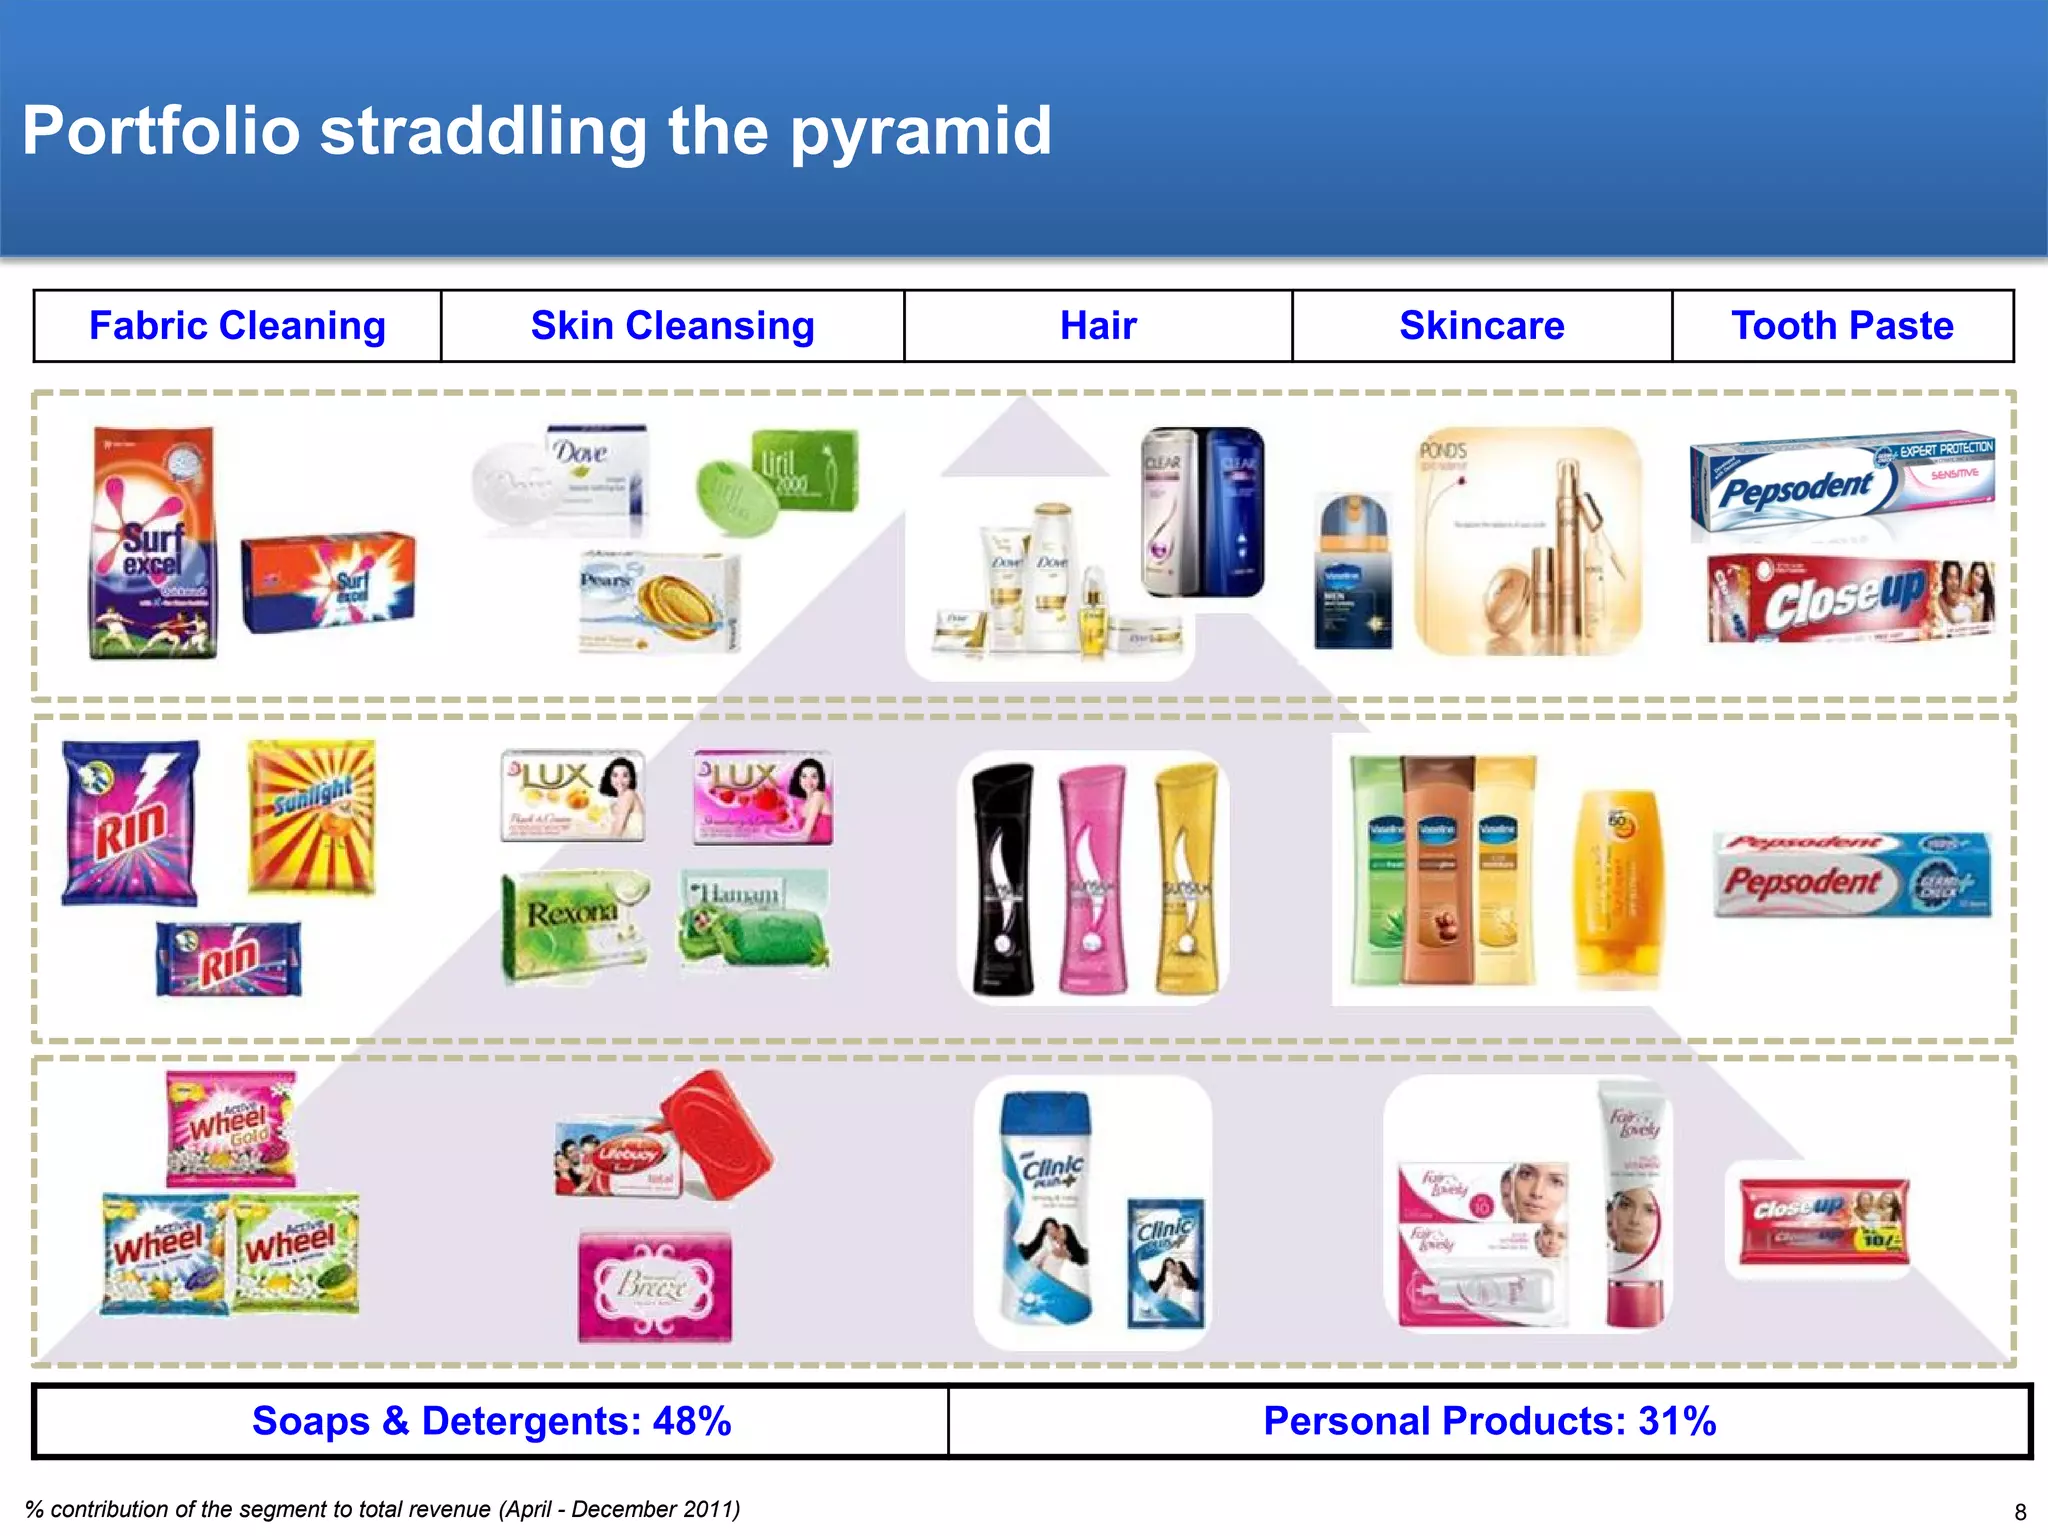
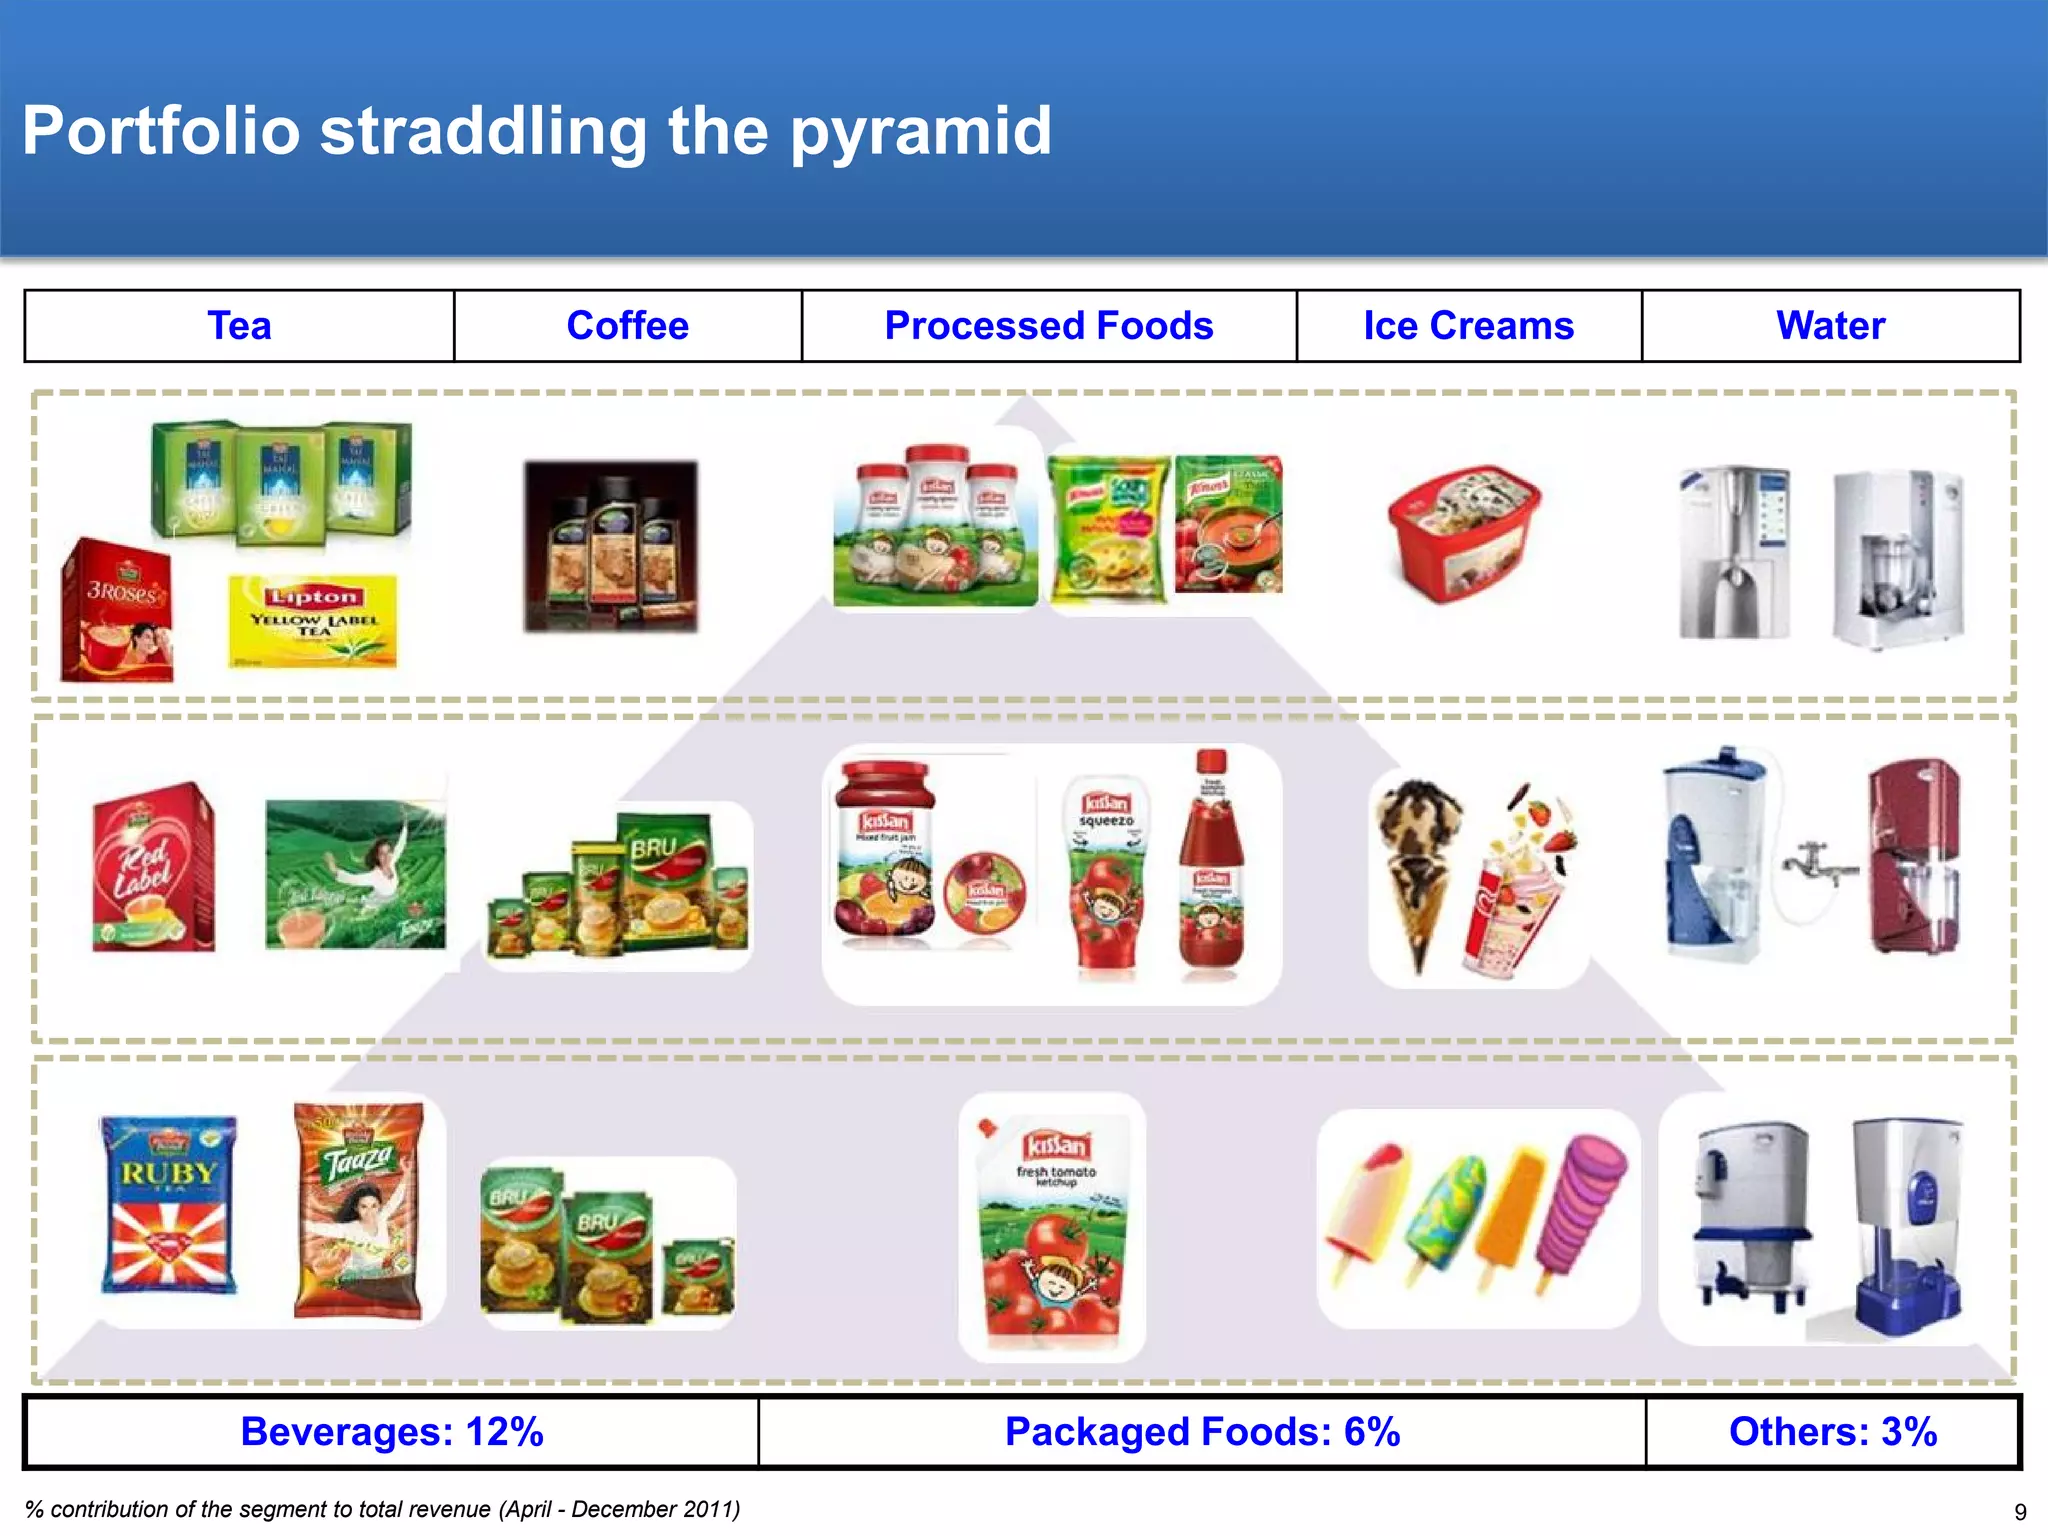
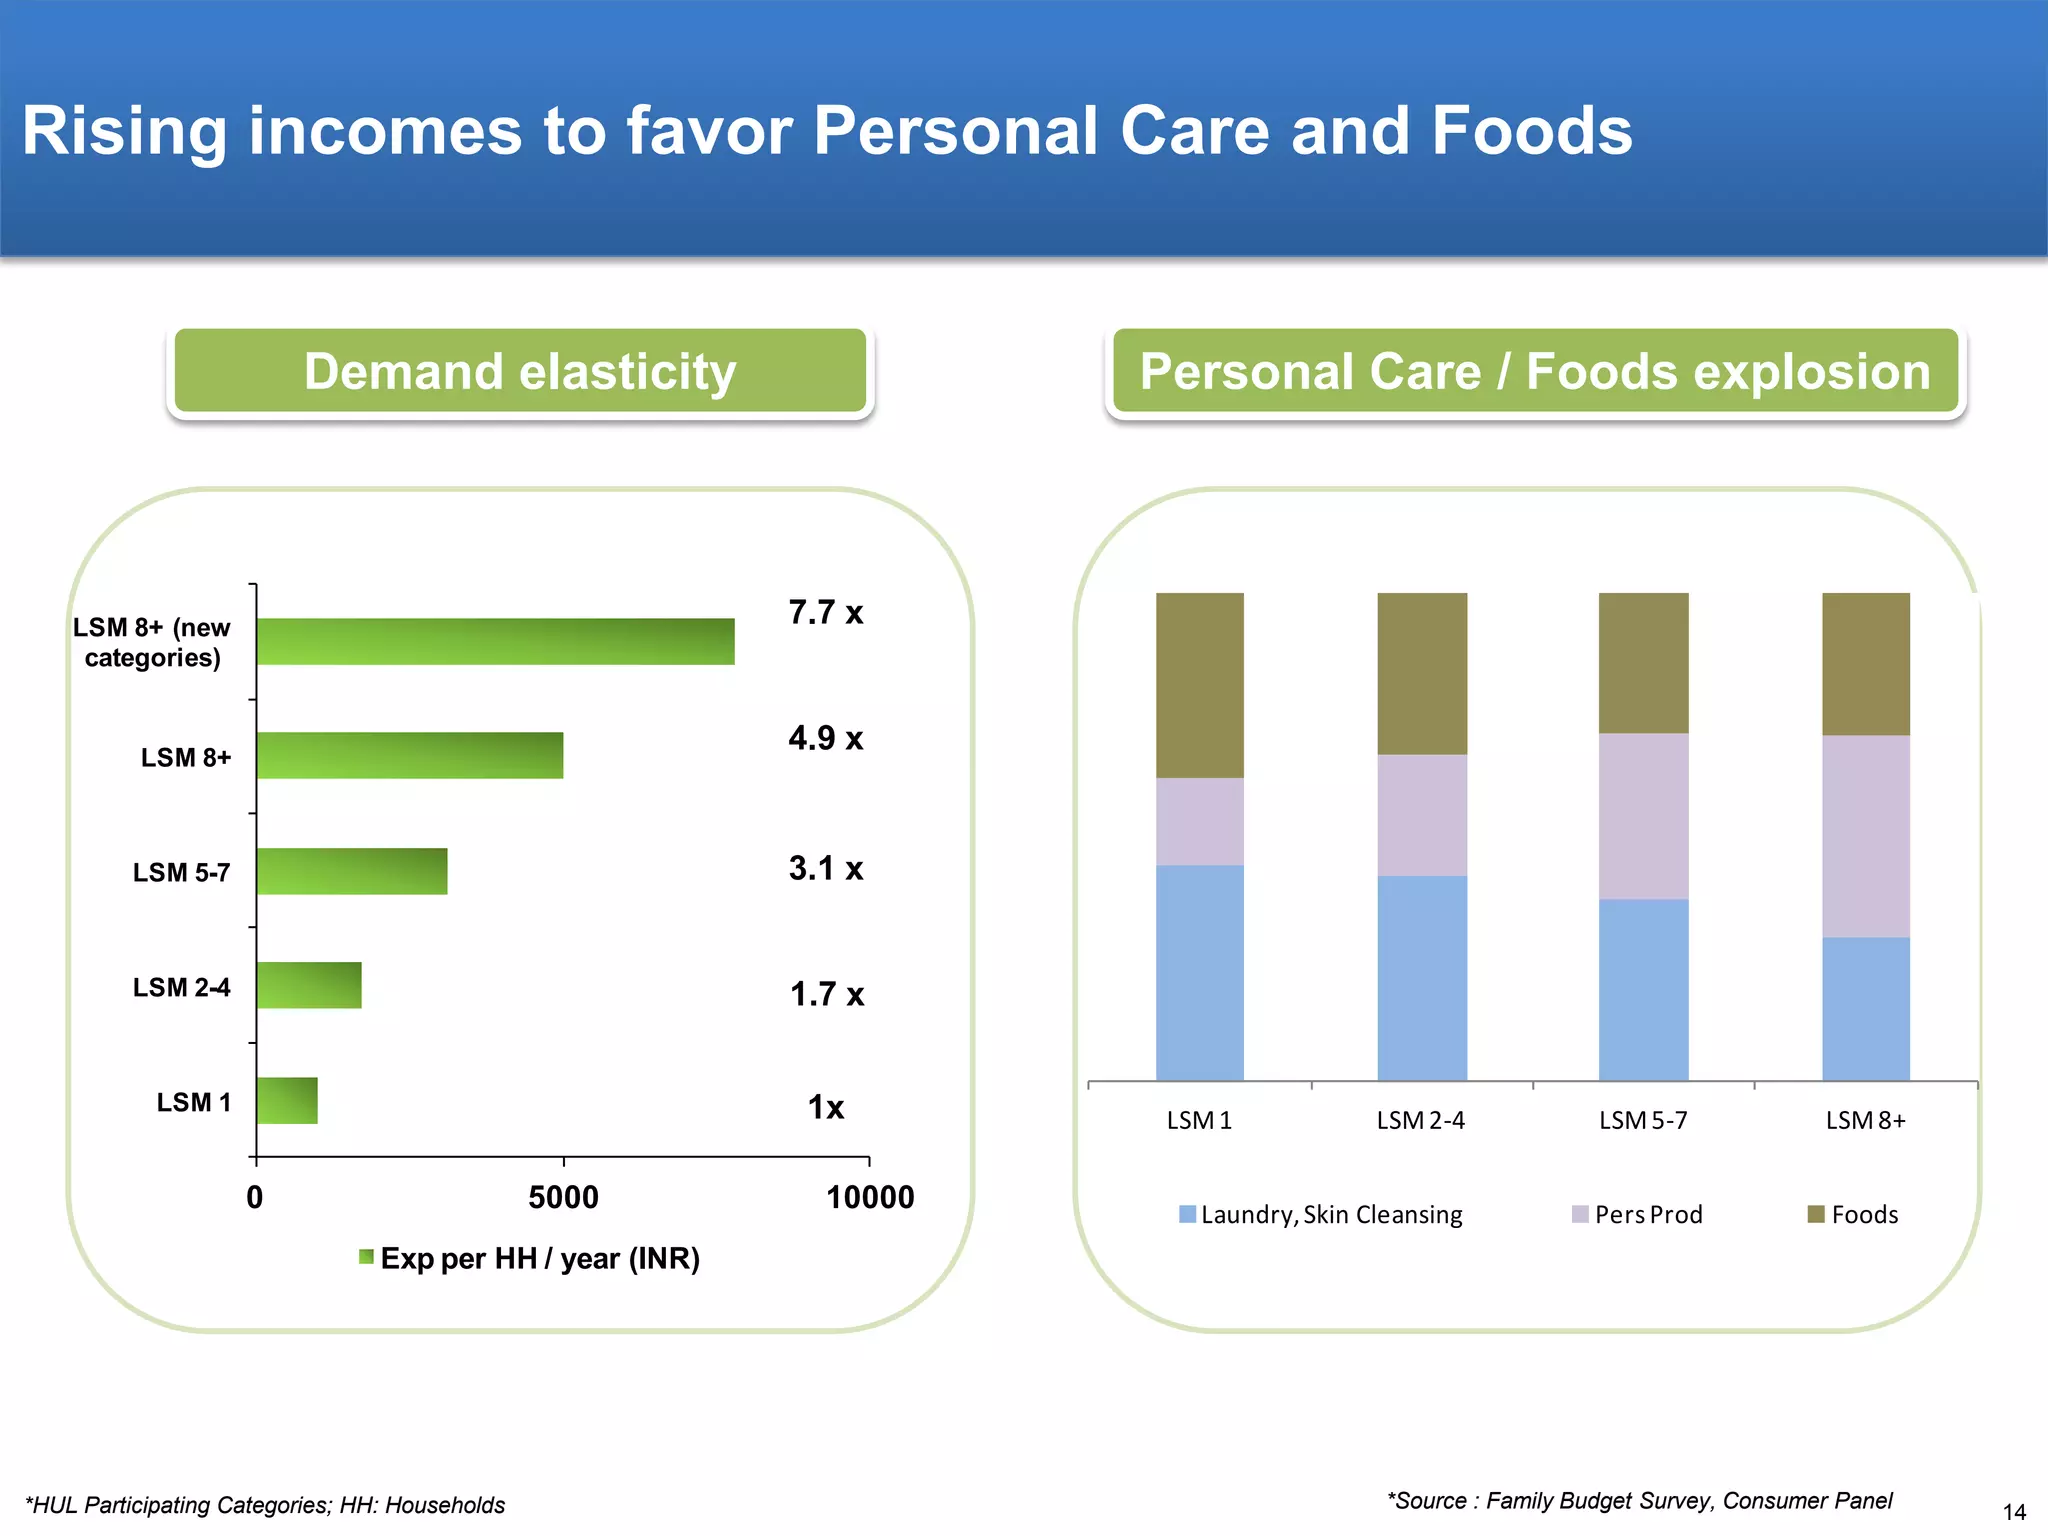
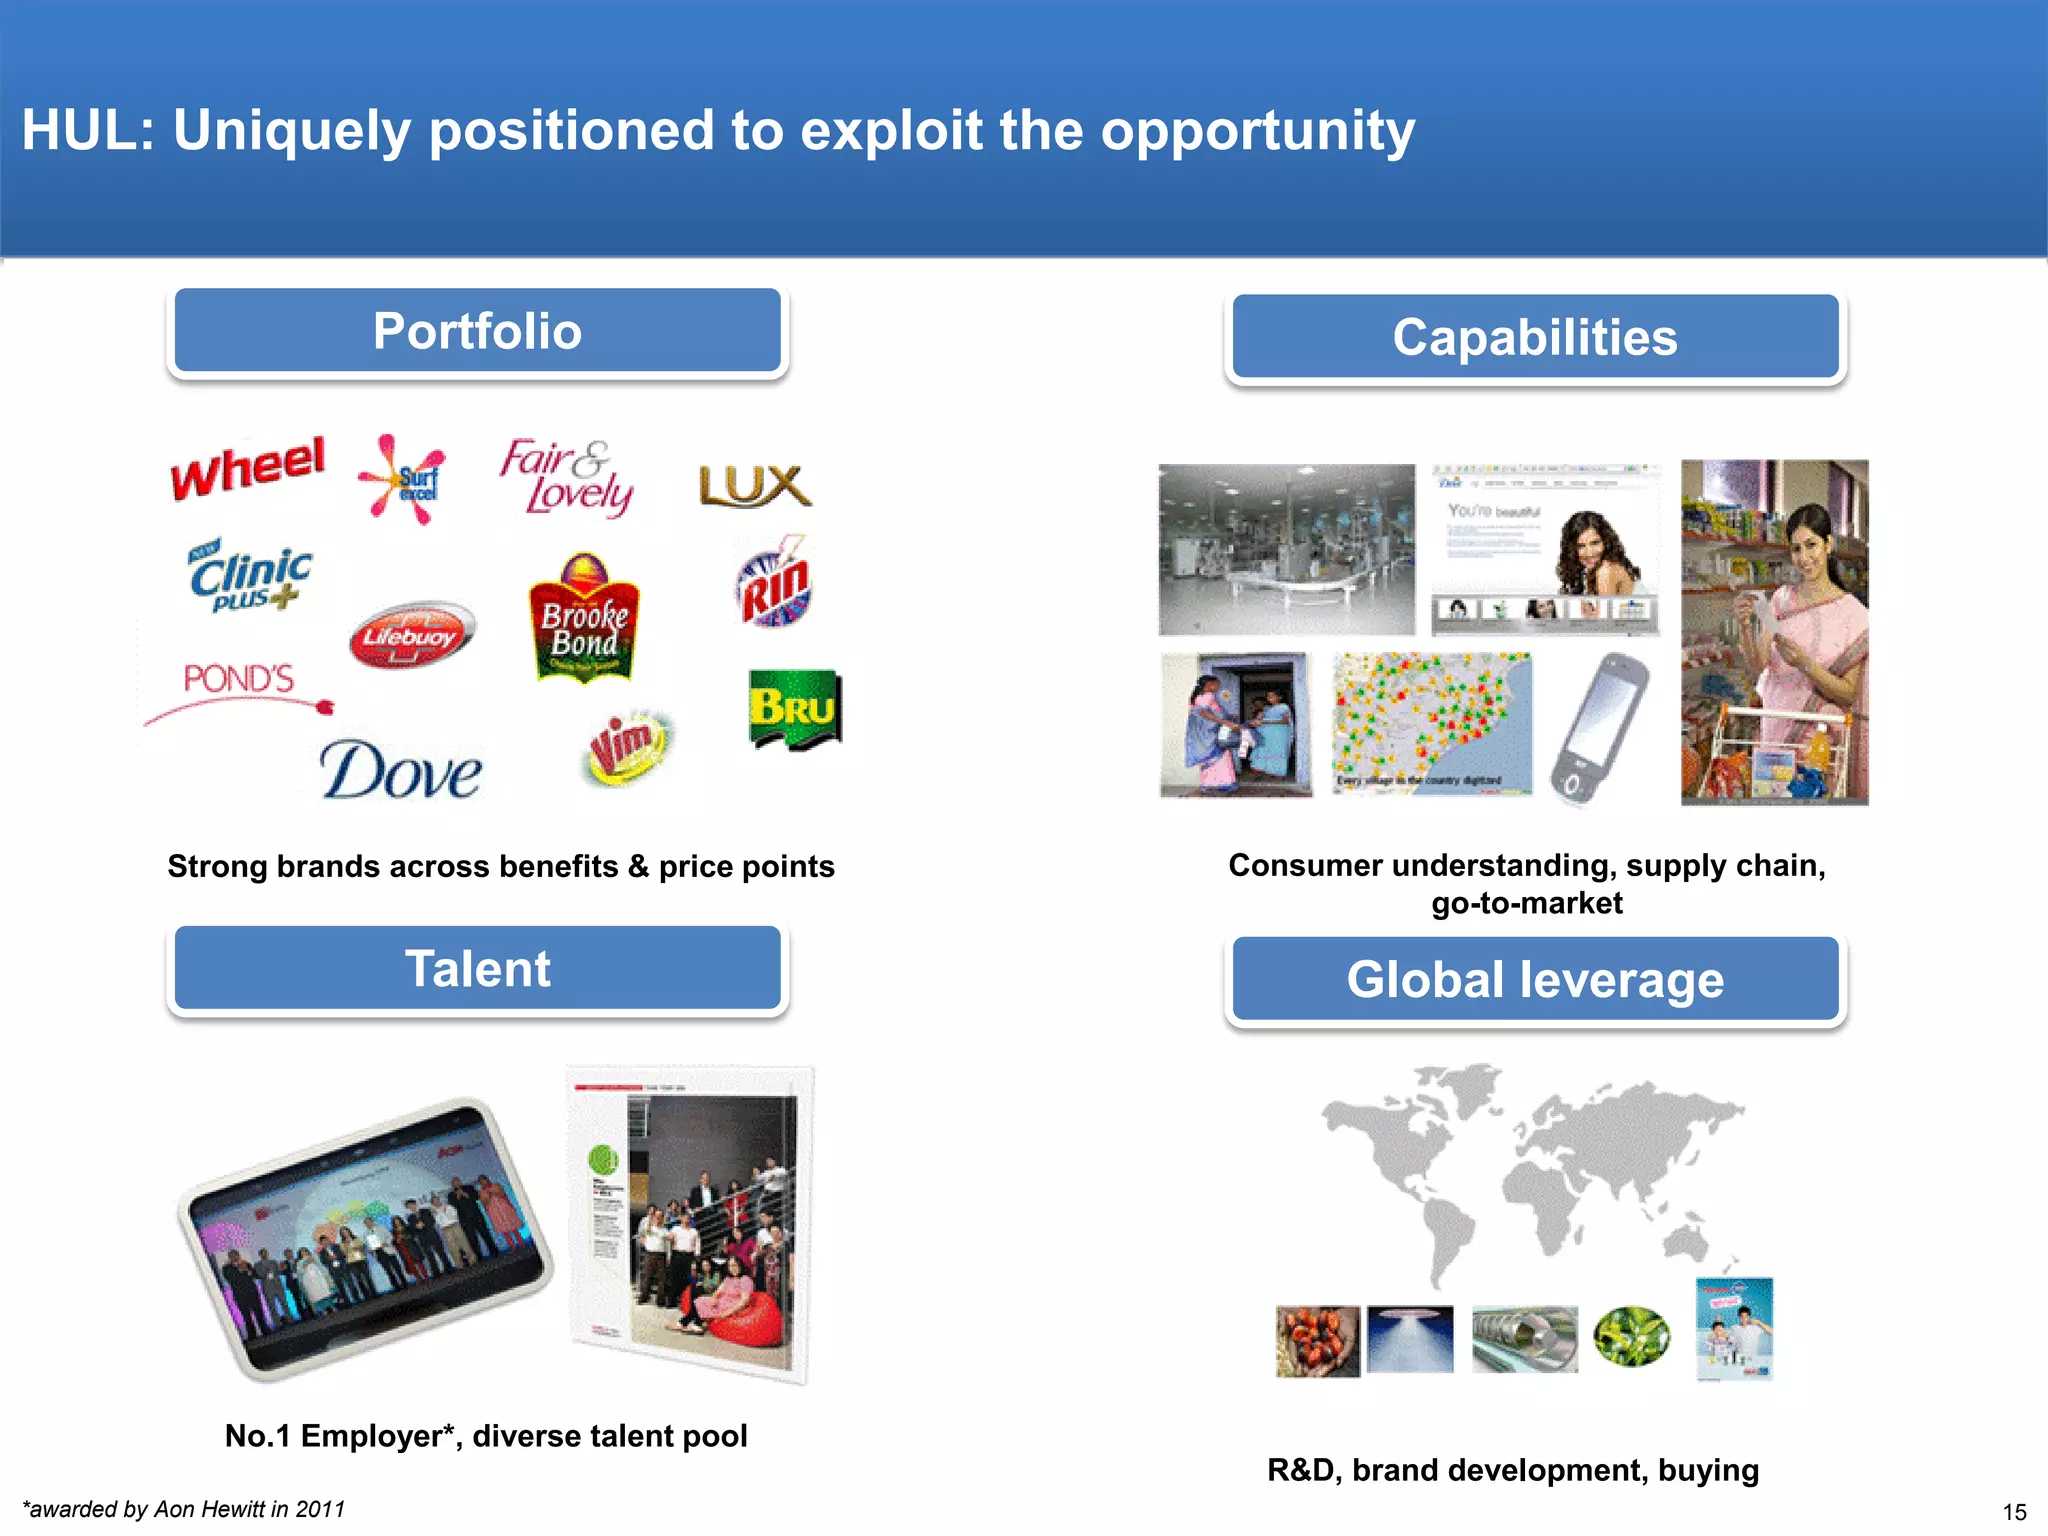
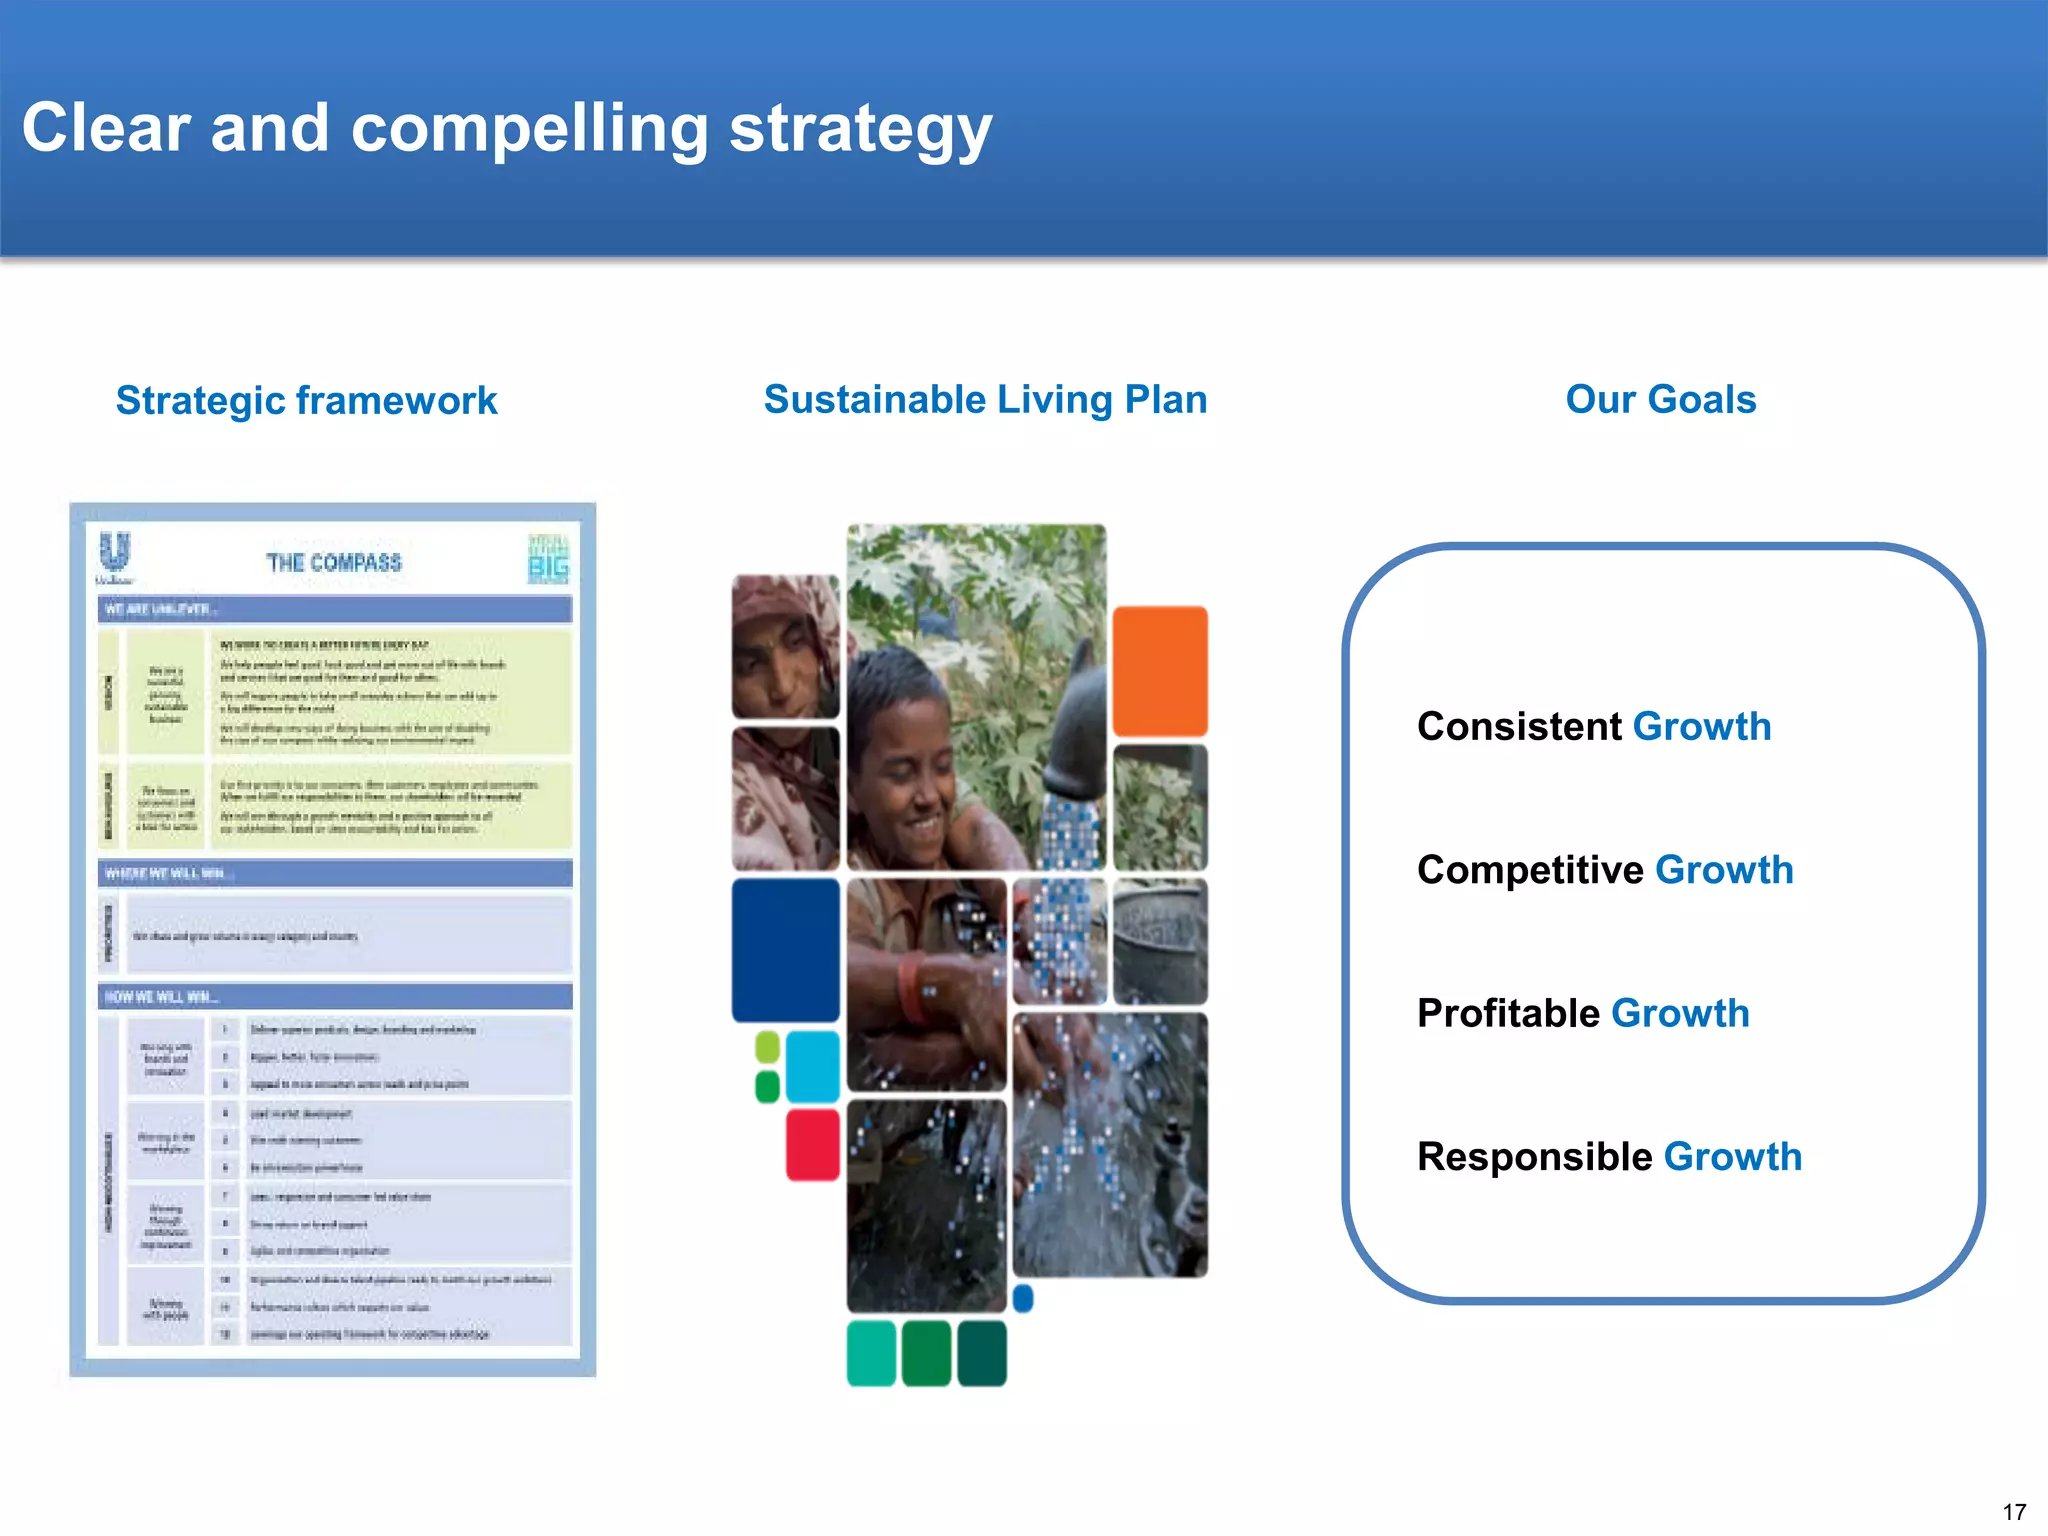
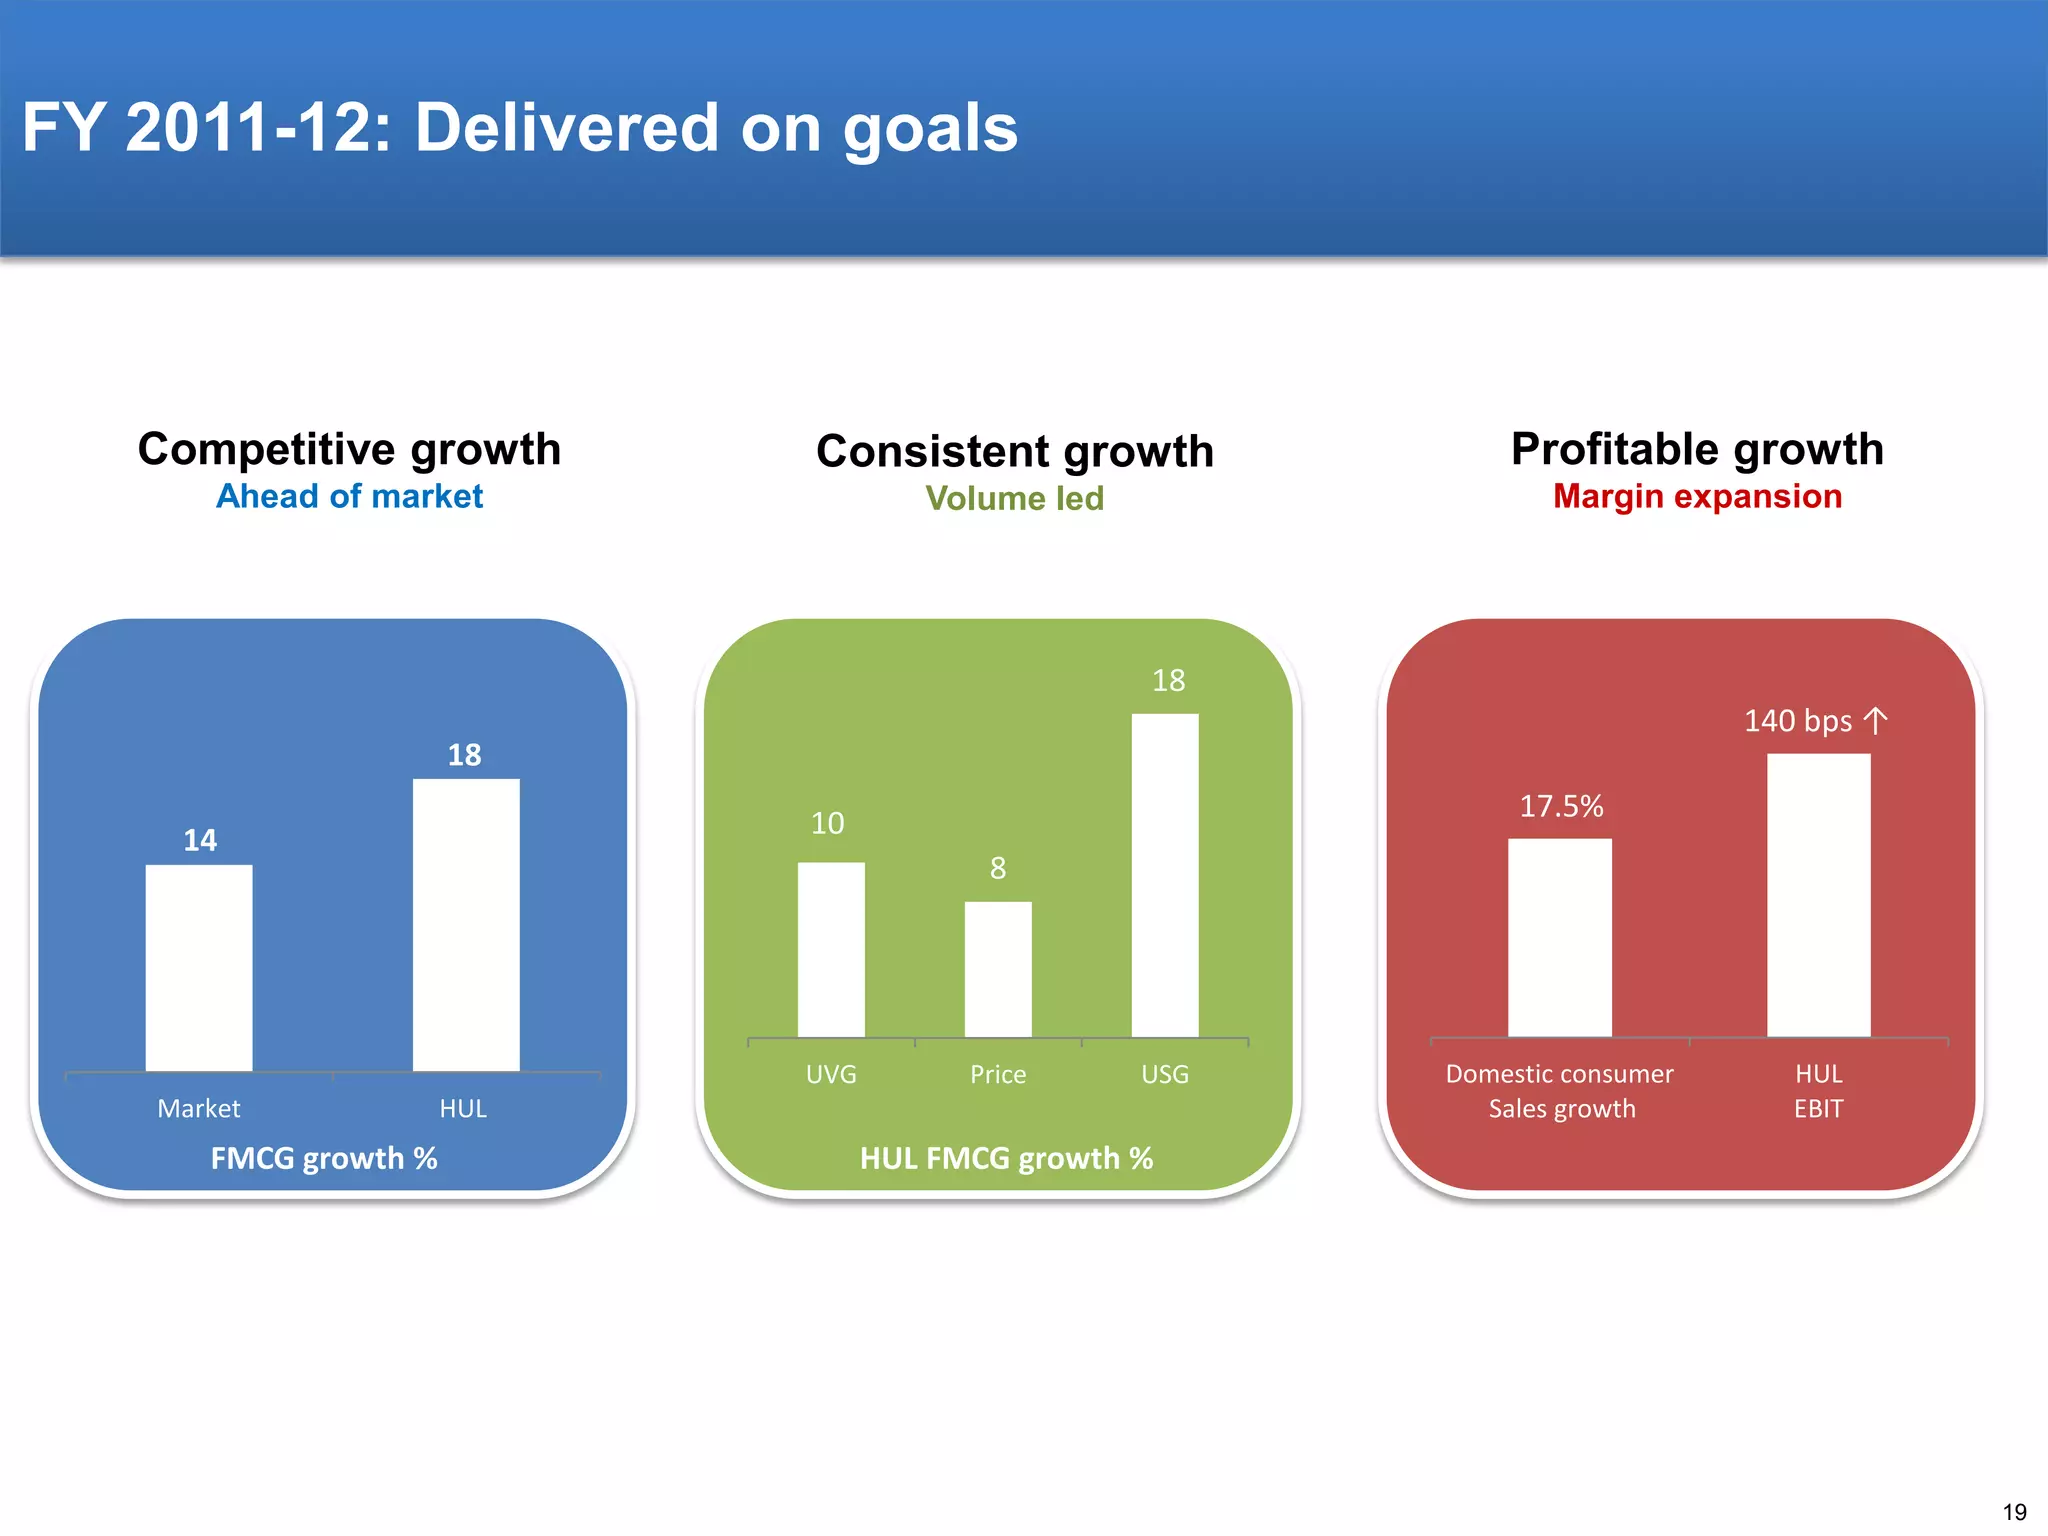
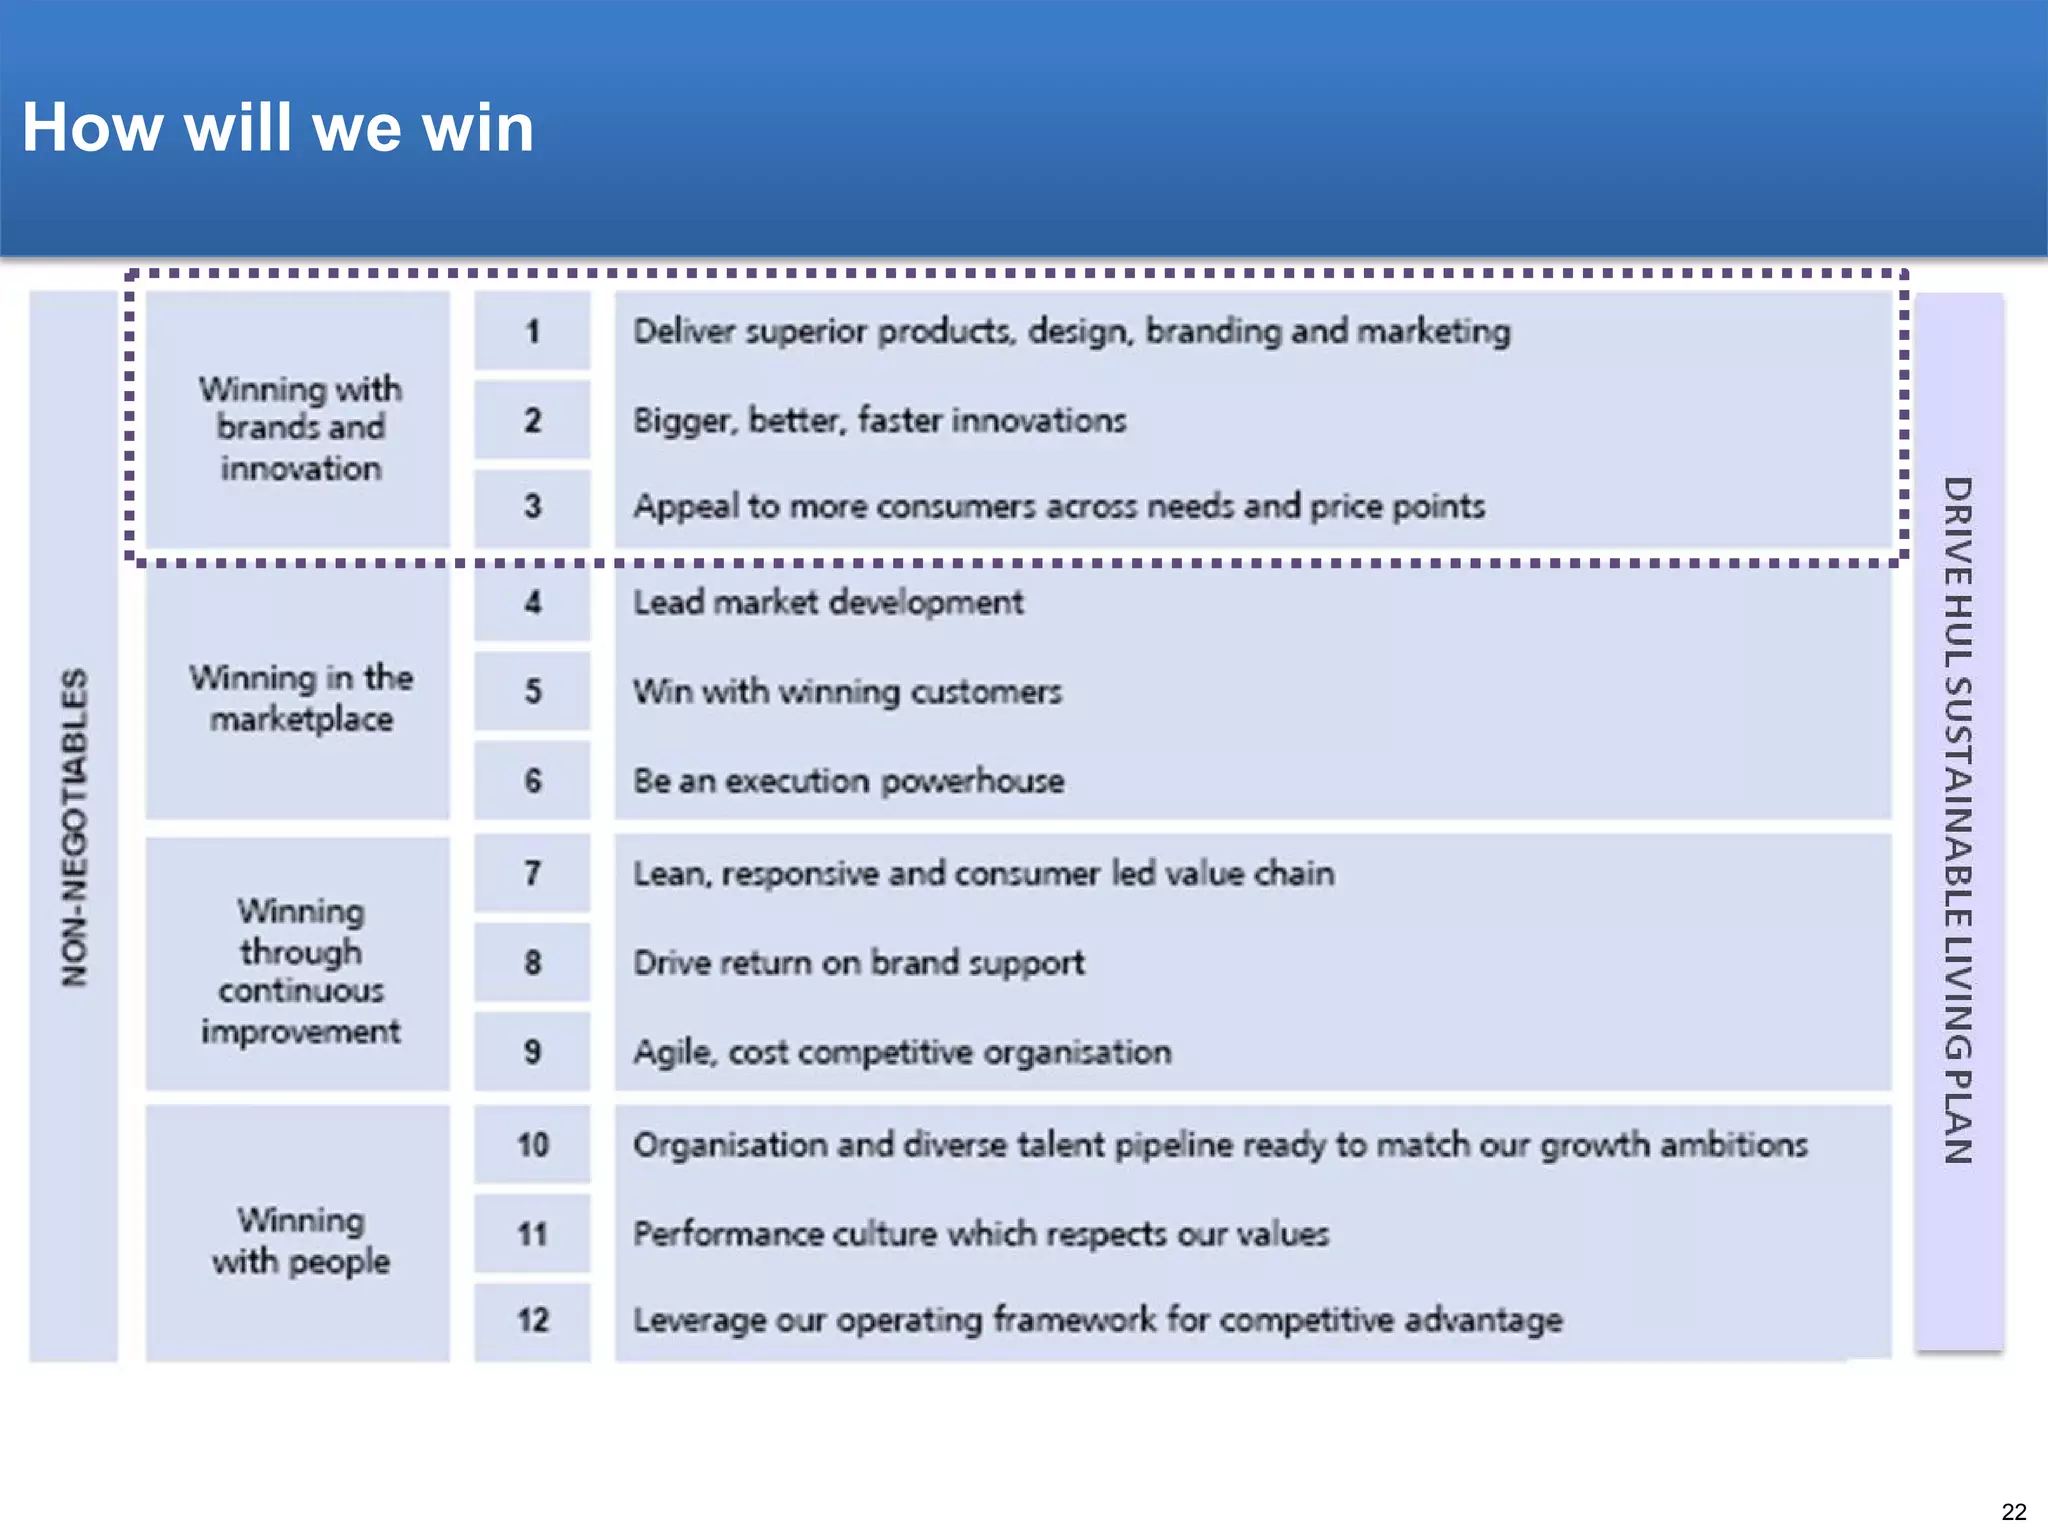
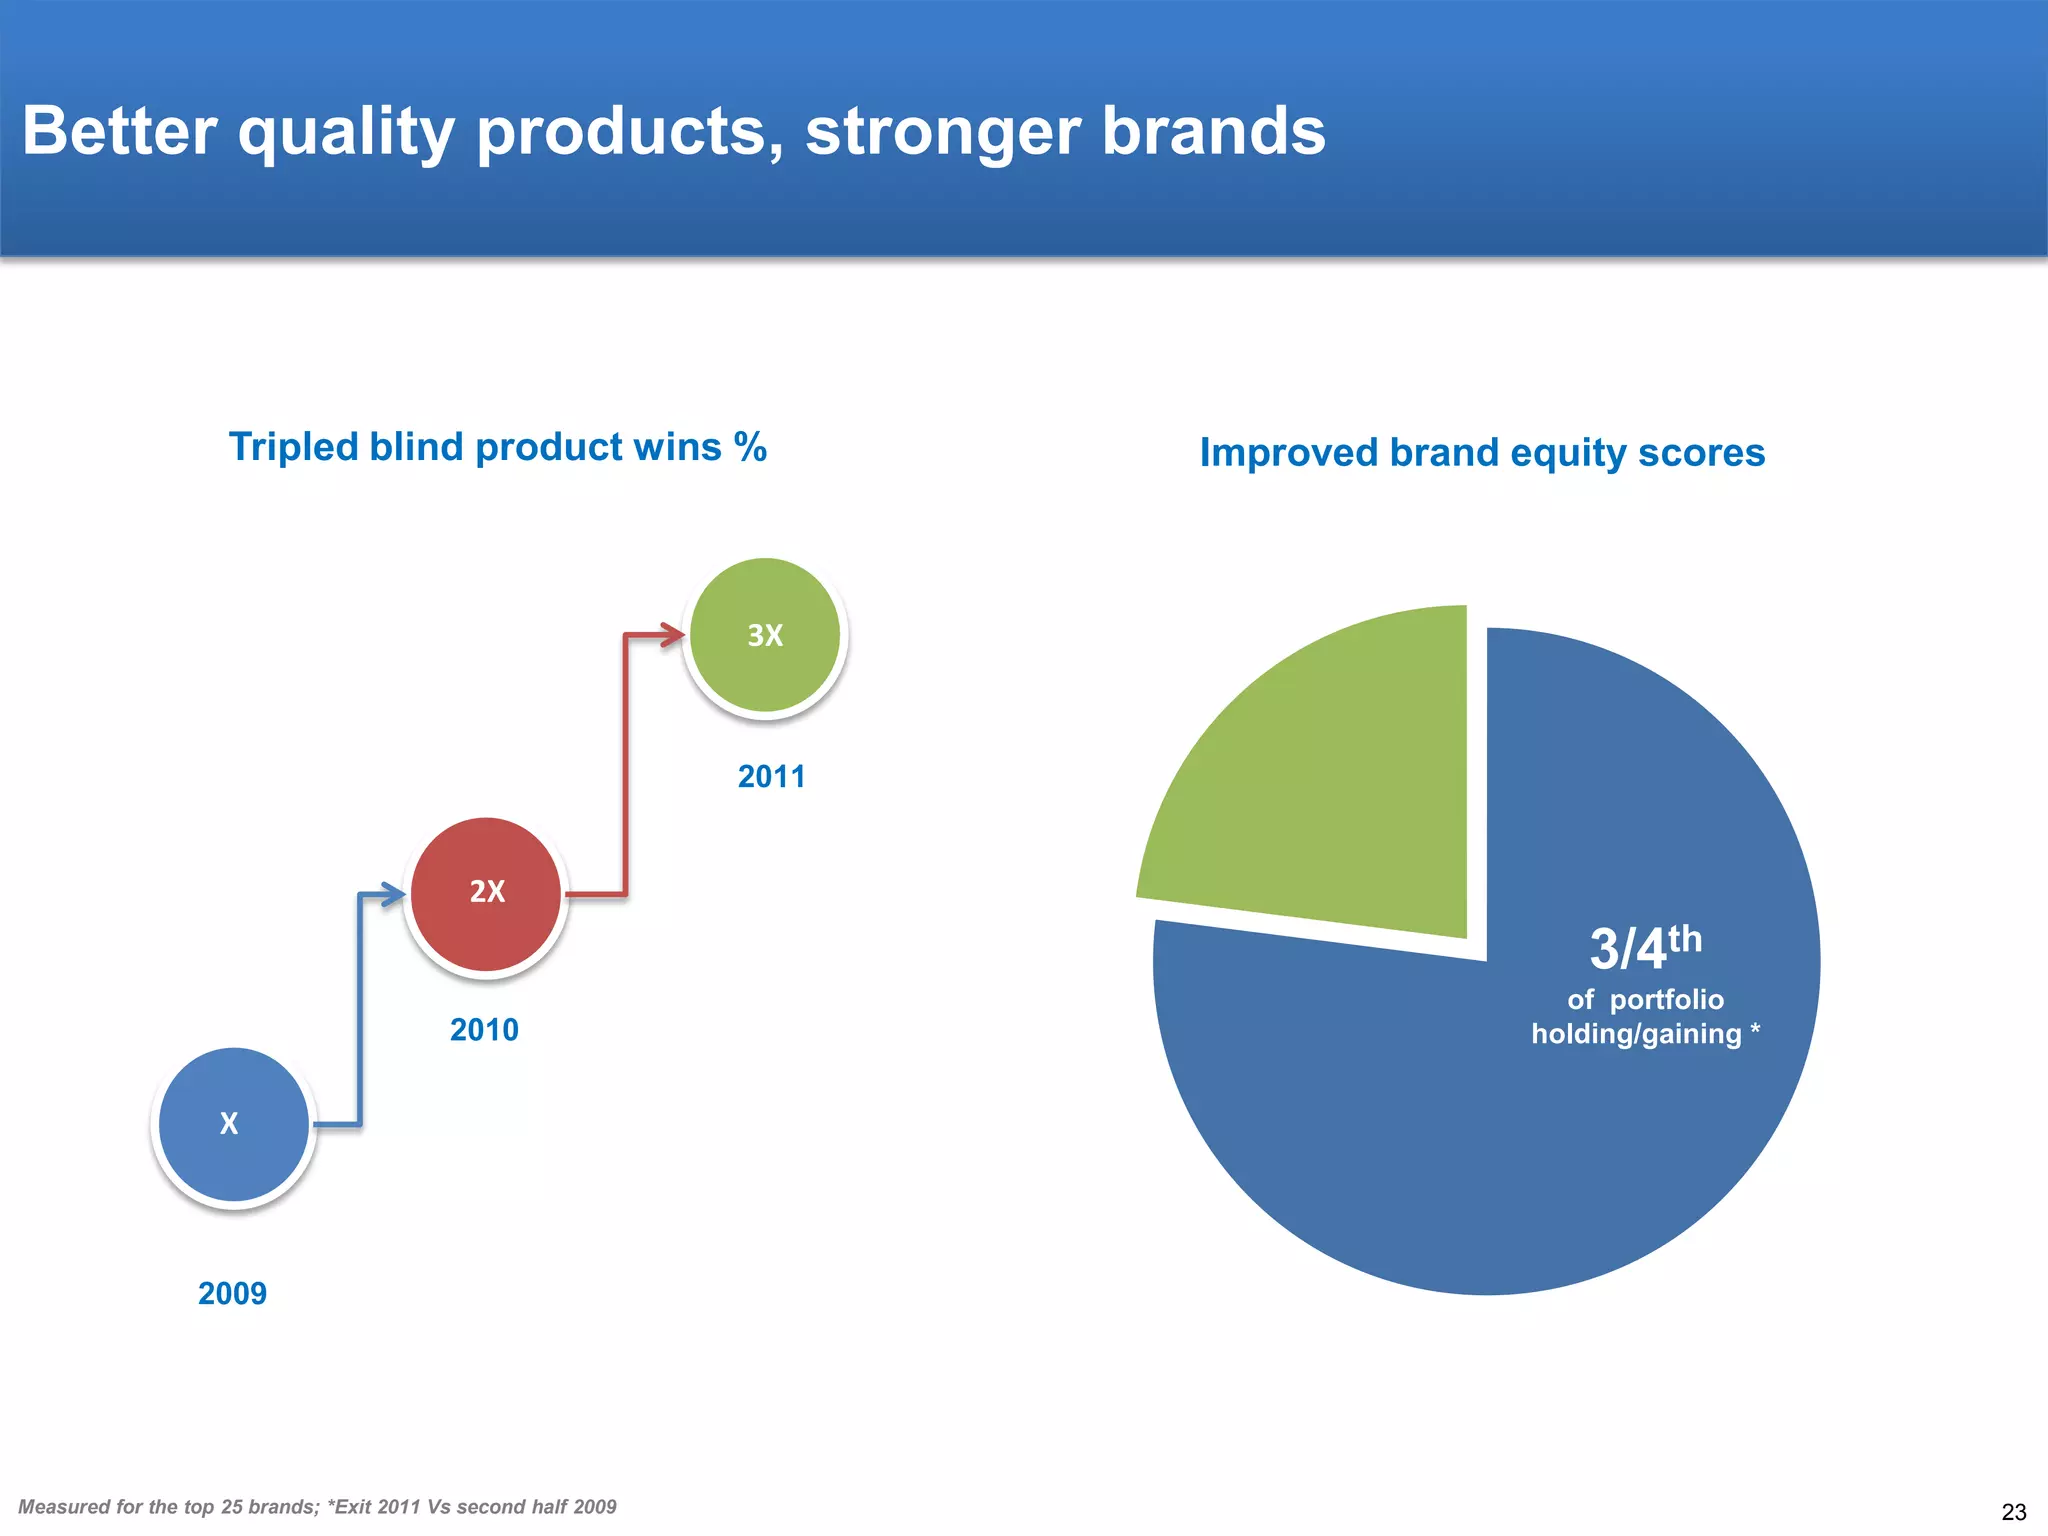
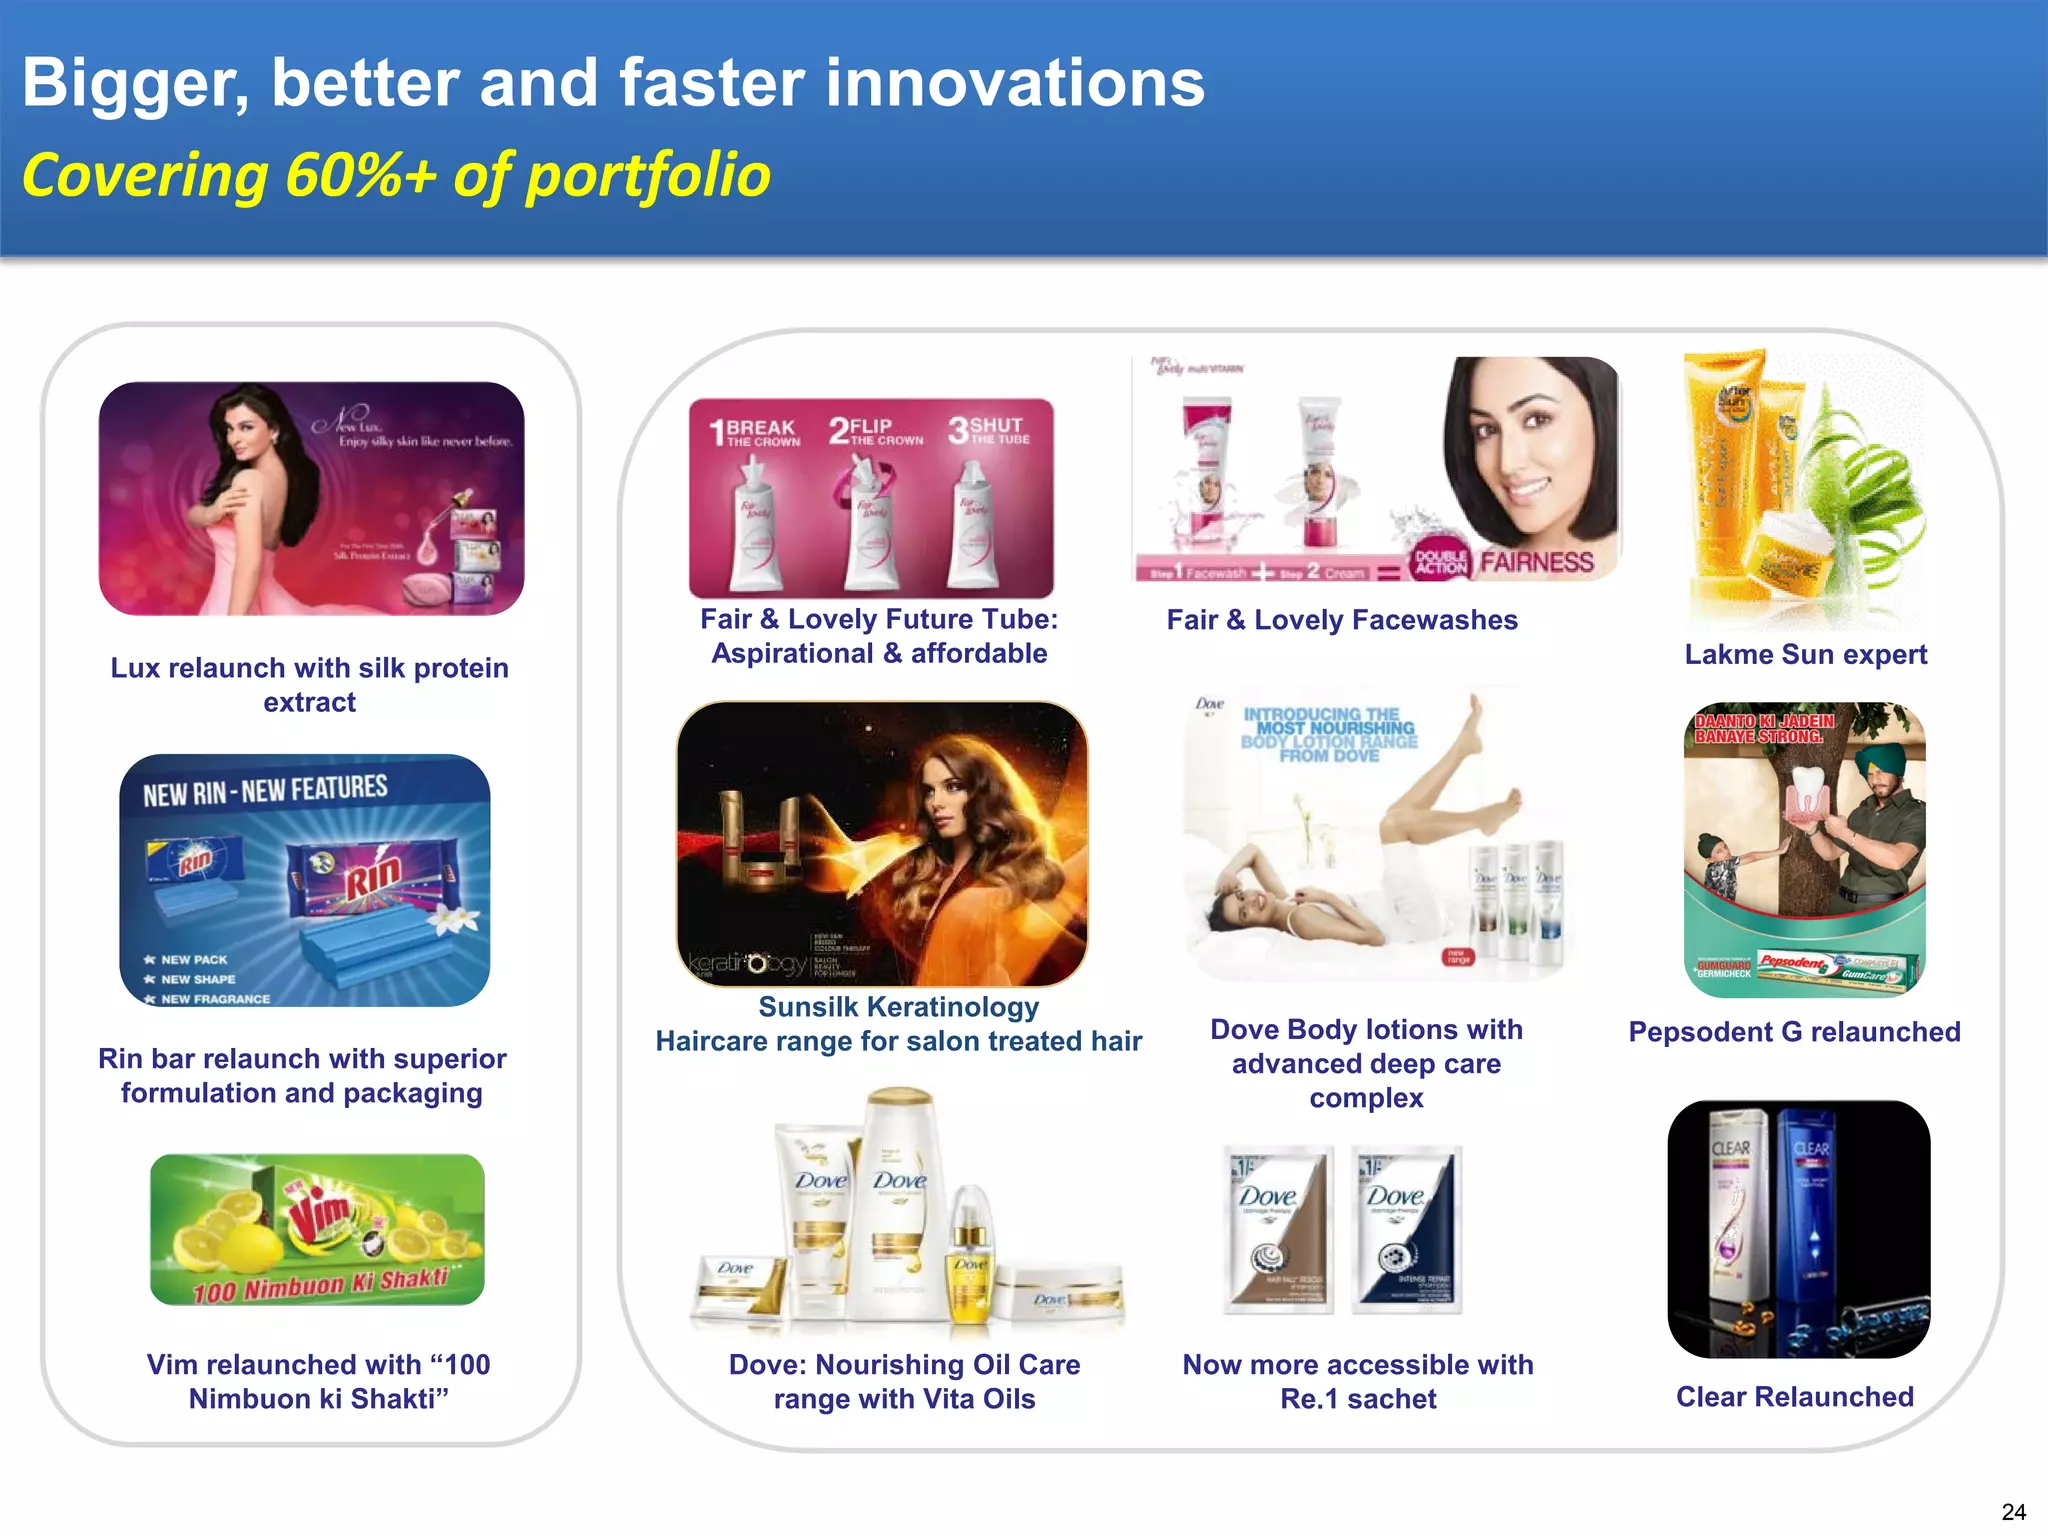
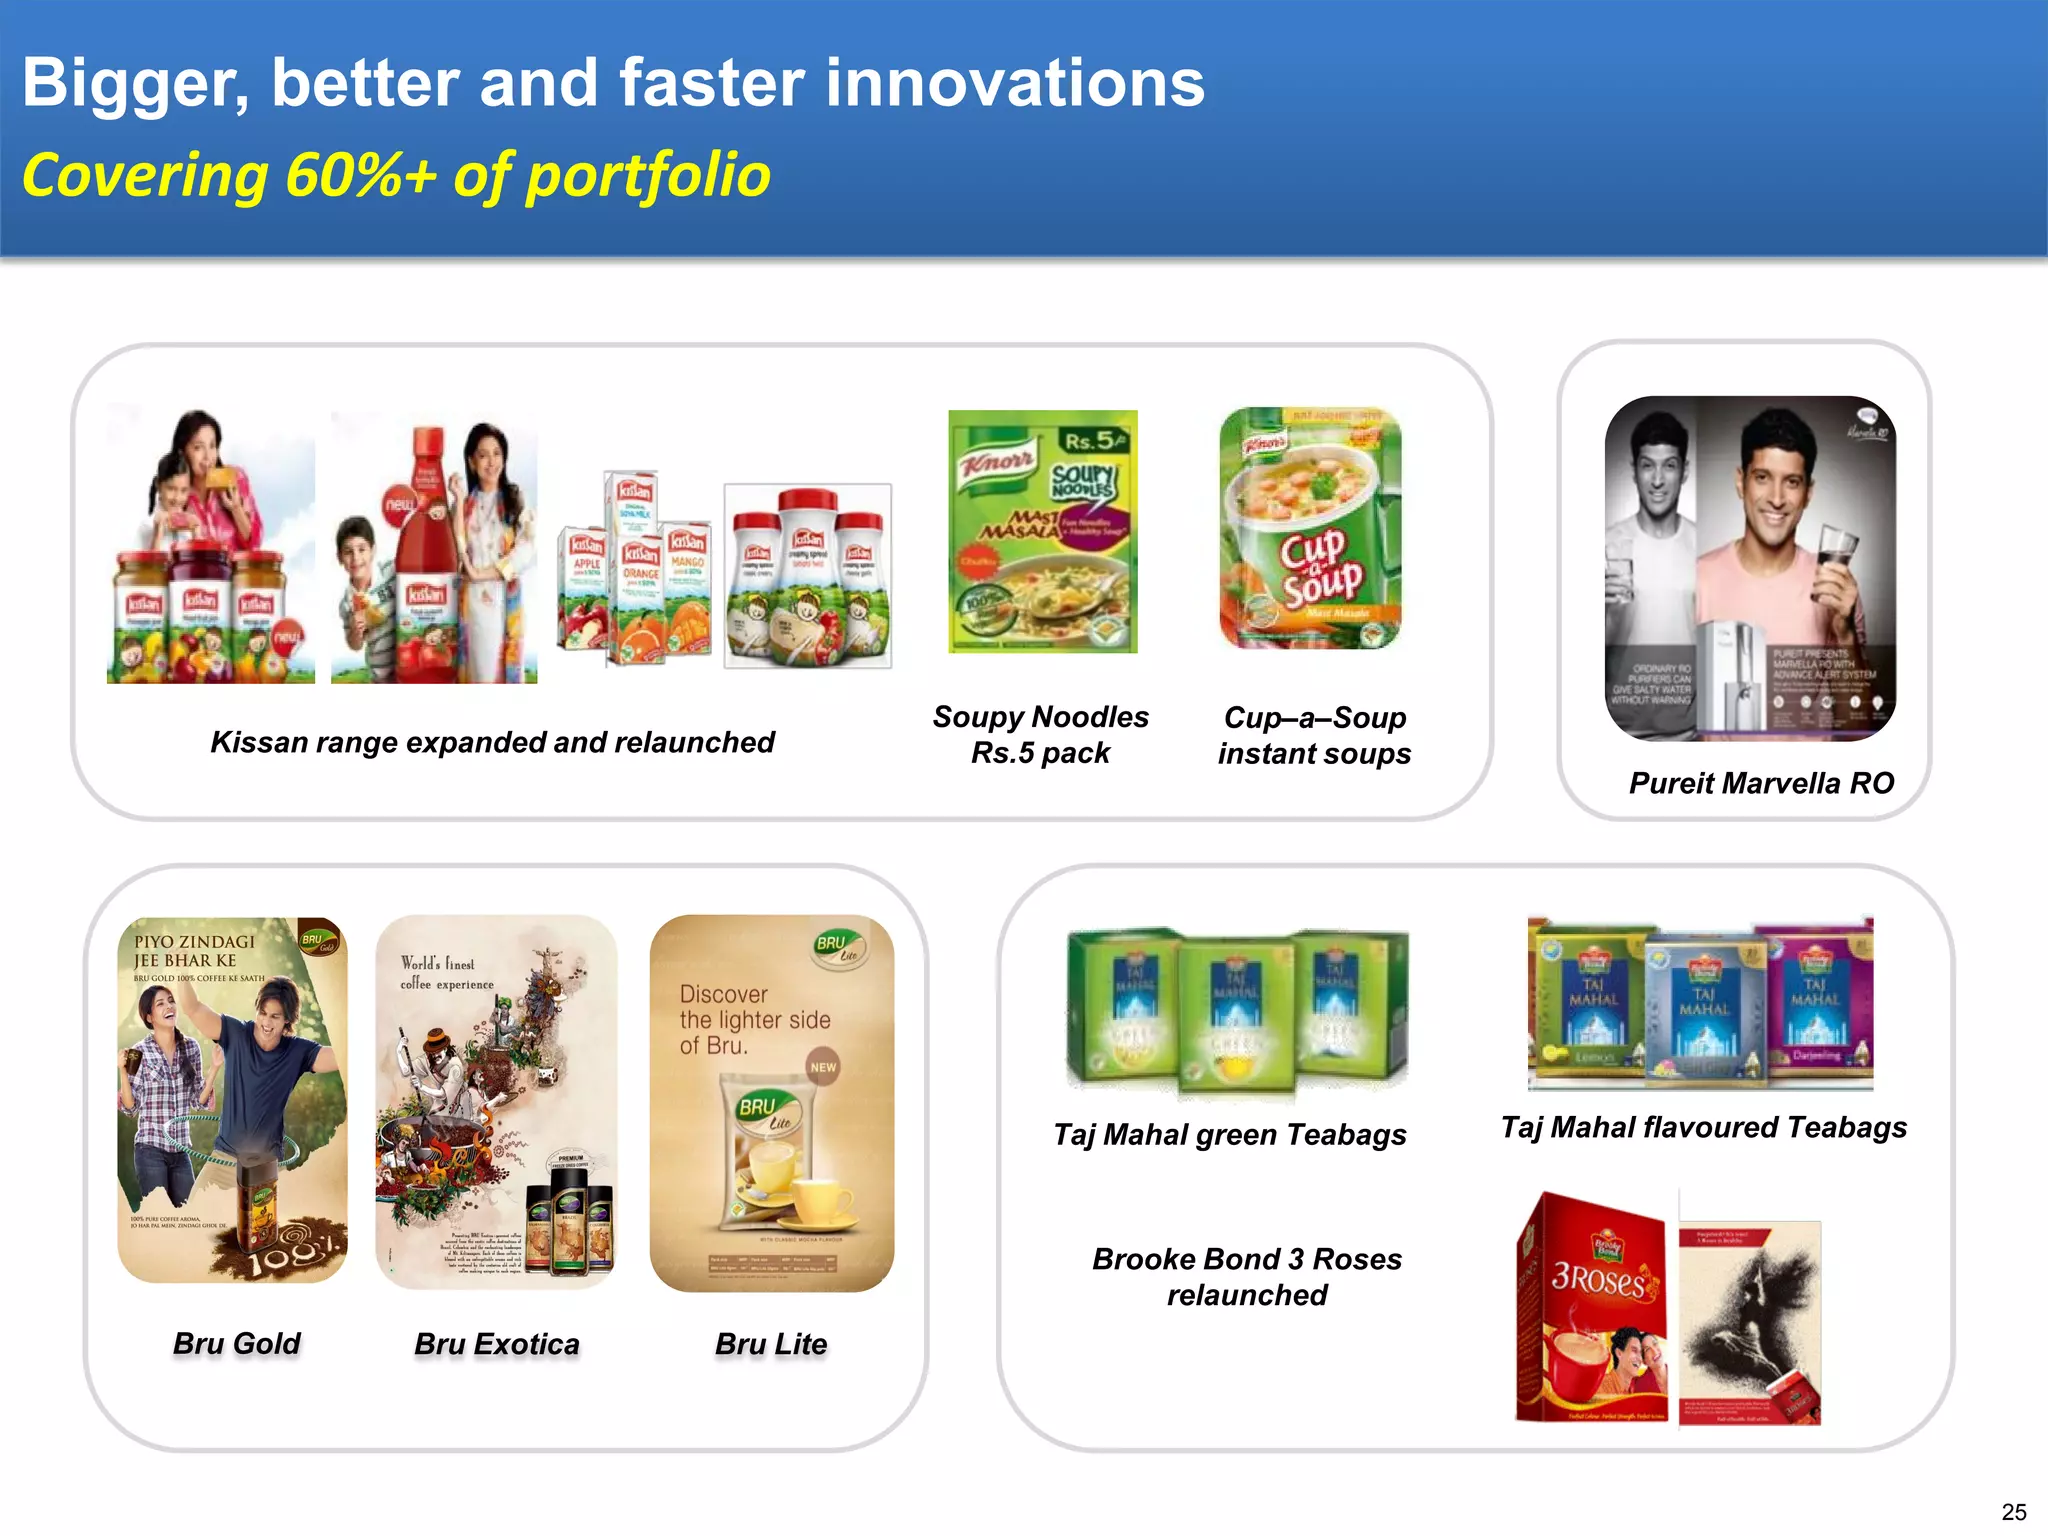
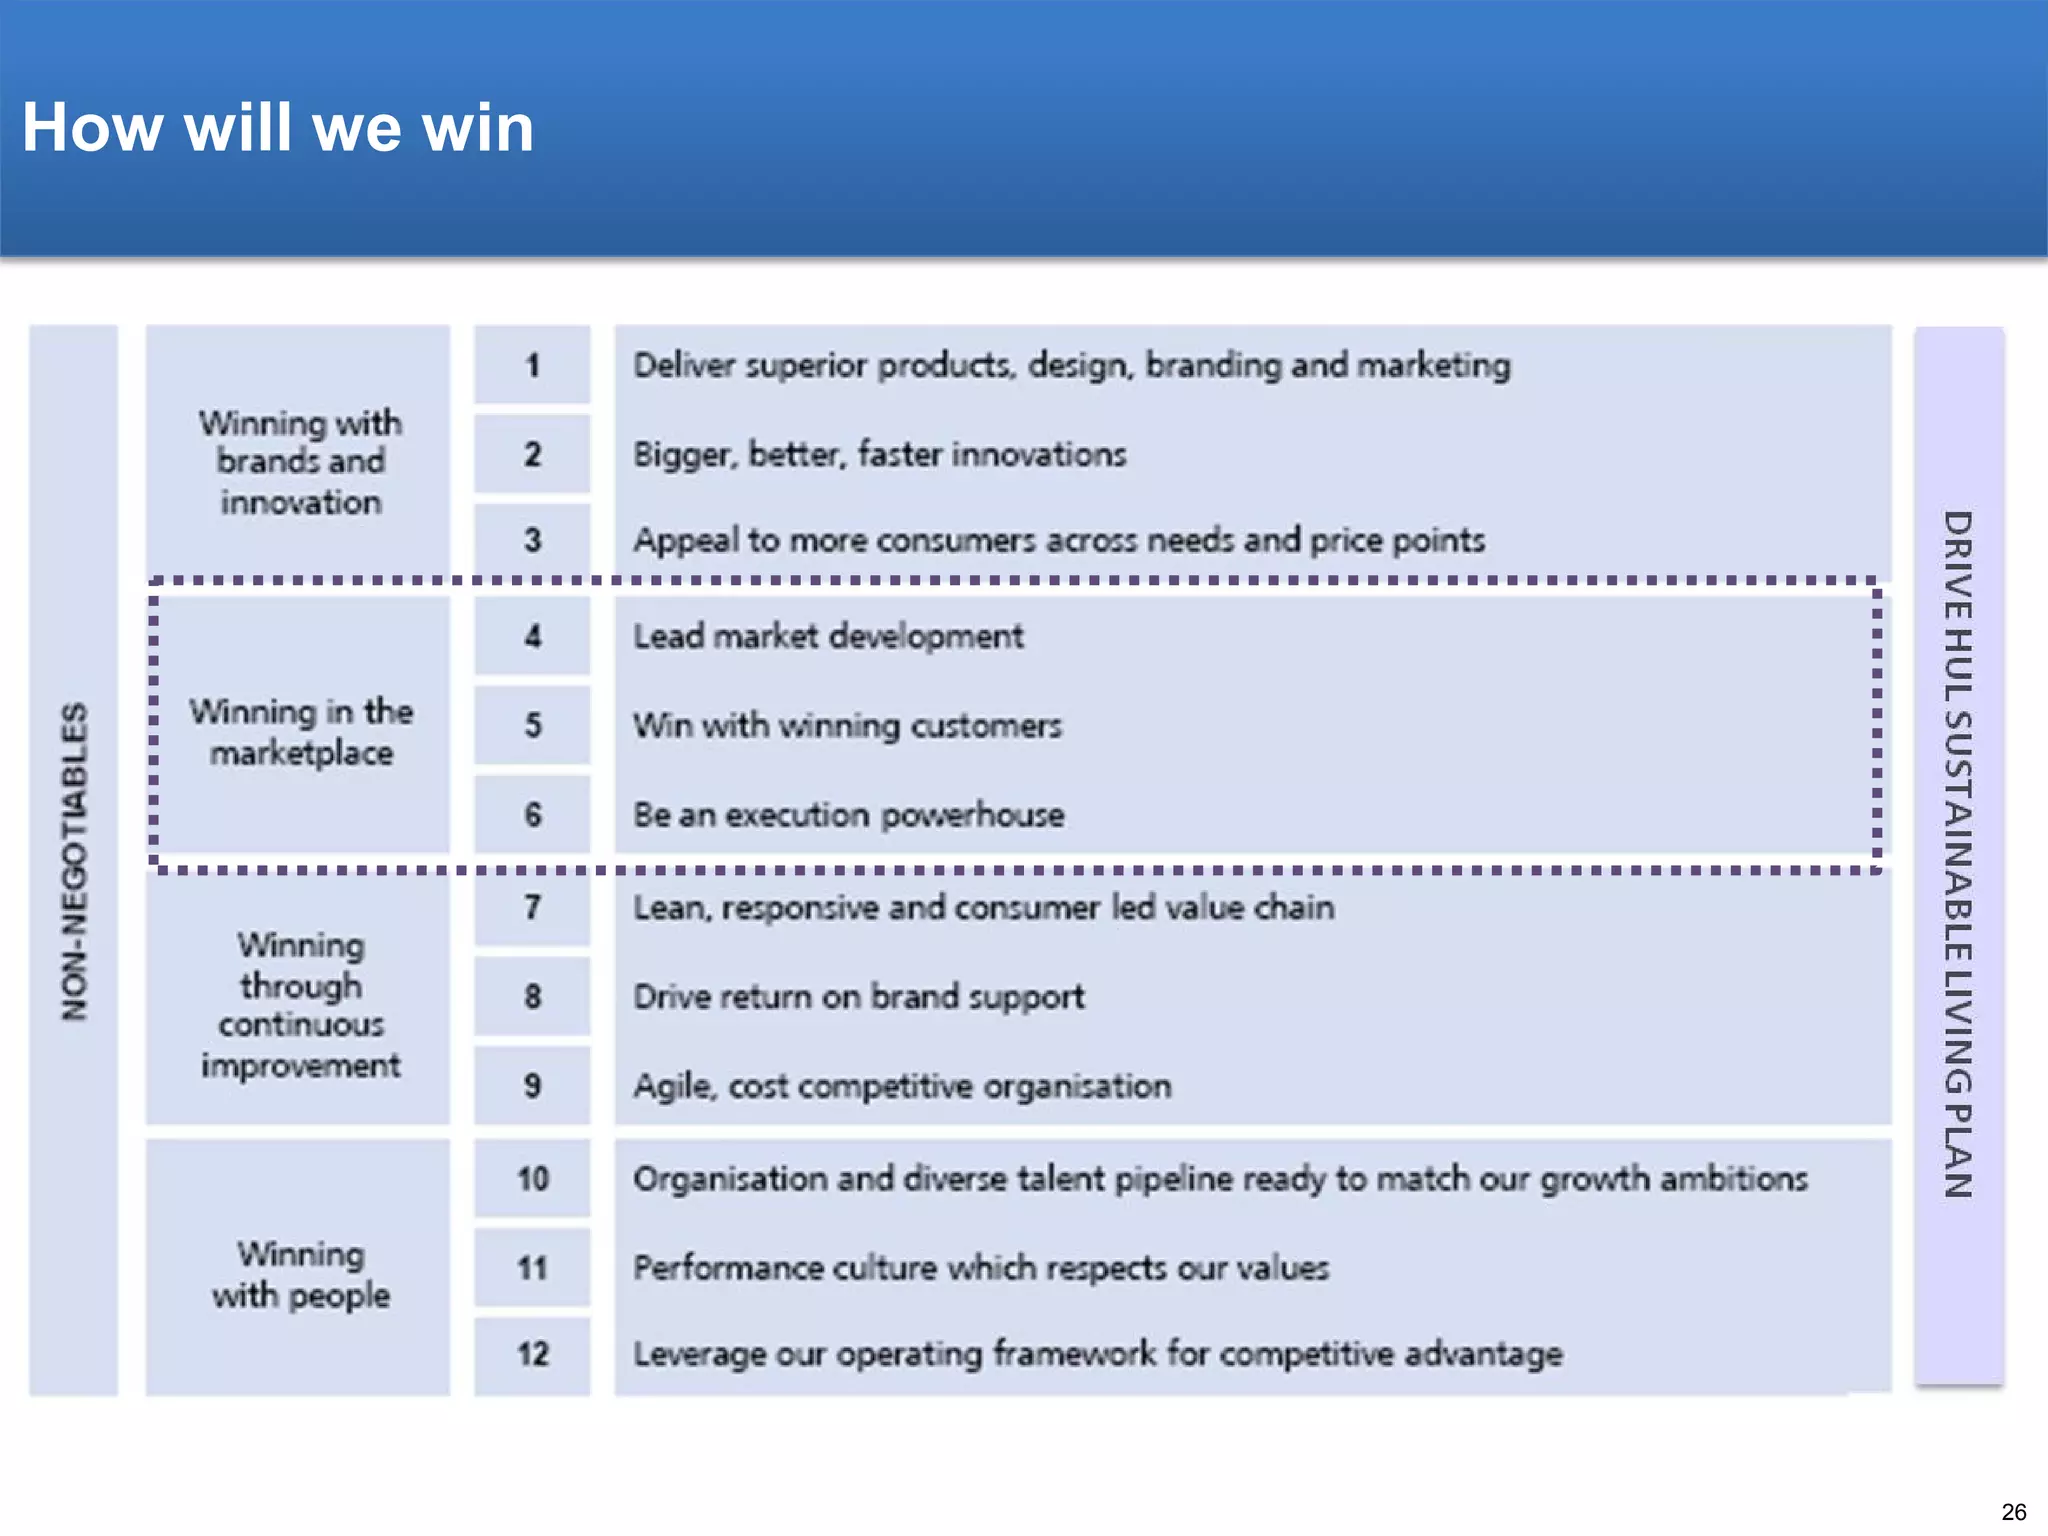
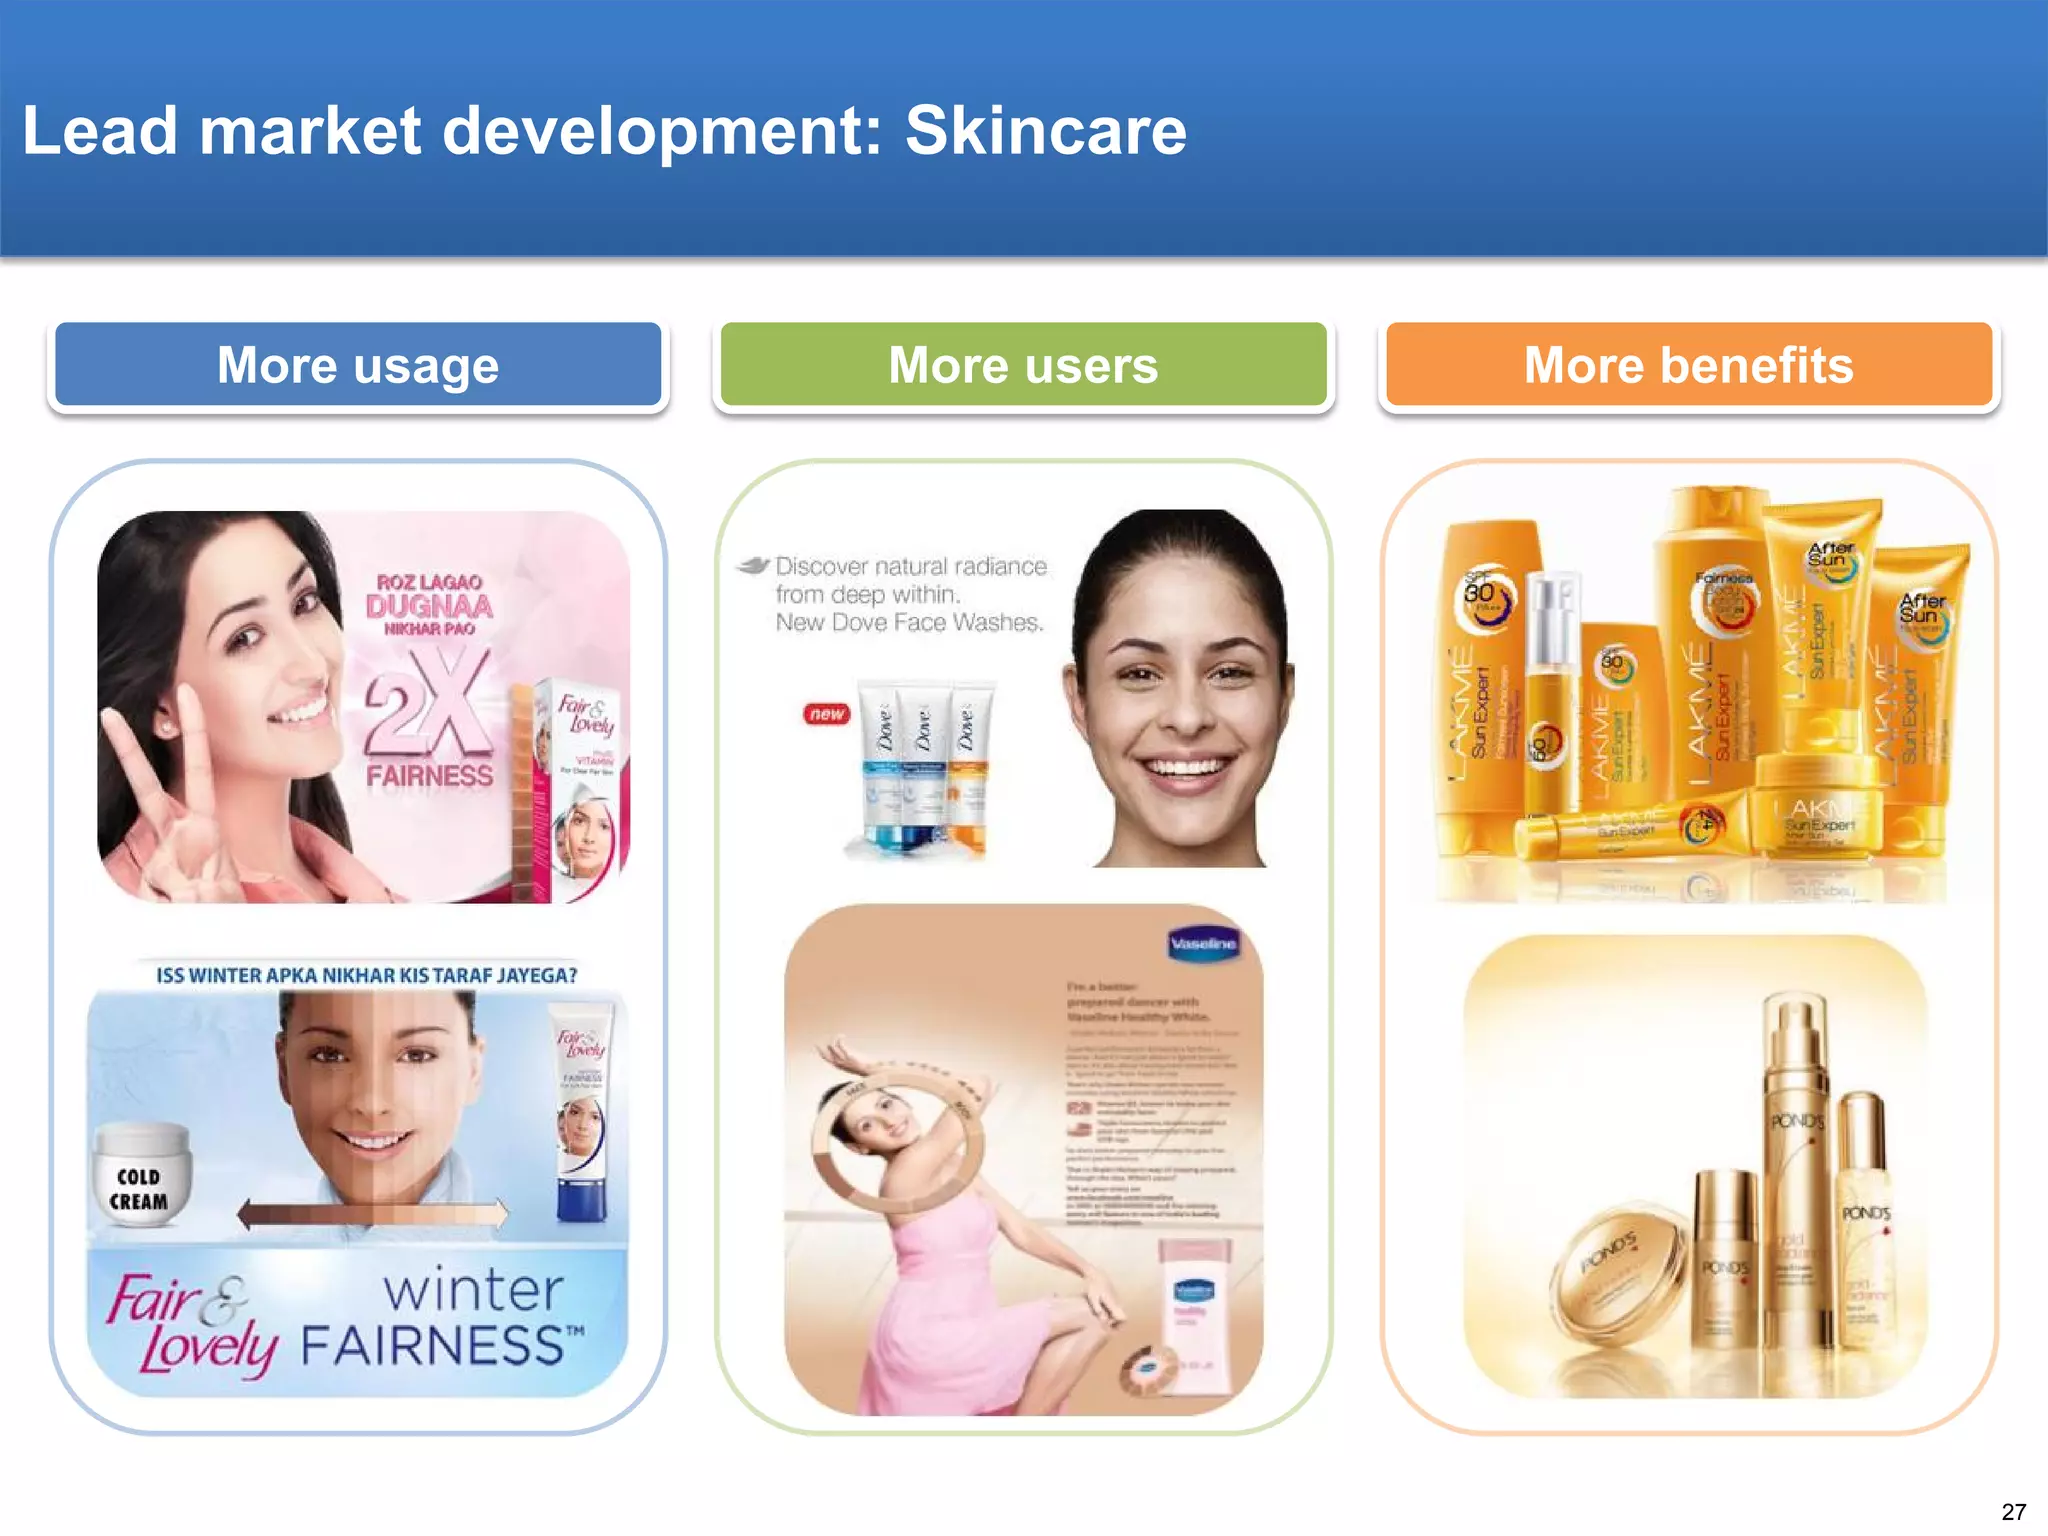
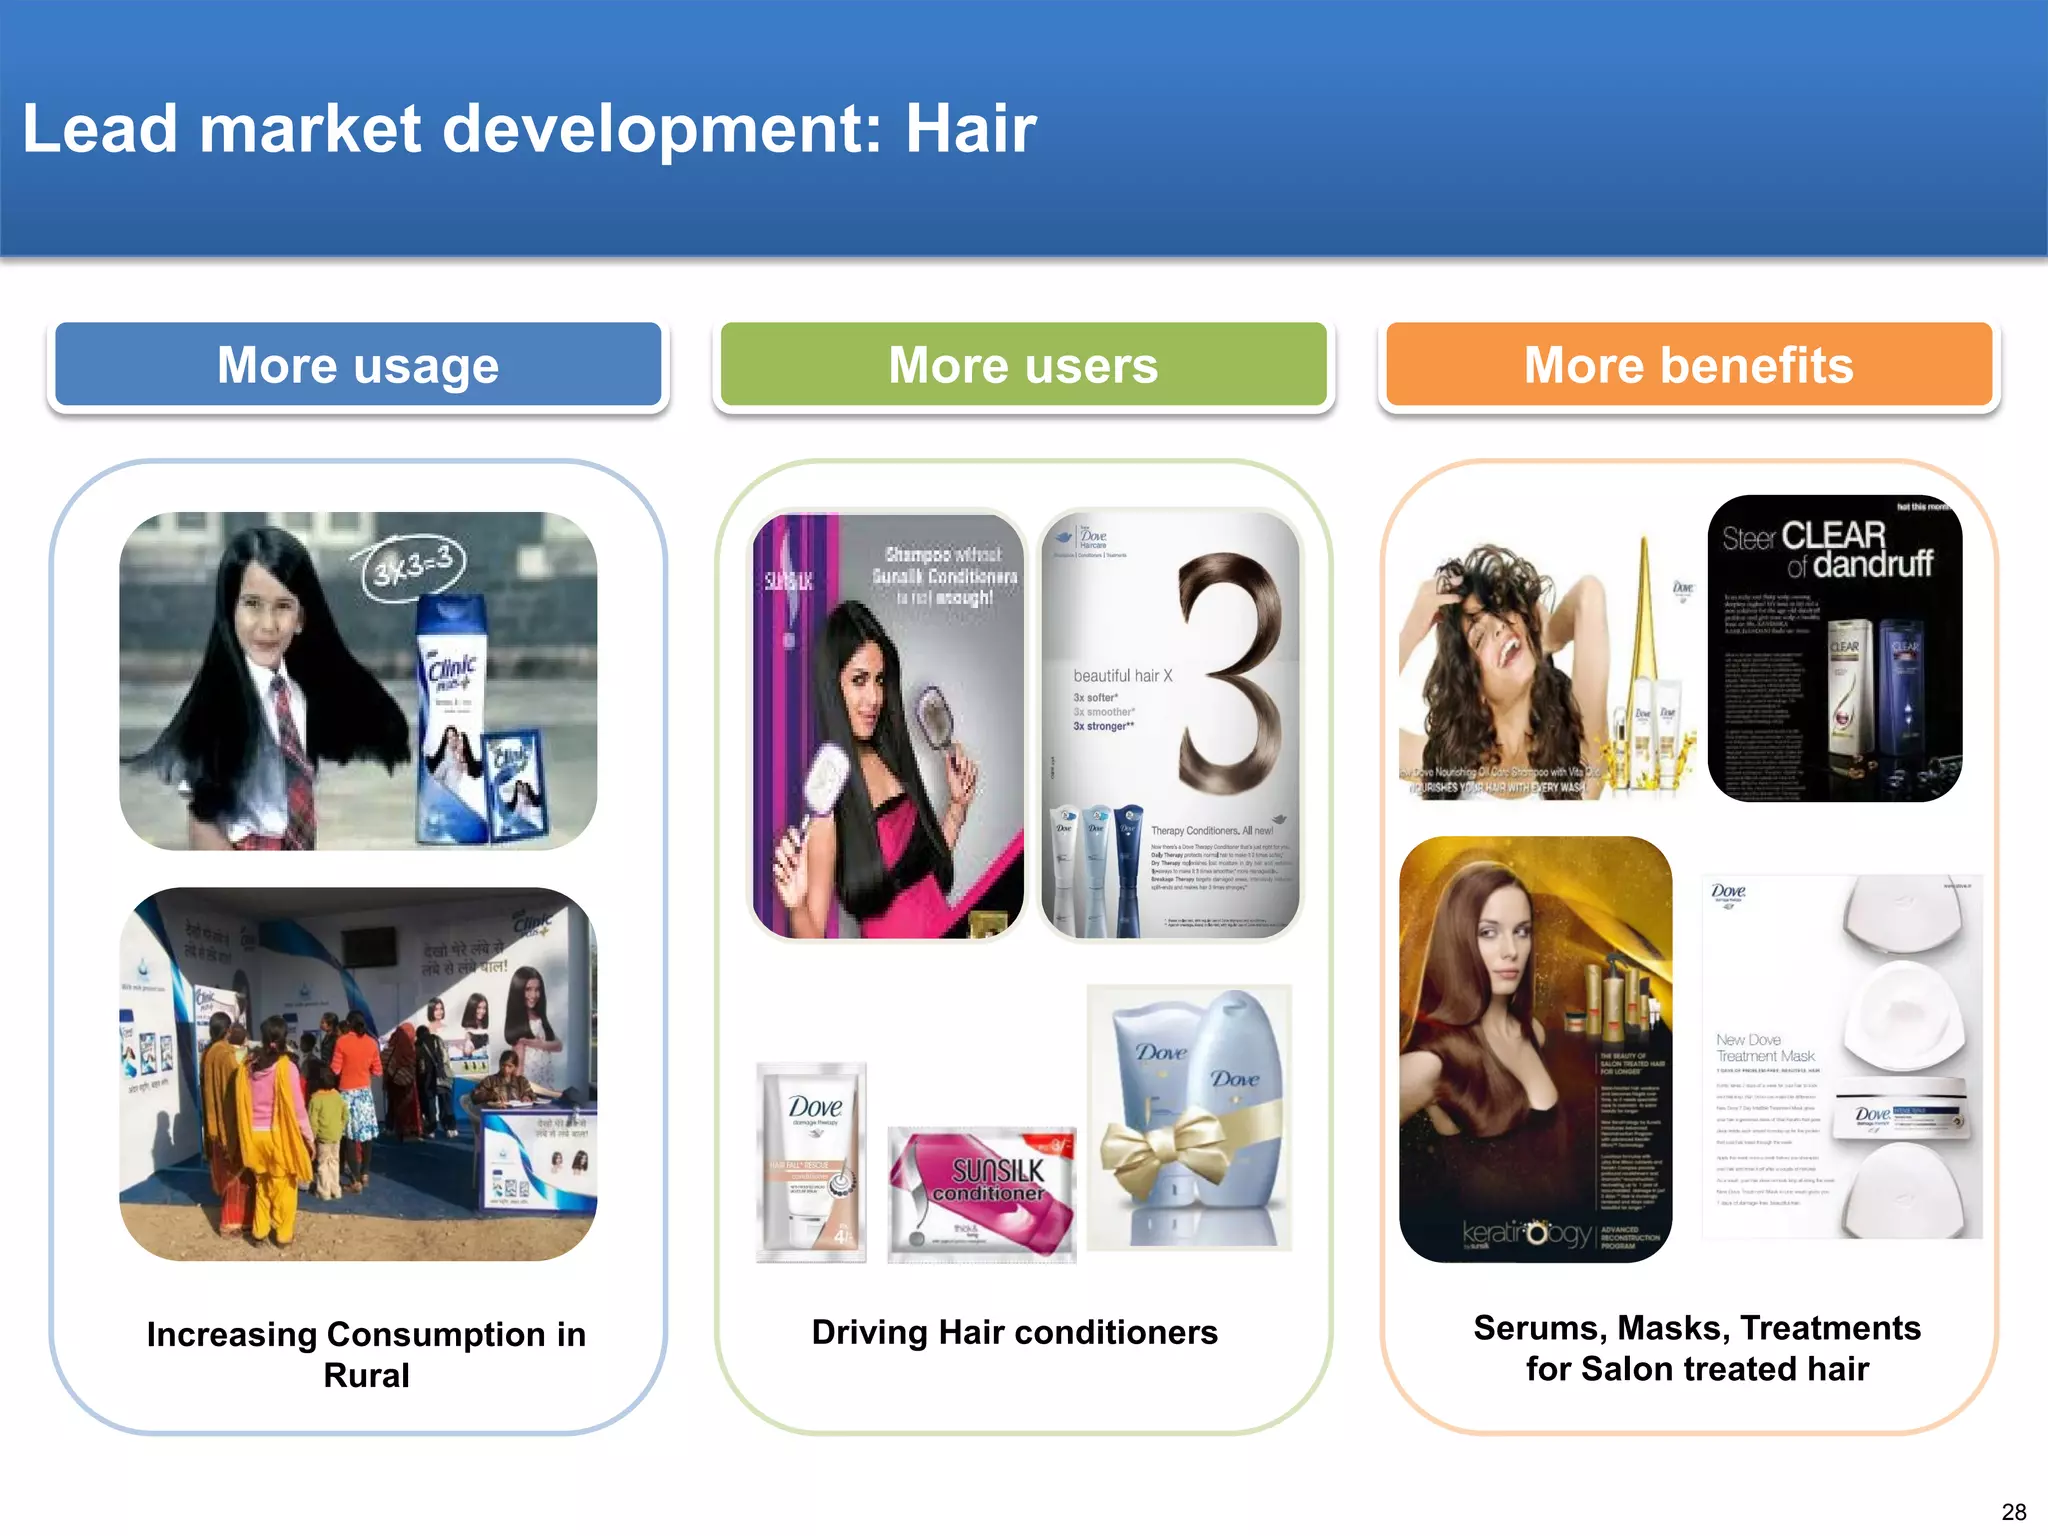
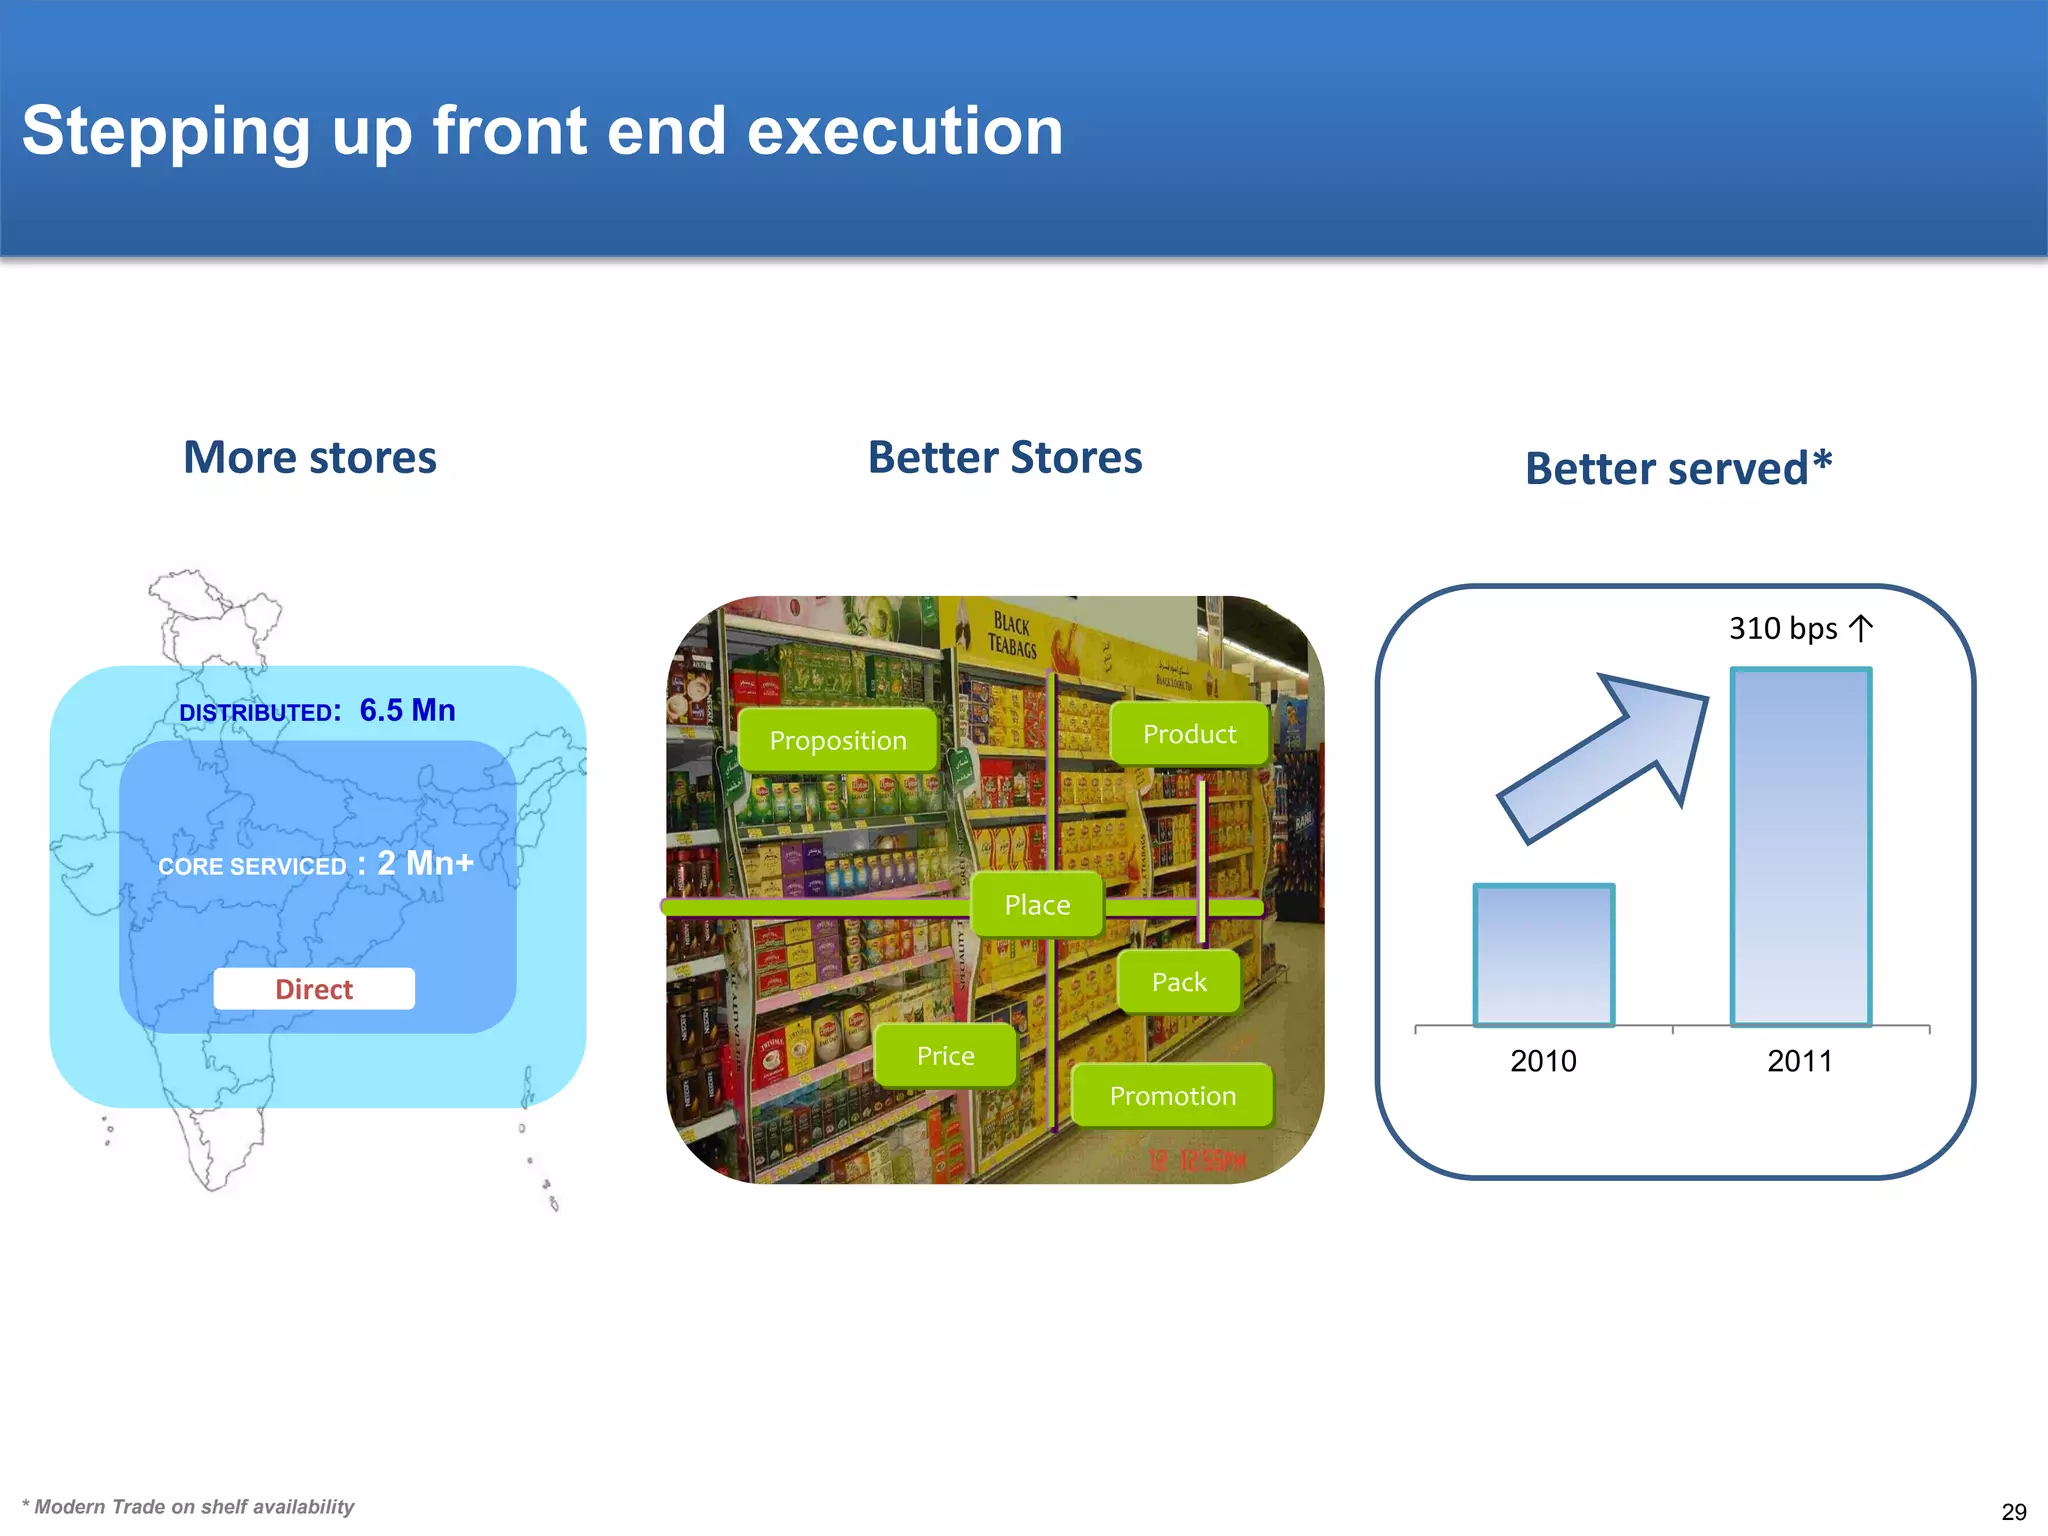
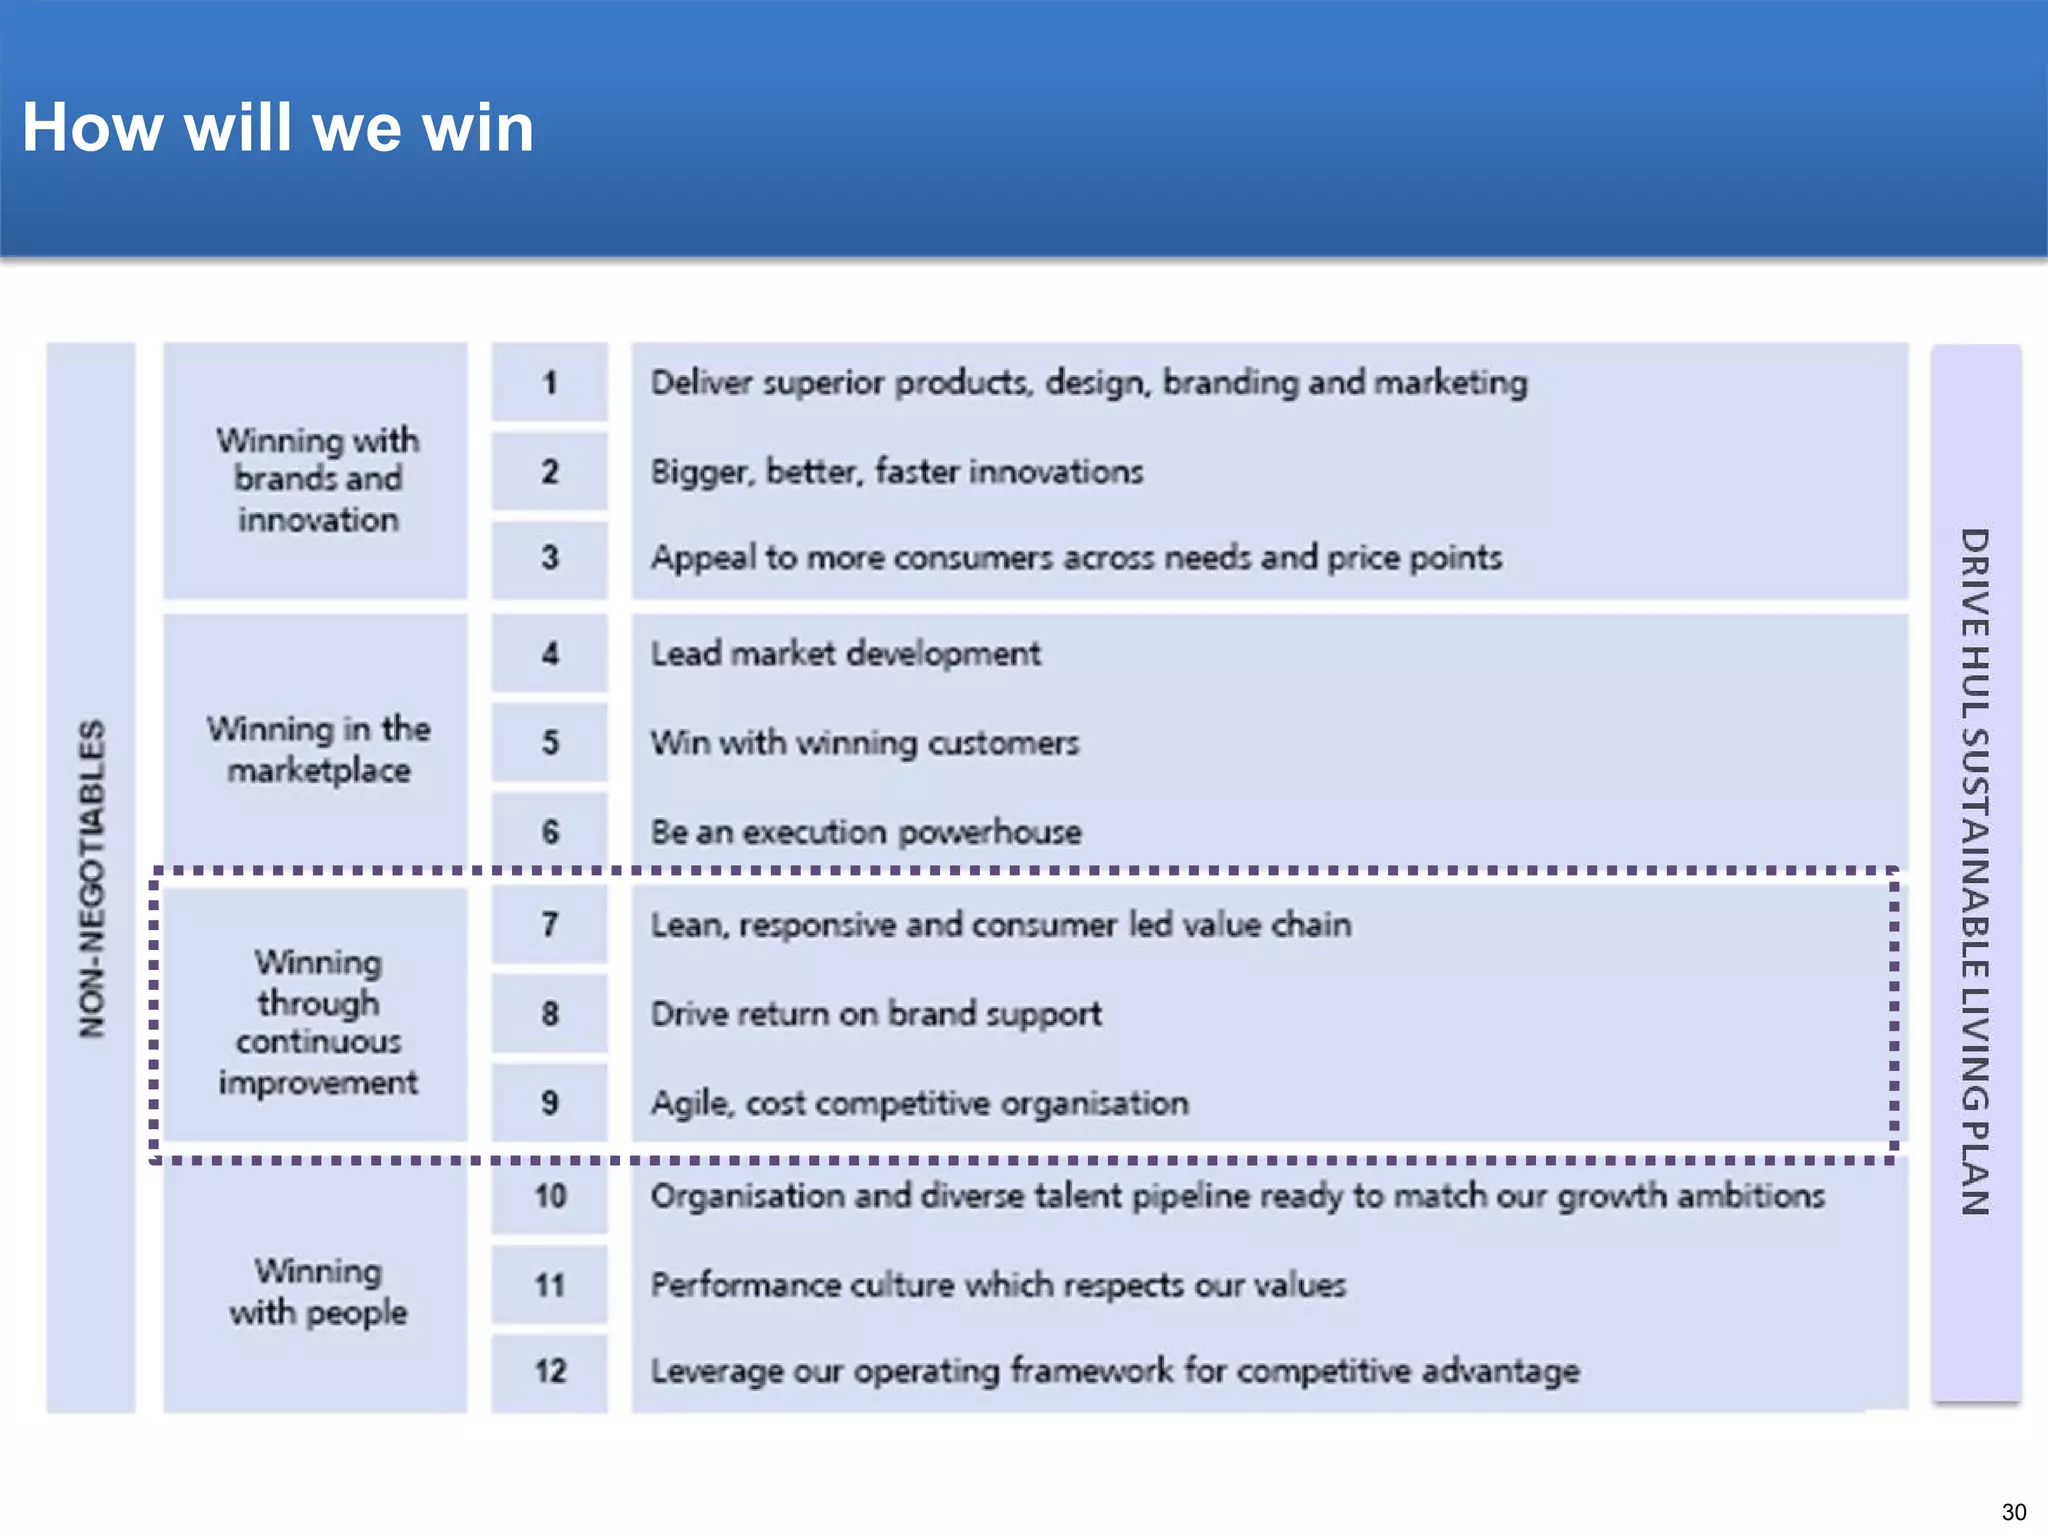
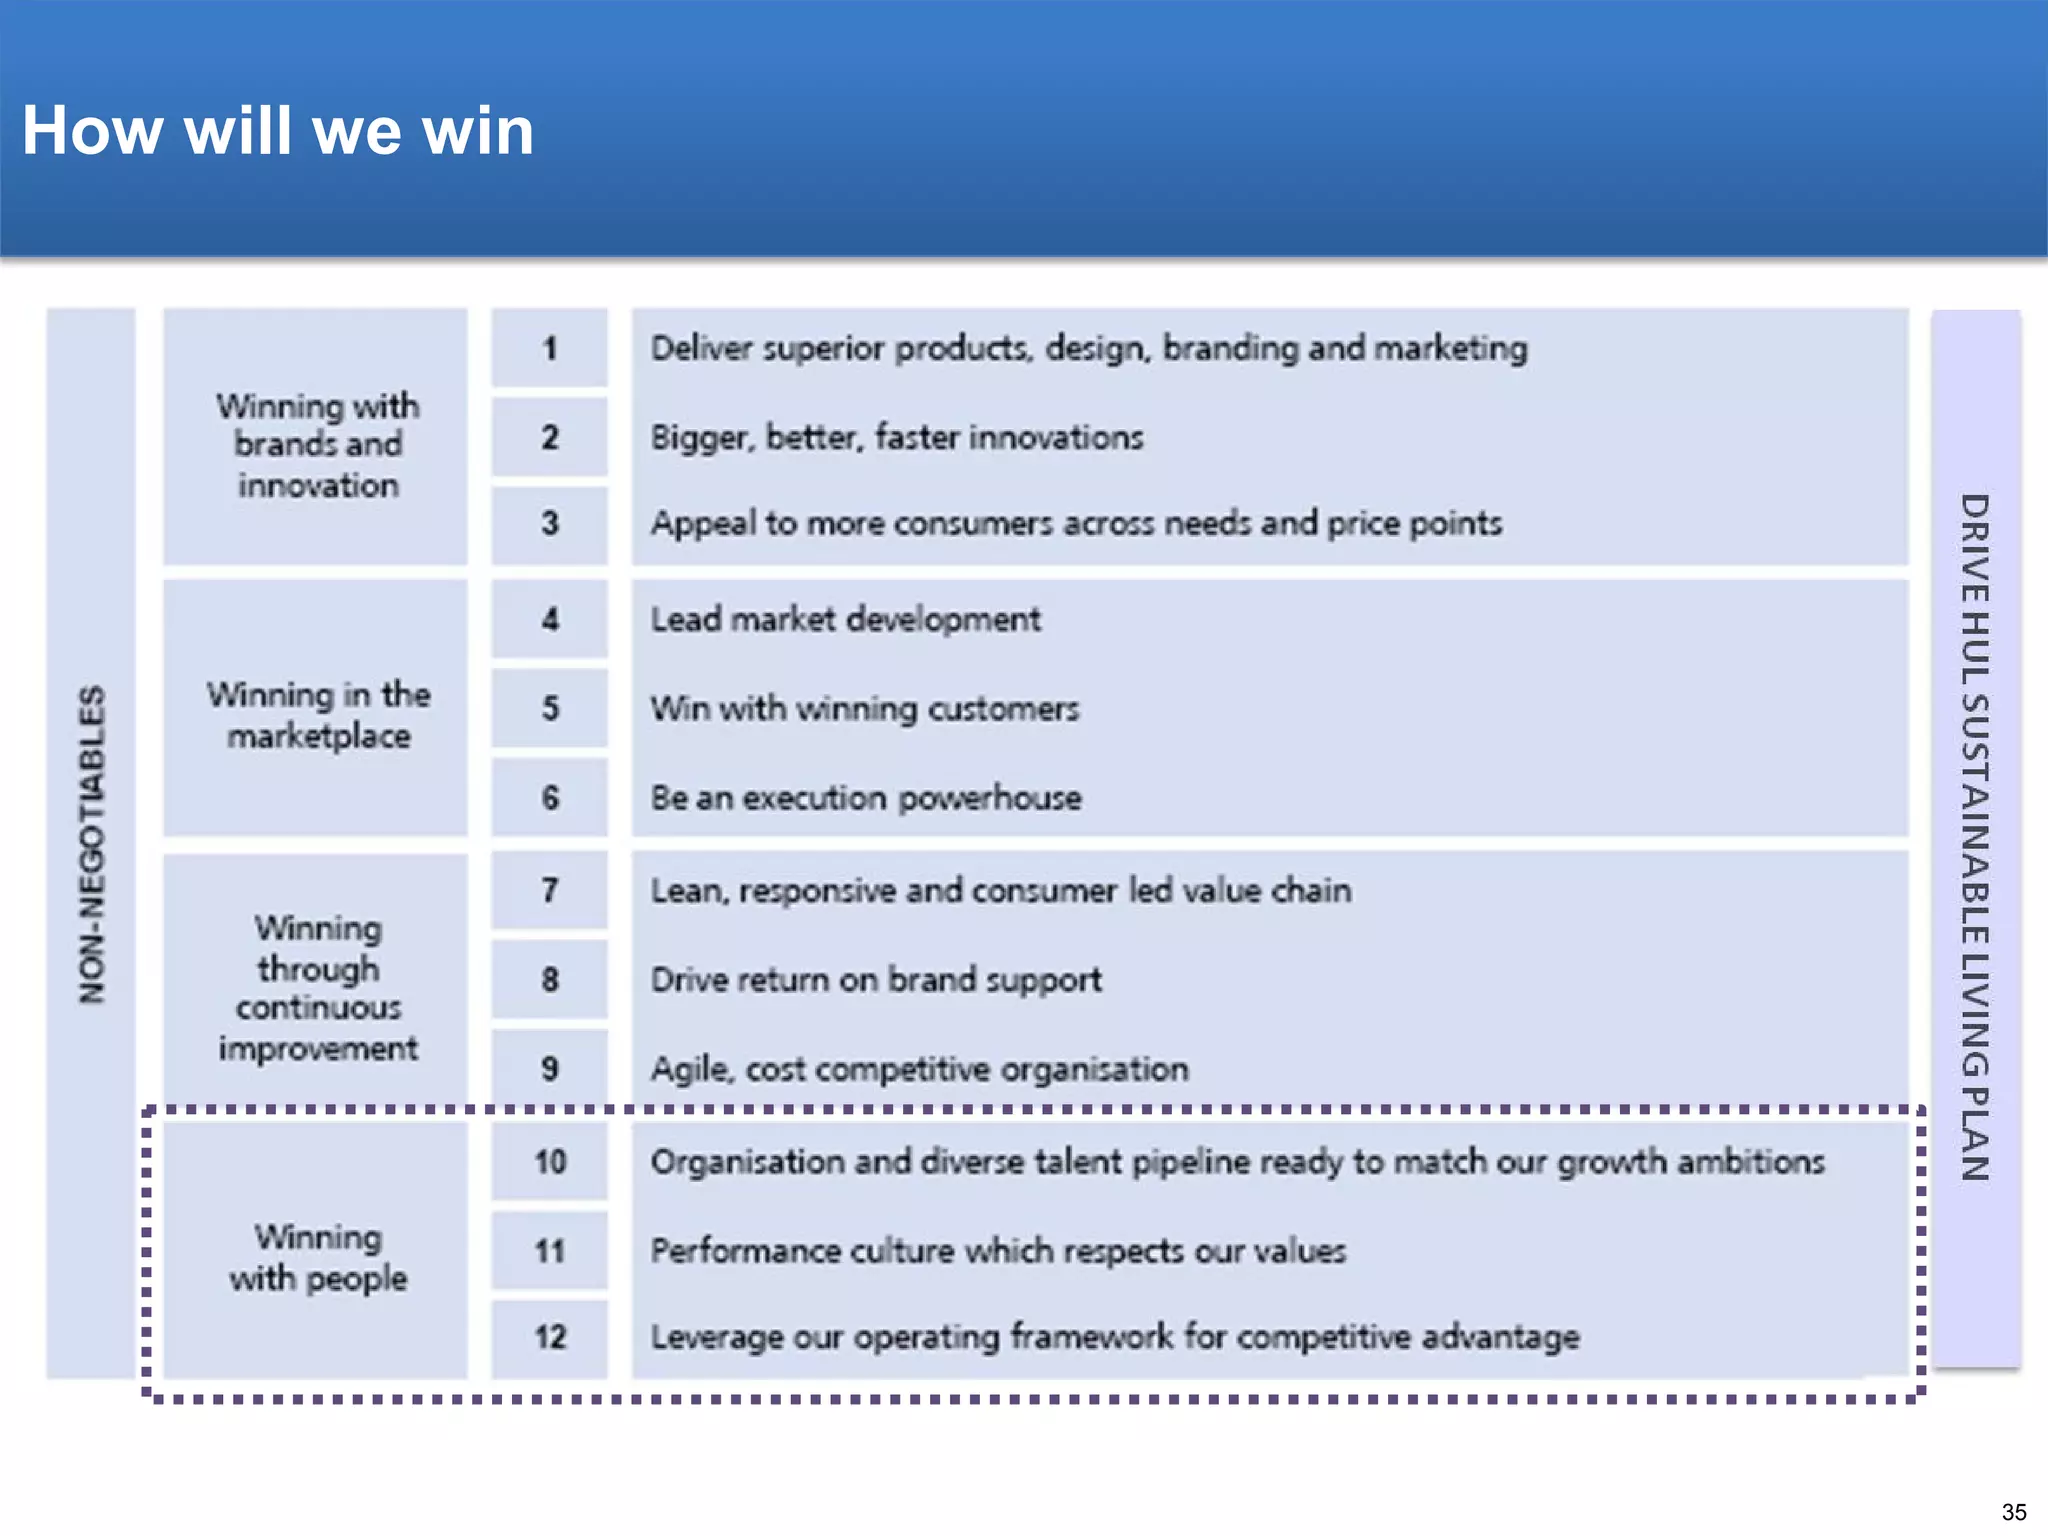
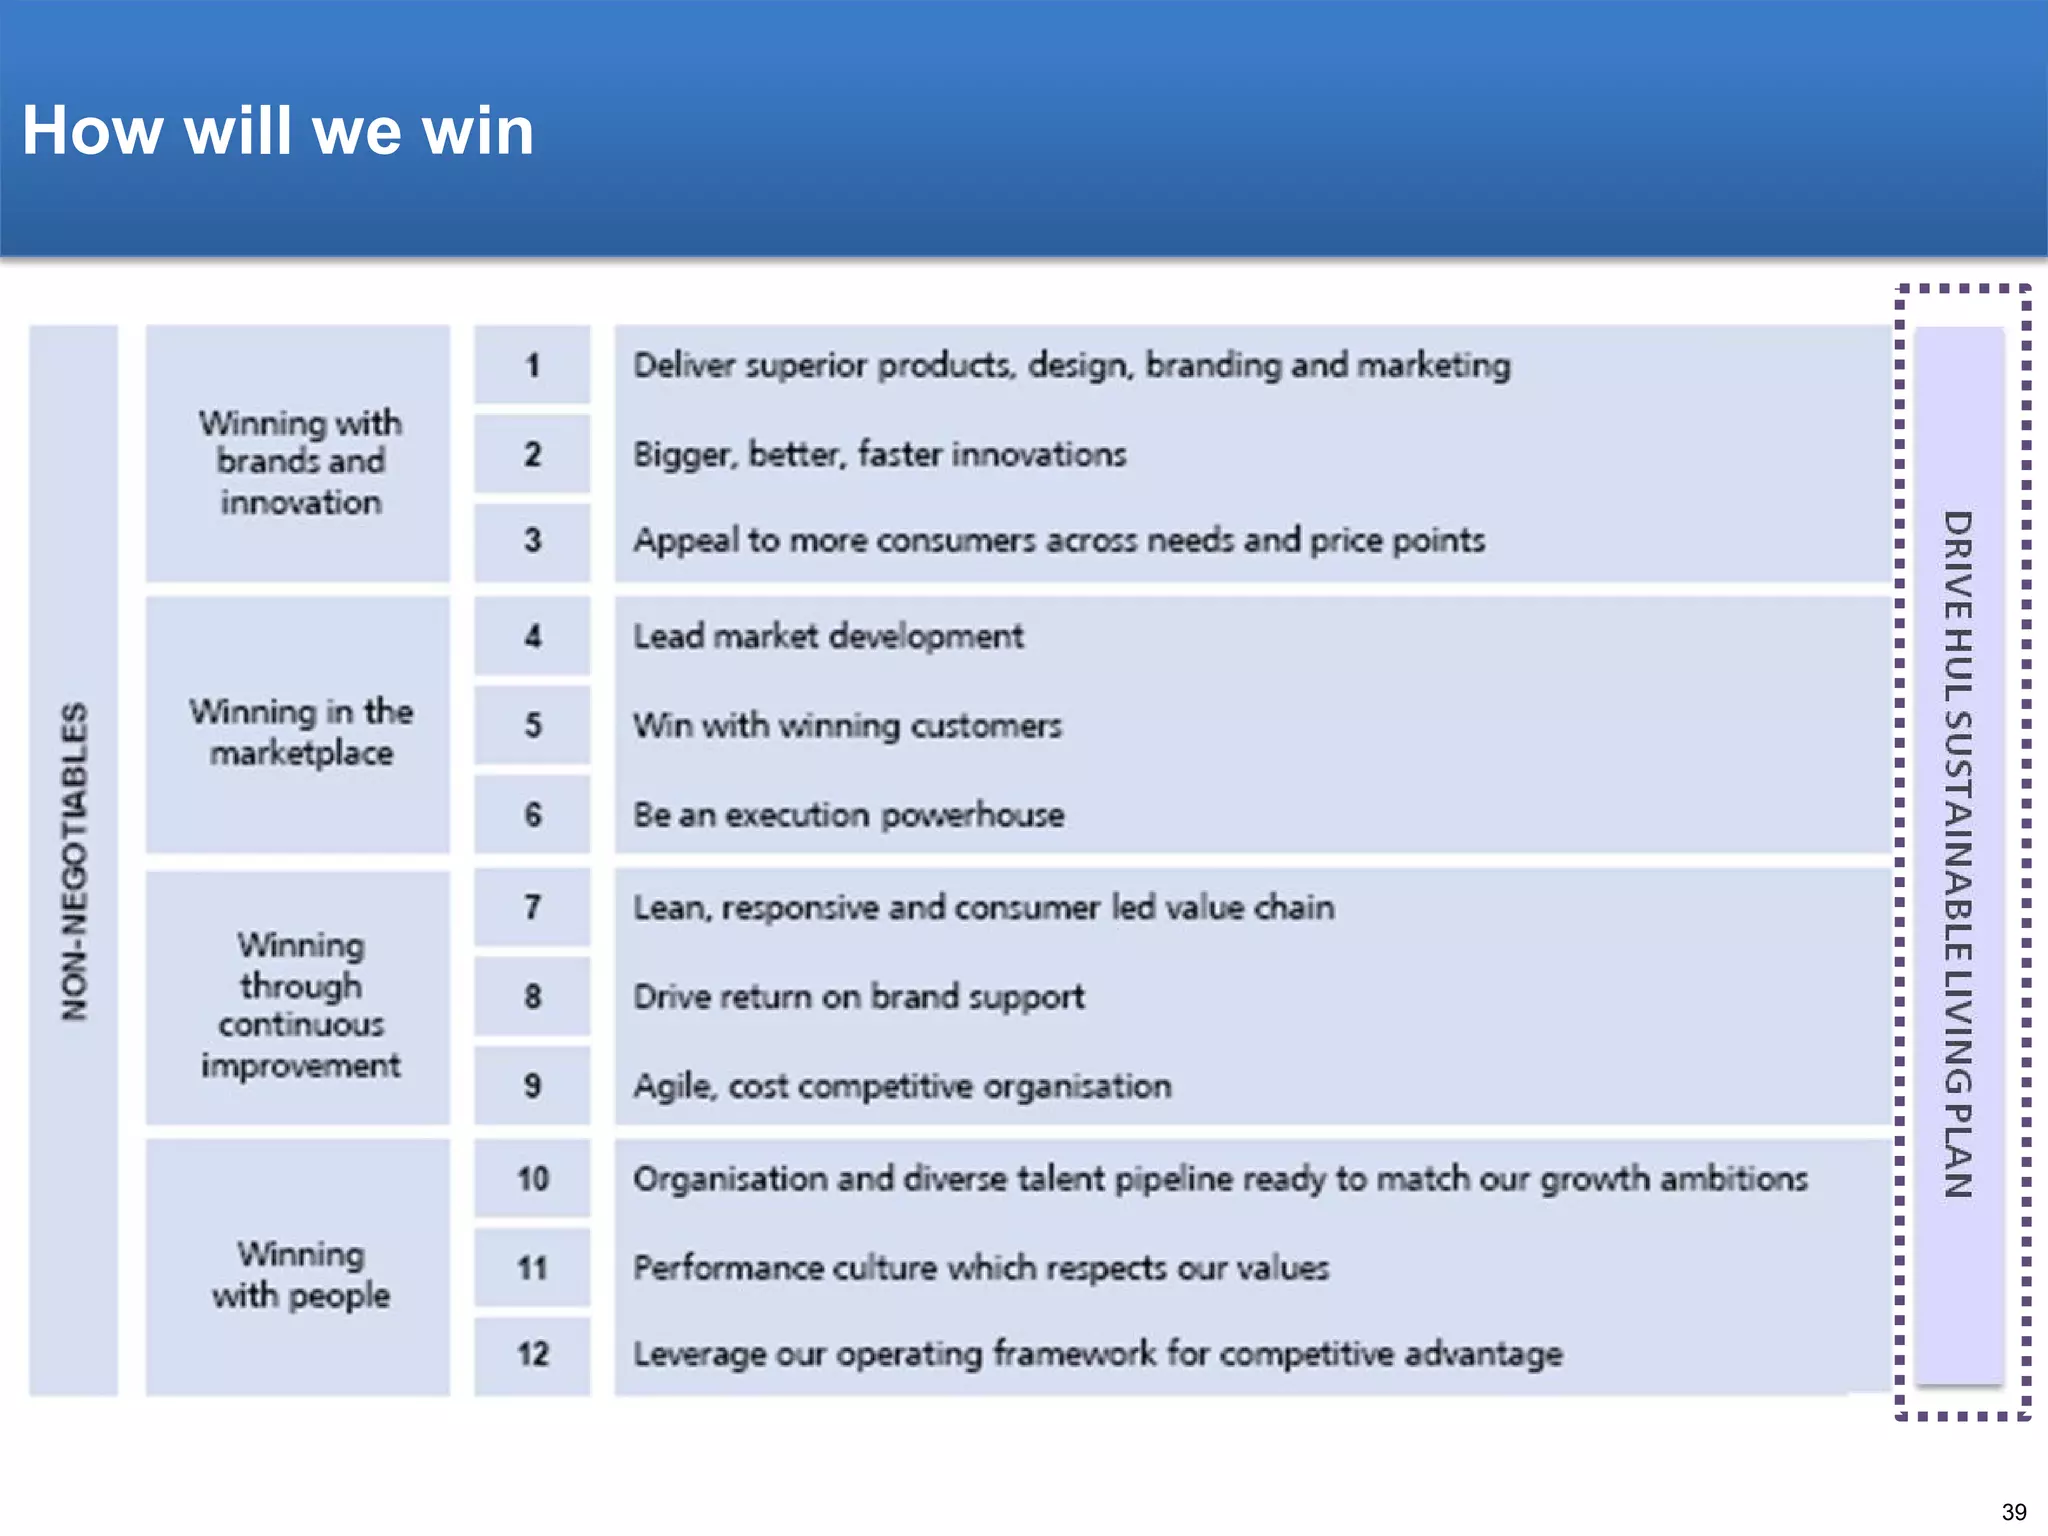
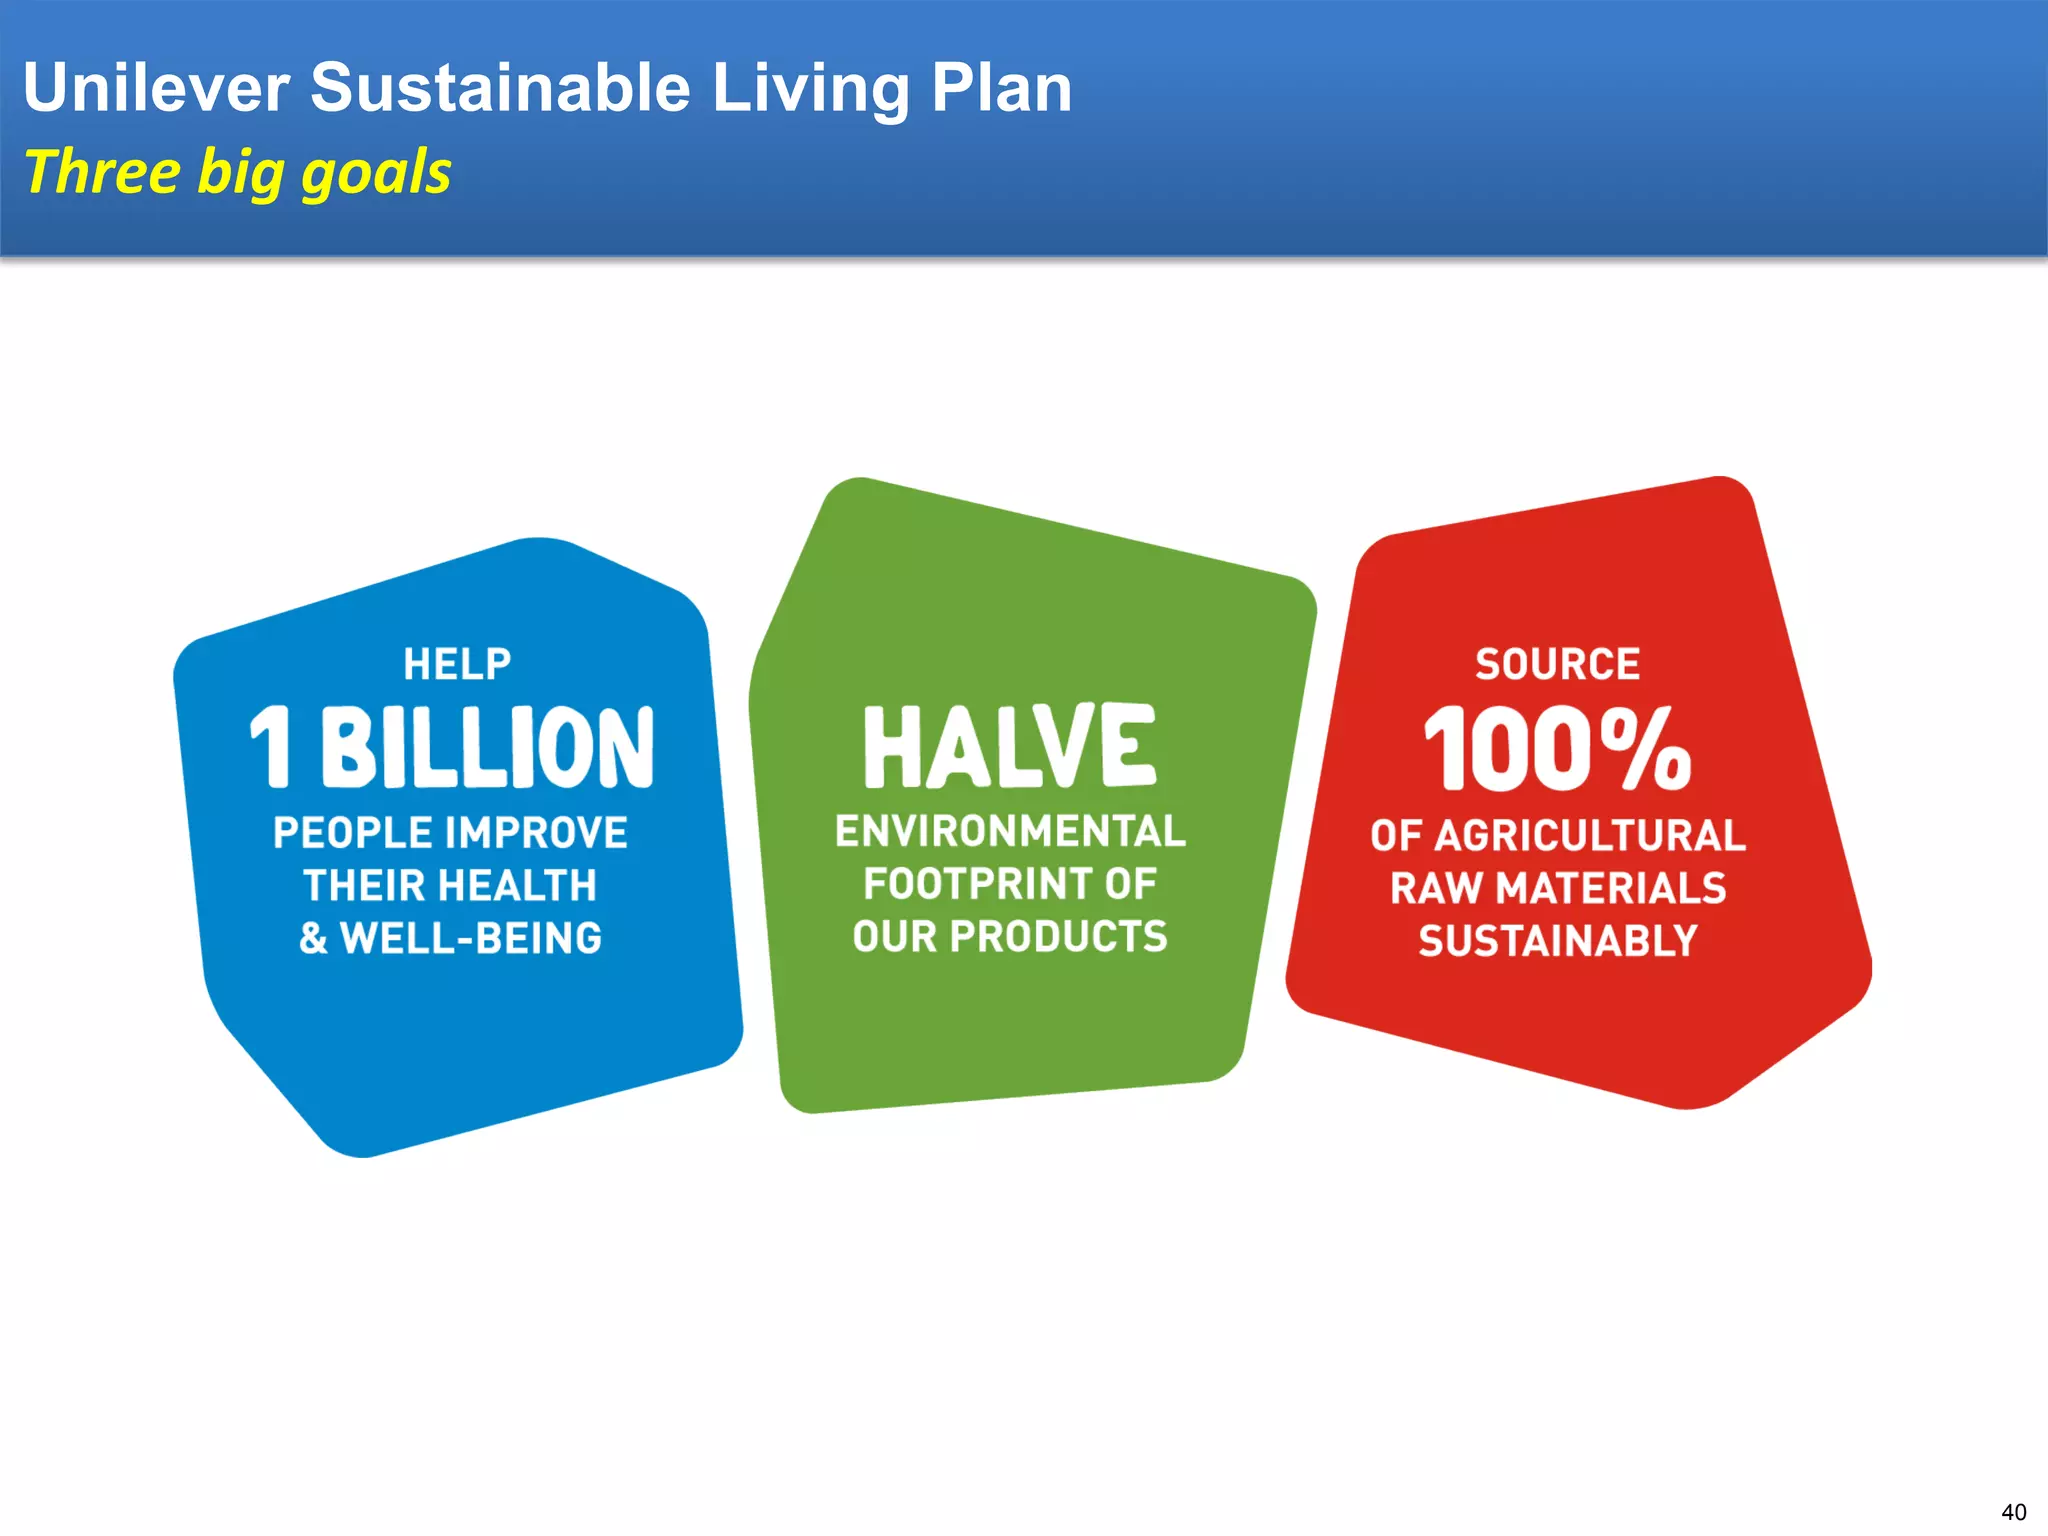
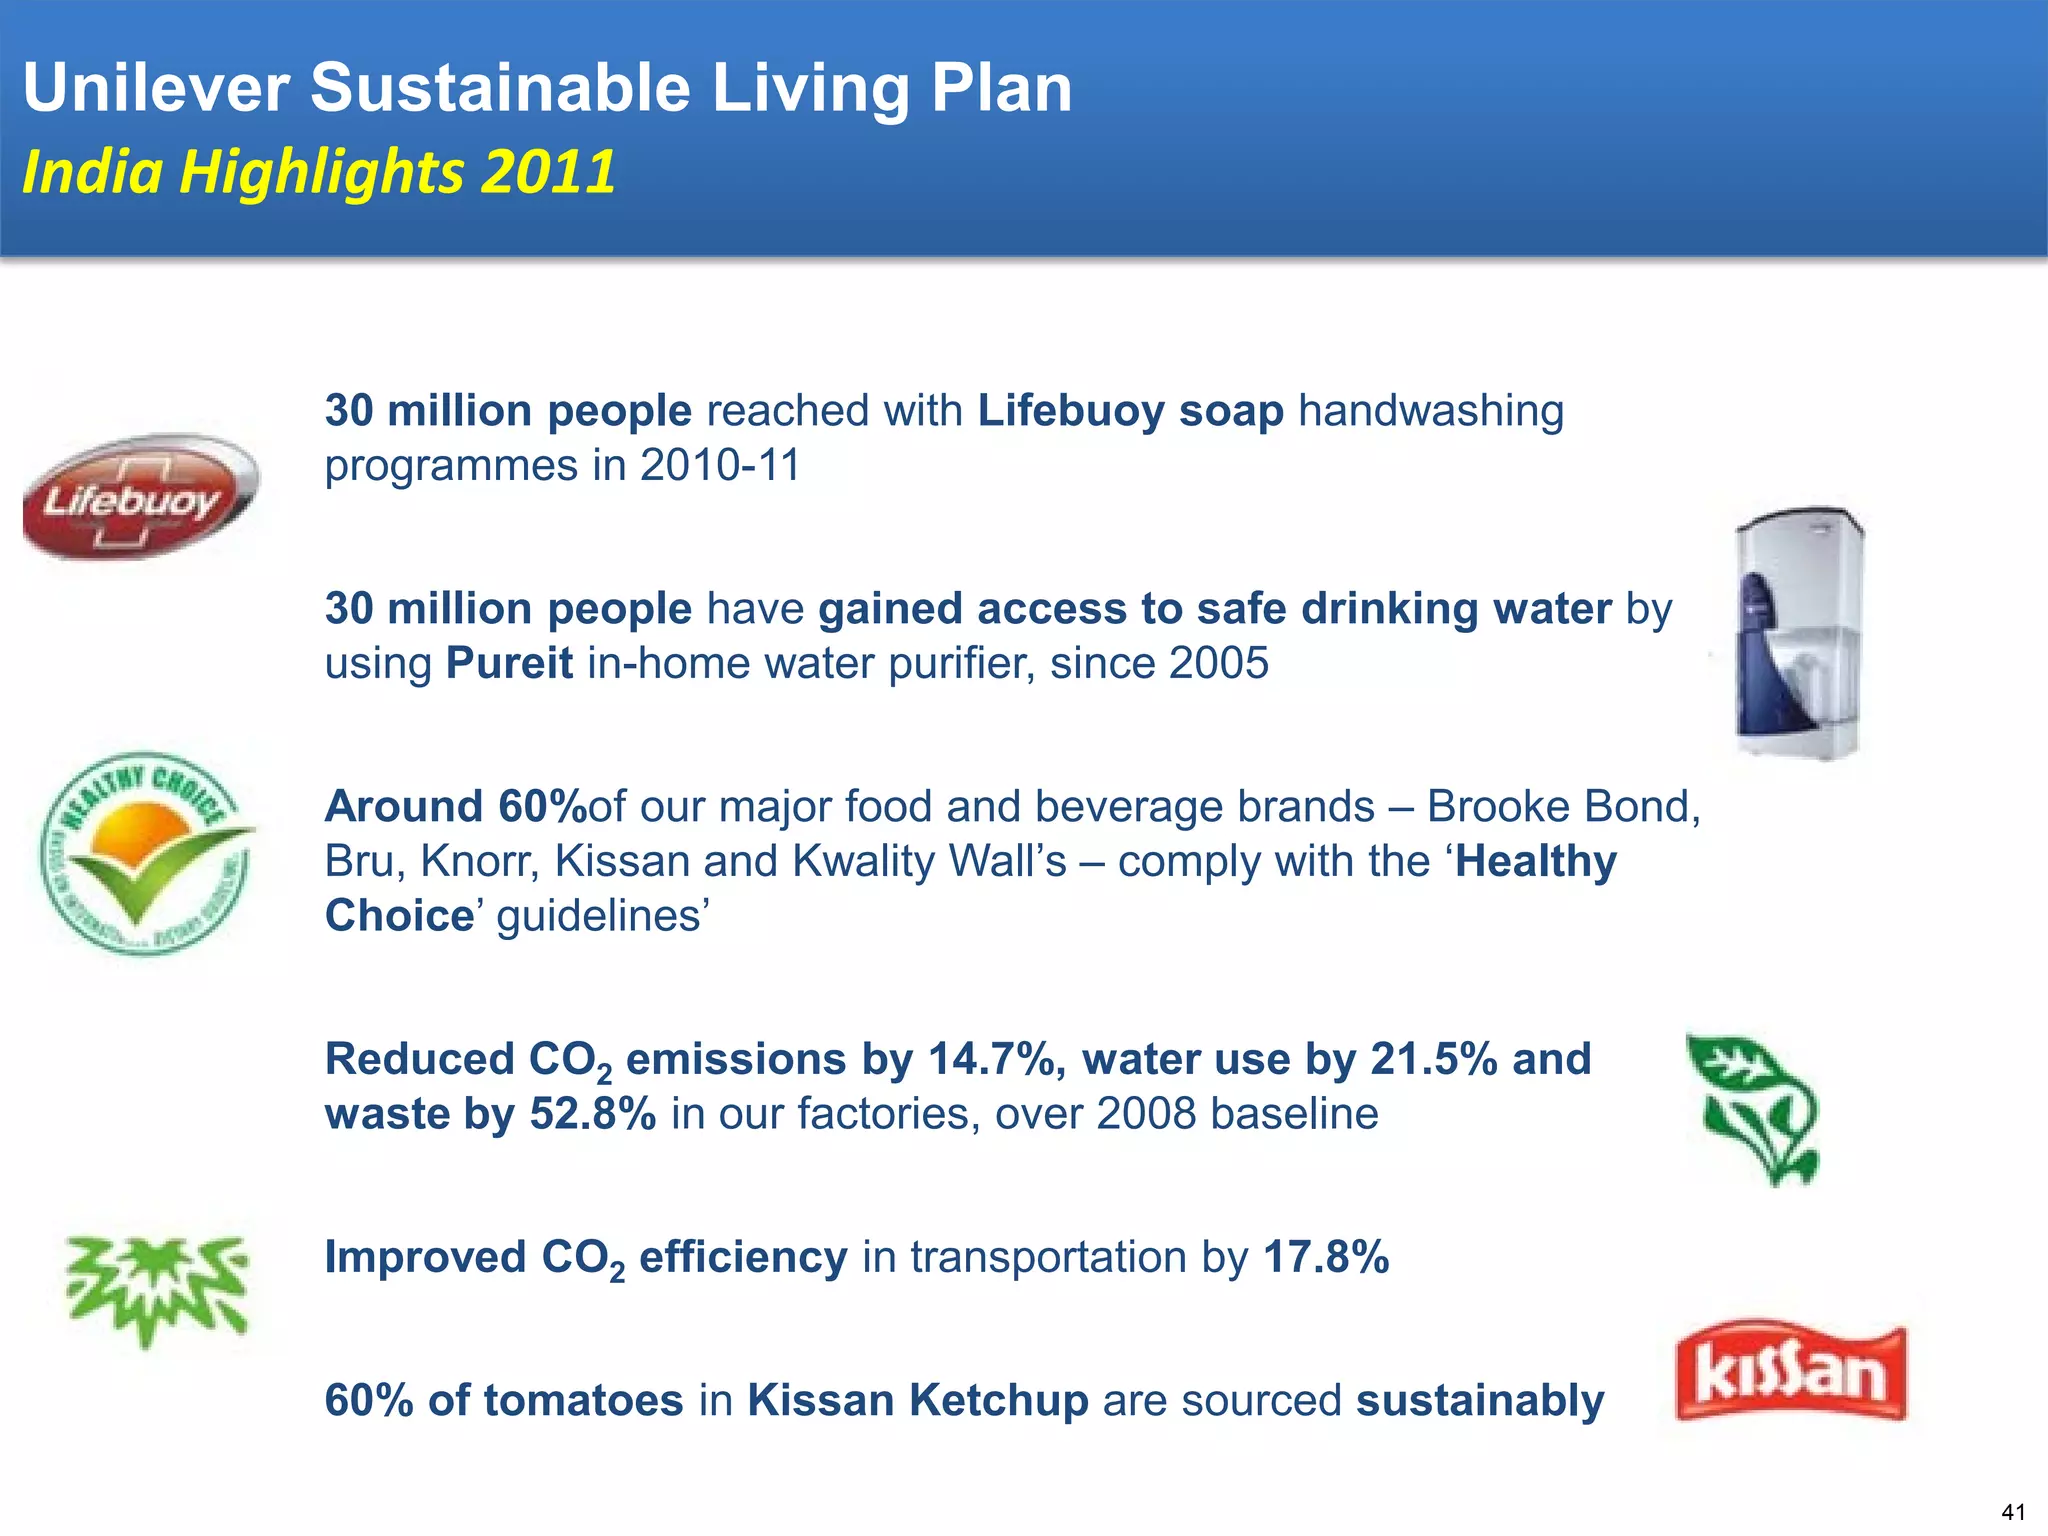
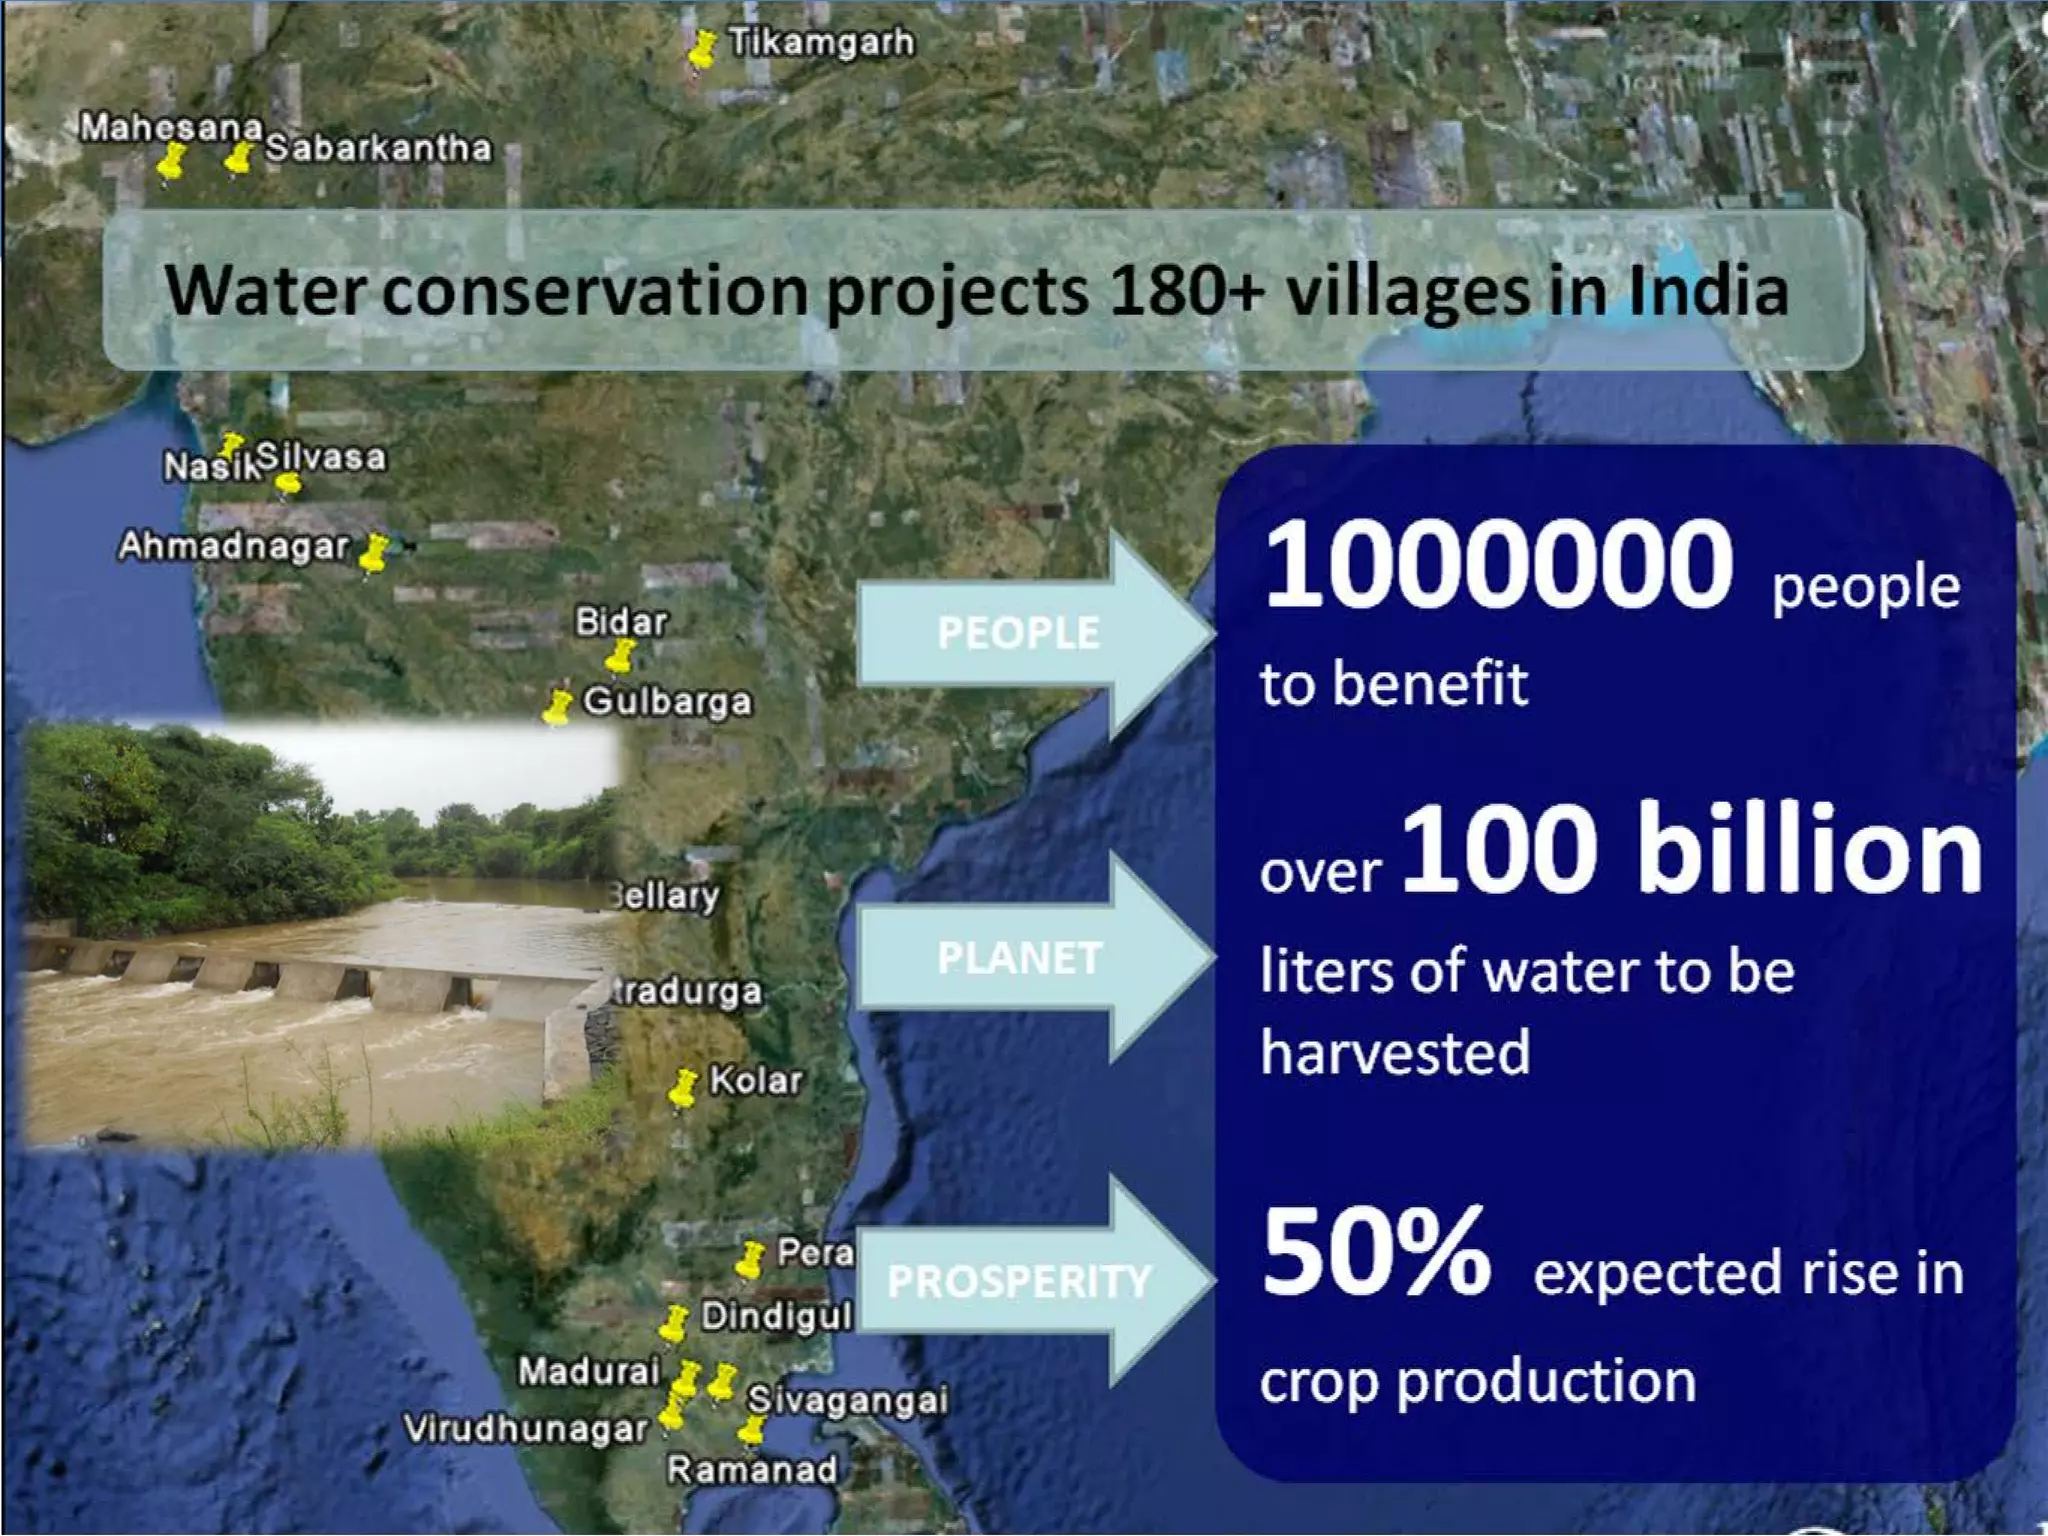
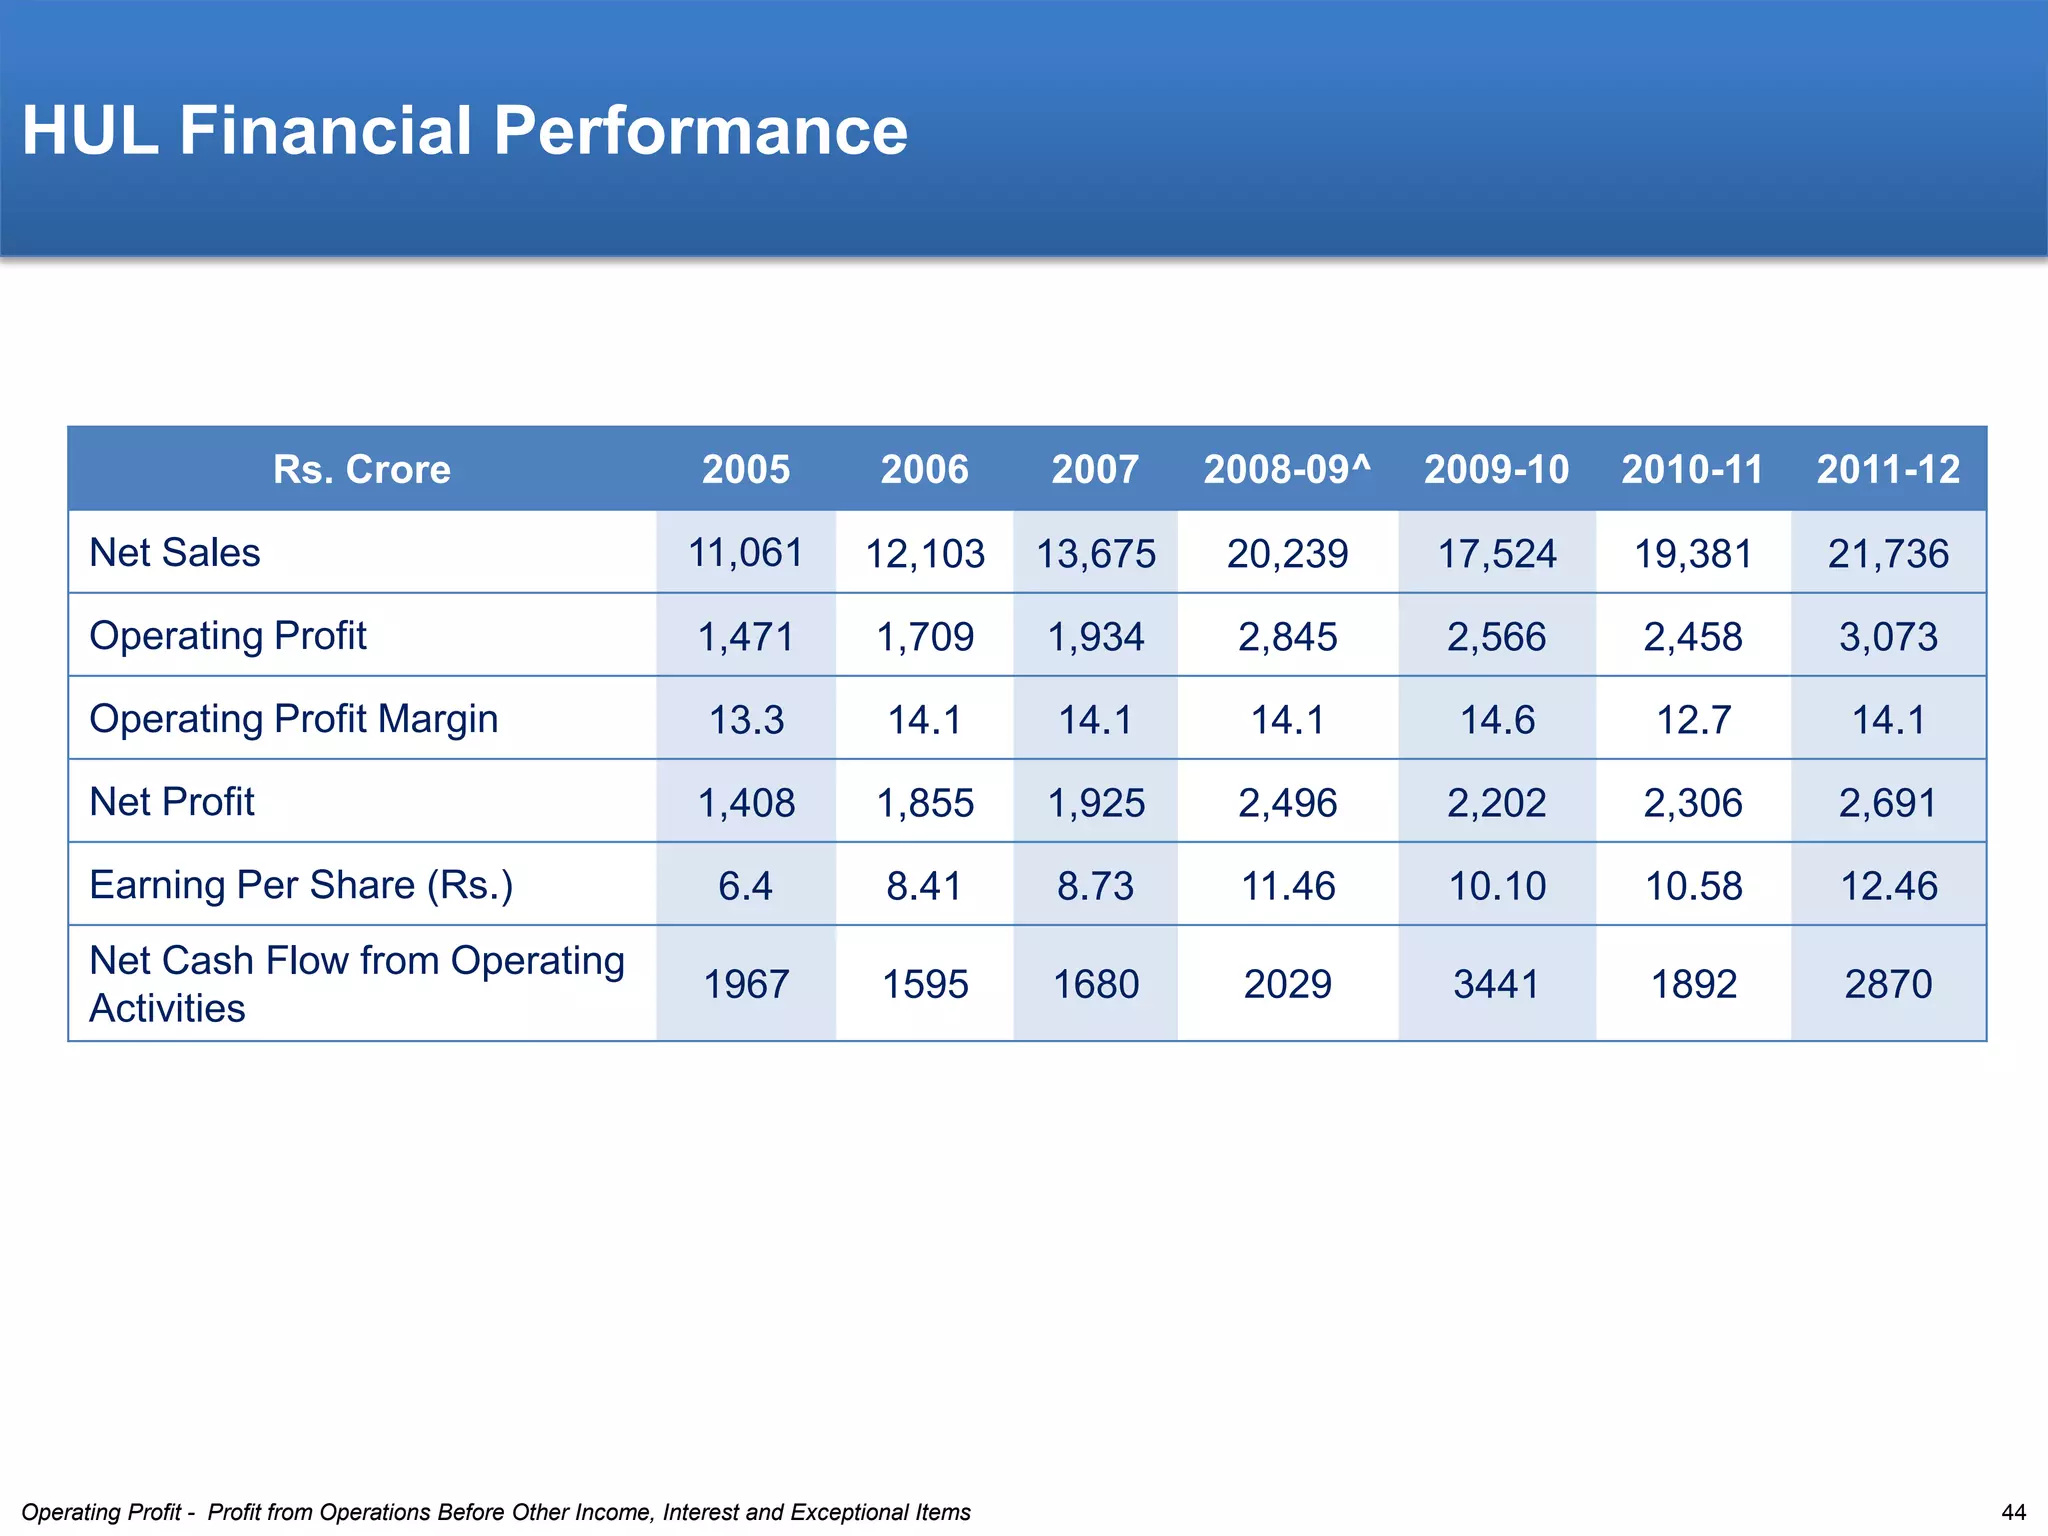
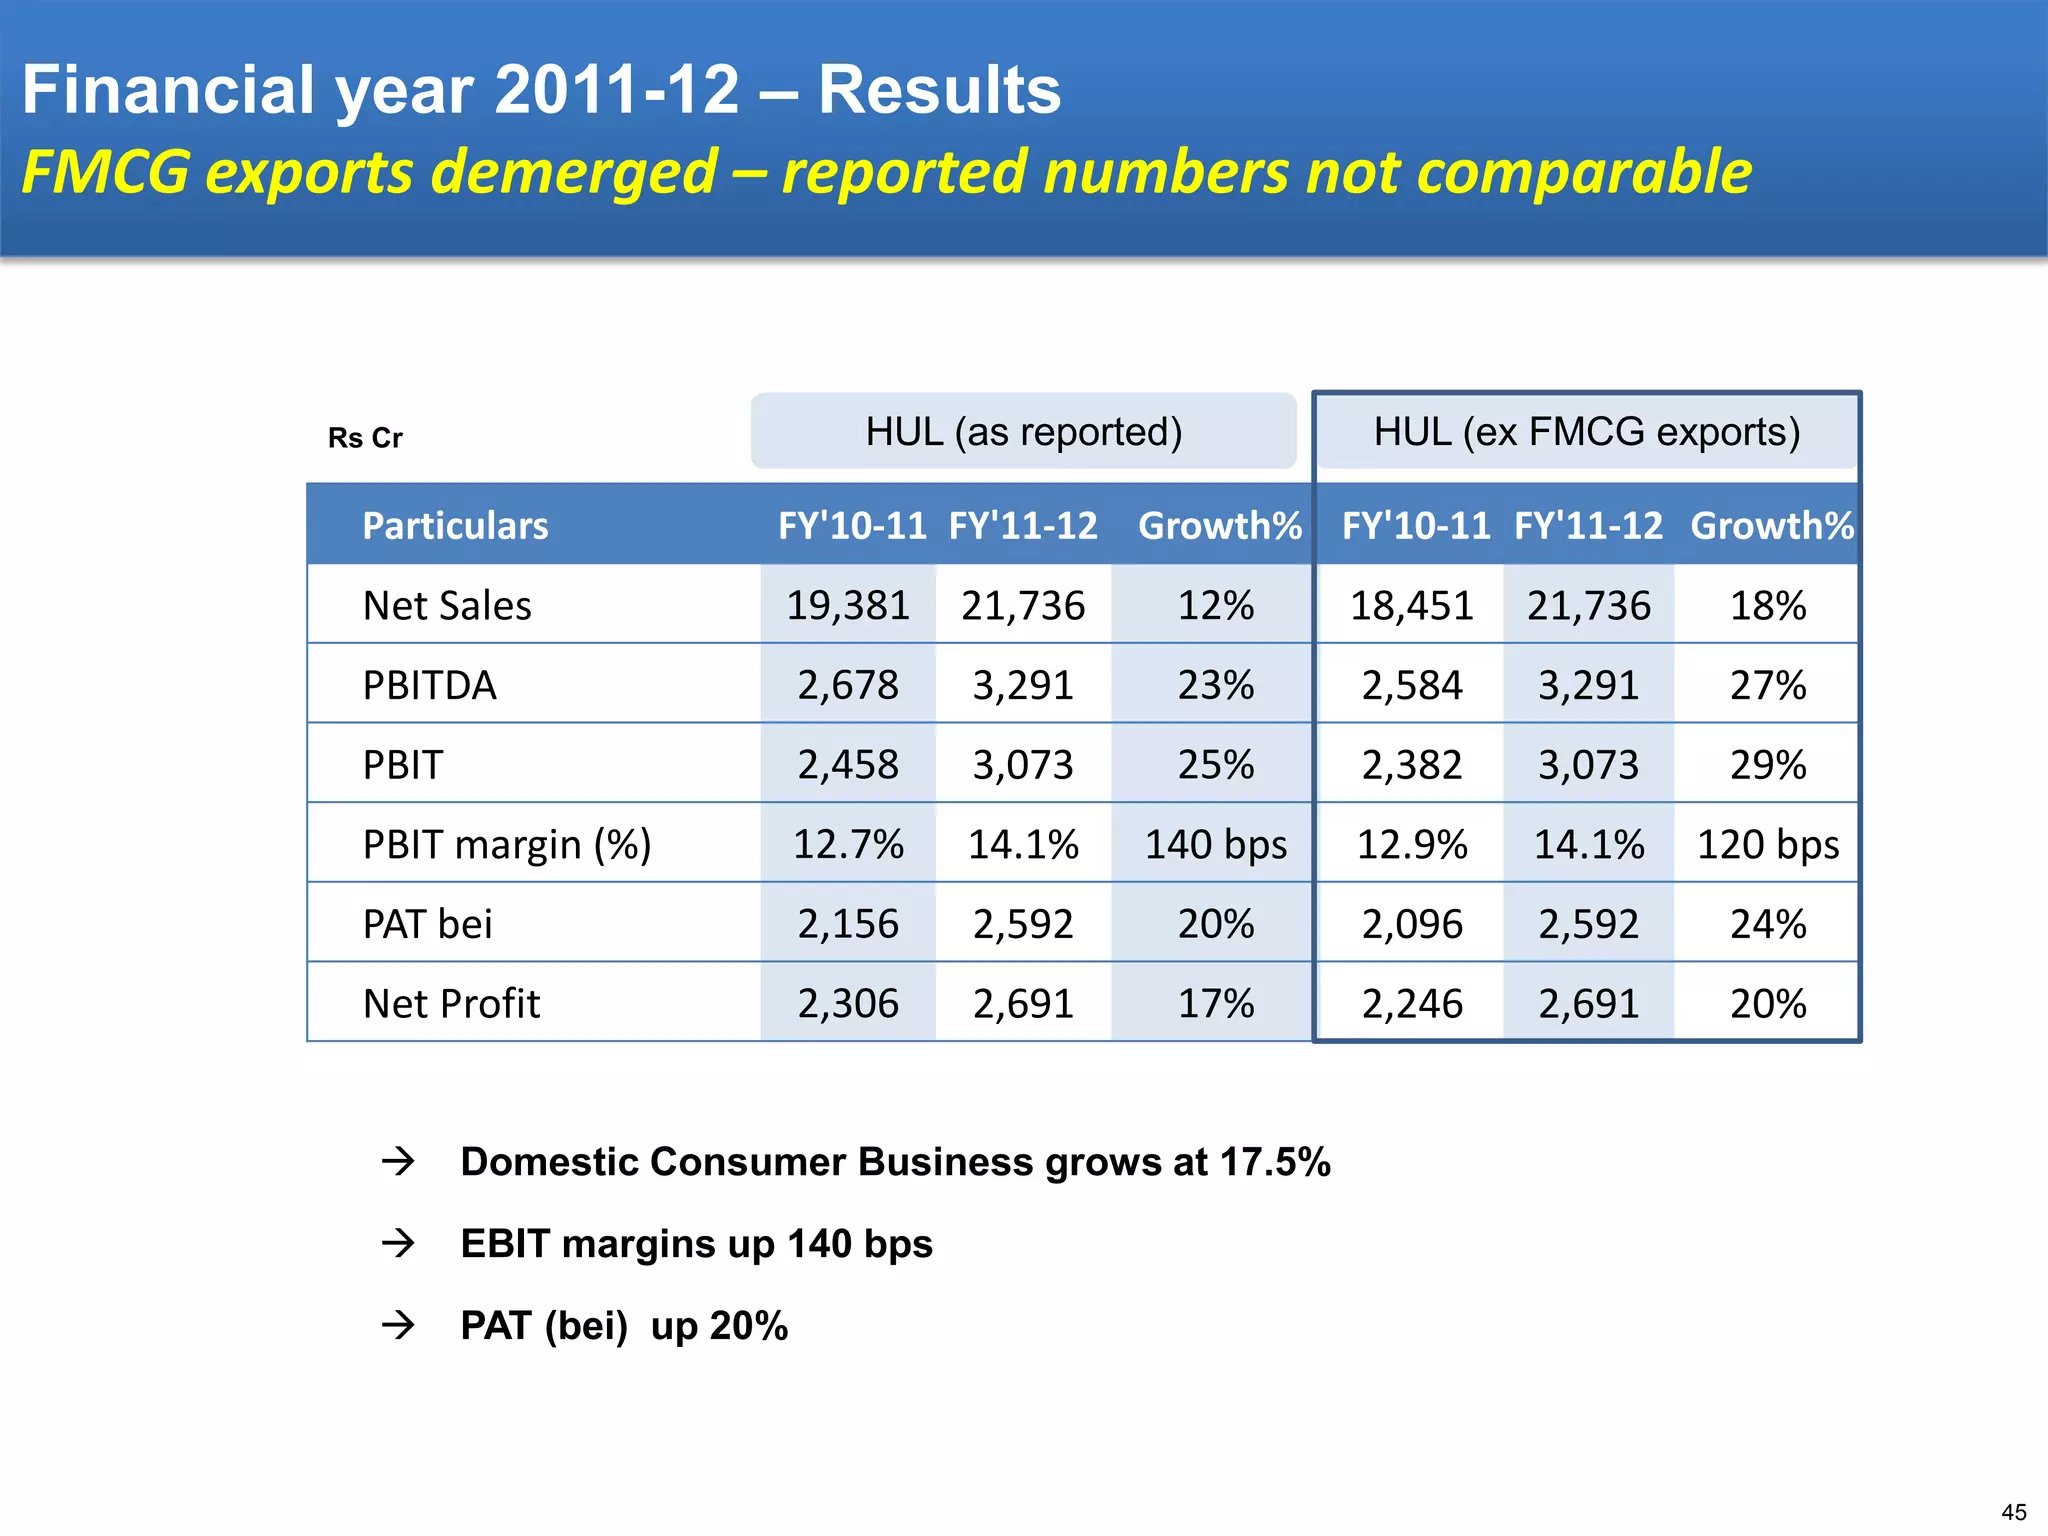
Hindustan Unilever Limited (HUL) is India's largest FMCG company with a portfolio spanning soaps and detergents, personal care, beverages, and packaged foods. HUL has a pan-India footprint reaching over 2 million outlets directly and 5 million outlets indirectly. HUL aims to deliver consistent growth through competitive growth, profitable growth, and responsible growth. HUL's strategy focuses on better quality products, stronger brands, bigger innovations, improved front-end execution, and driving returns on marketing investments. HUL is also committed to its Unilever Sustainable Living Plan to decouple growth from environmental impact. Financially, HUL achieved 17.5% domestic consumer sales growth and
Company : Unilever
International ICT Business - Telkom University 2015
*Dhaifina Idznitia Apriyani Naimi
*Isradila
*Nurul Fithri Sylvani
*Amasel A. Swasono
*Lui Anbar Rhainata
An introduction to the cryptocurrency investment platform Binance Savings.Any kyc Account
Learn how to use Binance Savings to expand your bitcoin holdings. Discover how to maximize your earnings on one of the most reliable cryptocurrency exchange platforms, as well as how to earn interest on your cryptocurrency holdings and the various savings choices available.
Understanding User Needs and Satisfying ThemAggregage
https://www.productmanagementtoday.com/frs/26903918/understanding-user-needs-and-satisfying-them
We know we want to create products which our customers find to be valuable. Whether we label it as customer-centric or product-led depends on how long we've been doing product management. There are three challenges we face when doing this. The obvious challenge is figuring out what our users need; the non-obvious challenges are in creating a shared understanding of those needs and in sensing if what we're doing is meeting those needs.
In this webinar, we won't focus on the research methods for discovering user-needs. We will focus on synthesis of the needs we discover, communication and alignment tools, and how we operationalize addressing those needs.
Industry expert Scott Sehlhorst will:
• Introduce a taxonomy for user goals with real world examples
• Present the Onion Diagram, a tool for contextualizing task-level goals
• Illustrate how customer journey maps capture activity-level and task-level goals
• Demonstrate the best approach to selection and prioritization of user-goals to address
• Highlight the crucial benchmarks, observable changes, in ensuring fulfillment of customer needs
Navigating the world of forex trading can be challenging, especially for beginners. To help you make an informed decision, we have comprehensively compared the best forex brokers in India for 2024. This article, reviewed by Top Forex Brokers Review, will cover featured award winners, the best forex brokers, featured offers, the best copy trading platforms, the best forex brokers for beginners, the best MetaTrader brokers, and recently updated reviews. We will focus on FP Markets, Black Bull, EightCap, IC Markets, and Octa.
Personal Brand Statement:
As an Army veteran dedicated to lifelong learning, I bring a disciplined, strategic mindset to my pursuits. I am constantly expanding my knowledge to innovate and lead effectively. My journey is driven by a commitment to excellence, and to make a meaningful impact in the world.
Discover the innovative and creative projects that highlight my journey throu...dylandmeas
Discover the innovative and creative projects that highlight my journey through Full Sail University. Below, you’ll find a collection of my work showcasing my skills and expertise in digital marketing, event planning, and media production.
The 10 Most Influential Leaders Guiding Corporate Evolution, 2024.pdfthesiliconleaders
In the recent edition, The 10 Most Influential Leaders Guiding Corporate Evolution, 2024, The Silicon Leaders magazine gladly features Dejan Štancer, President of the Global Chamber of Business Leaders (GCBL), along with other leaders.
B2B payments are rapidly changing. Find out the 5 key questions you need to be asking yourself to be sure you are mastering B2B payments today. Learn more at www.BlueSnap.com.
Taurus Zodiac Sign: Unveiling the Traits, Dates, and Horoscope Insights of th...my Pandit
Dive into the steadfast world of the Taurus Zodiac Sign. Discover the grounded, stable, and logical nature of Taurus individuals, and explore their key personality traits, important dates, and horoscope insights. Learn how the determination and patience of the Taurus sign make them the rock-steady achievers and anchors of the zodiac.
3.0 Project 2_ Developing My Brand Identity Kit.pptxtanyjahb
A personal brand exploration presentation summarizes an individual's unique qualities and goals, covering strengths, values, passions, and target audience. It helps individuals understand what makes them stand out, their desired image, and how they aim to achieve it.
Implicitly or explicitly all competing businesses employ a strategy to select a mix
of marketing resources. Formulating such competitive strategies fundamentally
involves recognizing relationships between elements of the marketing mix (e.g.,
price and product quality), as well as assessing competitive and market conditions
(i.e., industry structure in the language of economics).
2. Safe harbour statement
This Release / Communication, except for the historical information, may contain statements, including
the words or phrases such as ‘expects, anticipates, intends, will, would, undertakes, aims, estimates,
contemplates, seeks to, objective, goal, projects, should’ and similar expressions or variations of these
expressions or negatives of these terms indicating future performance or results, financial or
otherwise, which are forward looking statements. These forward looking statements are based on
certain expectations, assumptions, anticipated developments and other factors which are not limited
to, risk and uncertainties regarding fluctuations in earnings, market growth, intense competition and
the pricing environment in the market, consumption level, ability to maintain and manage key customer
relationship and supply chain sources and those factors which may affect our ability to implement
business strategies successfully, namely changes in regulatory environments, political instability,
change in international oil prices and input costs and new or changed priorities of the trade. The
Company, therefore, cannot guarantee that the forward looking statements made herein shall be
realized. The Company, based on changes as stated above, may alter, amend, modify or make
necessary corrective changes in any manner to any such forward looking statement contained herein
or make written or oral forward looking statements as may be required from time to time on the basis
of subsequent developments and events. The Company does not undertake any obligation to update
forward looking statements that may be made from time to time by or on behalf of the Company to
reflect the events or circumstances after the date hereof.
2
5. Our Vision
We work to create a better future everyday.
We help people feel good, look good and get more out of life with brands and
services that are good for them and good for others.
We will inspire people to take small everyday actions that can add up to a big
difference for the world.
We will develop new ways of doing business that will allow us to double the size
of our company while reducing our environmental impact.
5
6. HUL: India’s largest FMCG Company
More than 75 years
of experience in
India
Get more
out of life
Direct distribution
reach of > 2 Mn
stores
Products touch the
lives of 2 out of 3
Indians everyday
No.1 and strong
No.2 in more than
95% of the
business
7 brands > Rs. 1000 crs; 13 brands > Rs. 500 crs
17 out of top 100 most trusted brands in India^
^Brand Equity Survey, 2011
6
7. Pan India footprint
Population 1.2 billion
5545 Towns
638,000 villages
•
2.5 million outlets
5 million outlets
•
•
•
• • •
•
•
•
•
•
•
•
•
•
•
•
•
•
•
•
•
•
•
•
• •
• •
Source: Statistics on India, Total Coverage : Nielsen, Census of India 2011
•HUL manufacturing locations (own and outsourced)
Mn = Million
•
•
•
•
• • • •
•
•
•
~ 15,000 employees
•
~ 2,000 suppliers & associates
•
~ 70 Manufacturing locations
•
40+Depots, 2700+ Distributors
•
Direct coverage 2 mn+ outlets
7
8. Portfolio straddling the pyramid
Fabric Cleaning
Skin Cleansing
Soaps & Detergents: 48%
% contribution of the segment to total revenue (April - December 2011)
Hair
Skincare
Tooth Paste
Personal Products: 31%
8
9. Portfolio straddling the pyramid
Tea
Coffee
Beverages: 12%
% contribution of the segment to total revenue (April - December 2011)
Processed Foods
Ice Creams
Packaged Foods: 6%
Water
Others: 3%
9
10. External Recognition
Consumers
Customers
Most responsive supplier of
the year
6 EMVIES in 2011
6th most innovative company
globally - Forbes
eQ* at 89
Value Award by TESCO
India
(world class level)
*Nielsen Equity Management Program Score
Employees
Communities
No.1 Employer of choice by
Nielsen Campus track
Golden Peacock Global Award for Corporate
Social Responsibility for the year 2011
Golden Peacock Environment Management
Award for 2011 in the FMCG category
No.1 Employer by Aon Hewitt
Best Employer Brand in Asia,
2011
10
12. Large consumption opportunity
FM CG - $ bln
137
62
87
50
28
FY 10 E
FY 15 P
Base Case
FY 20 P
High Case
CAGR of 12% in base case; 17% with high estimates
Source: FMCG roadmap to 2020 – CII Report, 2010
12
13. Head room for growth
Consumption
Penetration
€ per capita consumption
All India penetration
Skin Care
Skin Care
2011
2011
2010
79
5.9 5.3
2010
79
65
63
48
45
3.2 2.7
0.6 0.6
China
Indonesia
India
Annual
Shampoo
2011
1.7 1.6
DQ
Dec
Hair Care
2010
2011
89
1.6 1.5
88
2010
79
75
63
60
0.5 0.4
China
Indonesia
India
Annual
Dec
Oral Care
Ice cream
2011
DQ
2011
2010
91
89
80
2010
78
63
2.4 2.4
60
1.2 1.1
0.3 0.3
China
Indonesia
India
Annual
Data Source: Euromonitor
Data Source: IMRB Factbook
DQ
Dec
13
14. Rising incomes to favor Personal Care and Foods
Demand elasticity
Personal Care / Foods explosion
7.7 x
LSM 8+ (new
categories)
4.9 x
LSM 8+
LSM 5-7
3.1 x
LSM 2-4
1.7 x
LSM 1
1x
0
5000
10000
LSM 1
LSM 2-4
Laundry, Skin Cleansing
LSM 5-7
LSM 8+
Pers Prod
Foods
Exp per HH / year (INR)
*HUL Participating Categories; HH: Households
*Source : Family Budget Survey, Consumer Panel
14
15. HUL: Uniquely positioned to exploit the opportunity
Portfolio
Strong brands across benefits & price points
Talent
Capabilities
Consumer understanding, supply chain,
go-to-market
Global leverage
No.1 Employer*, diverse talent pool
R&D, brand development, buying
*awarded by Aon Hewitt in 2011
15
17. Clear and compelling strategy
Strategic framework
Sustainable Living Plan
Our Goals
Consistent Growth
Competitive Growth
Profitable Growth
Responsible Growth
17
18. A business model that works
Virtuous circle of growth
Cost
Leverage
+
Efficiencies
Profitable
Volume
Growth
Innovation
A&P/R&D
Focused on execution
Cost
Savings
19. FY 2011-12: Delivered on goals
Competitive growth
Consistent growth
Profitable growth
Ahead of market
Volume led
Margin expansion
18
140 bps ↑
18
8
UVG
Market
FMCG growth %
17.5%
10
14
Price
USG
HUL
Domestic consumer
Sales growth
HUL
EBIT
HUL FMCG growth %
19
20. Winning Principles
Our first priority is to our consumers,
then customers, employees and
communities. When we fulfill our
responsibilities
to
them
our
shareholders will be rewarded.
23. Better quality products, stronger brands
Tripled blind product wins %
Improved brand equity scores
3X
2011
2X
3/4th
2010
of portfolio
holding/gaining *
X
2009
Measured for the top 25 brands; *Exit 2011 Vs second half 2009
23
24. Bigger, better and faster innovations
Covering 60%+ of portfolio
Lux relaunch with silk protein
extract
Rin bar relaunch with superior
formulation and packaging
Vim relaunched with “100
Nimbuon ki Shakti”
Fair & Lovely Future Tube:
Aspirational & affordable
Sunsilk Keratinology
Haircare range for salon treated hair
Dove: Nourishing Oil Care
range with Vita Oils
Fair & Lovely Facewashes
Lakme Sun expert
Dove Body lotions with
advanced deep care
complex
Now more accessible with
Re.1 sachet
Pepsodent G relaunched
Clear Relaunched
24
25. Bigger, better and faster innovations
Covering 60%+ of portfolio
0
Kissan range expanded and relaunched
Soupy Noodles
Rs.5 pack
Cup–a–Soup
instant soups
Pureit Marvella RO
Taj Mahal green Teabags
Taj Mahal flavoured Teabags
Brooke Bond 3 Roses
relaunched
Bru Gold
Bru Exotica
Bru Lite
25
28. Lead market development: Hair
More usage
More users
More benefits
Increasing Consumption in
Rural
Driving Hair conditioners
Serums, Masks, Treatments
for Salon treated hair
28
29. Stepping up front end execution
More stores
Better Stores
Better served*
310 bps ↑
DISTRIBUTED:
CORE SERVICED
6.5 Mn
Product
Proposition
: 2 Mn+
Place
Pack
Direct
Price
2010
2011
Promotion
* Modern Trade on shelf availability
29
31. Differentiated Supply Chain
Driving benefits across value chain
Live Superior Service.
Delivery Sustainable, Profitable Growth
World class
service
Consumer
perceived
quality
E2E
competitive
costs
Flawless execution, Safety and Sustainability
31
32. Focus on cash and savings
Step up in cost savings
Savings as a % of Turnover
Maximizing ROCE
Optimizing investments
% Contributed by
Delivering cash
TWC as a % of turnover
2010-11
2011-12
52%
Capacity
increase
in 2011
2008-09
2011-12
Productivity
Improvement
48%
New Capital
Investments
TWC: Trading working capital; includes debtors, creditors and inventory excludes cash; ROCE: Return on Capital employed
32
33. Driving Return on Marketing Investments
Getting more out of advertising
More ads pre-tested
Improvement in Ad preview scores
Production and media fees
Up by 50%
Up by 800 bps
Lower by 900 bps
Persuasion
70%
2010
2010
2011
2011
Awareness
33
34. Driving Return on Marketing Investments
Optimizing promotional spends
More green activities
Higher ROI
Up by > 50%
Higher by 1100 bps
Up 200 bps
ROI Positive
More activities evaluated
+
-/-
+
TO Growth
2010
ROI: Return on Investment
2011
2010
-/-
2011
34
36. Winning with People: Building a talent powerhouse
# 1 Best employer in India, 2011
awarded by Aon Hewitt
No.1 Employer of choice by Nielsen
Campus track
# 1 Dream employer across campuses*
High people engagement
108
65
HUL
62
TAS
59
P&G
BCG
.McKinsey & Co
100
55
53
2010
* Survey by Nielsen
2011
Indexed Employee Engagement Scores
38. Strengthening Performance culture
Sharper differentiation
Aligned goals
Reward linked to
performance
Variable
Standards of Leadership
Fixed
2006-07
Delivery
Performance culture index is up by 14% in 2011
2011-12
41. Unilever Sustainable Living Plan
India Highlights 2011
30 million people reached with Lifebuoy soap handwashing
programmes in 2010-11
30 million people have gained access to safe drinking water by
using Pureit in-home water purifier, since 2005
Around 60%of our major food and beverage brands – Brooke Bond,
Bru, Knorr, Kissan and Kwality Wall’s – comply with the ‘Healthy
Choice’ guidelines’
Reduced CO2 emissions by 14.7%, water use by 21.5% and
waste by 52.8% in our factories, over 2008 baseline
Improved CO2 efficiency in transportation by 17.8%
60% of tomatoes in Kissan Ketchup are sourced sustainably
41
44. HUL Financial Performance
Rs. Crore
2005
2006
2007
2008-09^
2009-10
2010-11
2011-12
Net Sales
11,061
12,103
13,675
20,239
17,524
19,381
21,736
Operating Profit
1,471
1,709
1,934
2,845
2,566
2,458
3,073
Operating Profit Margin
13.3
14.1
14.1
14.1
14.6
12.7
14.1
Net Profit
1,408
1,855
1,925
2,496
2,202
2,306
2,691
6.4
8.41
8.73
11.46
10.10
10.58
12.46
1967
1595
1680
2029
3441
1892
2870
Earning Per Share (Rs.)
Net Cash Flow from Operating
Activities
Operating Profit - Profit from Operations Before Other Income, Interest and Exceptional Items
44
45. Financial year 2011-12 – Results
FMCG exports demerged – reported numbers not comparable
HUL (as reported)
Rs Cr
HUL (ex FMCG exports)
Particulars
FY'10-11 FY'11-12 Growth% FY'10-11 FY'11-12 Growth%
Net Sales
19,381
21,736
12%
18,451
21,736
18%
PBITDA
2,678
3,291
23%
2,584
3,291
27%
PBIT
2,458
3,073
25%
2,382
3,073
29%
PBIT margin (%)
12.7%
14.1%
140 bps
12.9%
14.1%
120 bps
PAT bei
2,156
2,592
20%
2,096
2,592
24%
Net Profit
2,306
2,691
17%
2,246
2,691
20%
Domestic Consumer Business grows at 17.5%
EBIT margins up 140 bps
PAT (bei) up 20%
45
46. Performance trends – EPS and DPS
Earnings per Share (Rs.)
14.0
12.0
Dividend per Share (Rs.)
10.0
8.0
10.0
6.0
9.0
4.0
8.0
7.0
2.0
6.0
-
2011-12
2010-11
2009-10
2008-09
2007
2006
5.0
4.0
3.0
2.0
1.0
2008-09: 15 months period
Calendar year 2007, includes Platinum Jubilee special dividend of Rs.3 per share
2011-12
2010-11
2009-10
2008-09
2007
2006
-
47. Share Listing & Ownership
Shareholding pattern
Listing Details
Stock Exchange
Stock Code
Bombay Stock Exchange
500696
National Stock Exchange
Hindunilvr
Others
General 4%
Public
14%
FIIs
19%
Uniliver
53%
DII
8% MFs
2%
FII: Foreign Institutional Investors
Status as on 31st March, 2011
48. Corporate Governance
HUL firmly believes in maintaining high standards of
Corporate Governance
To succeed, we believe, requires the highest standards of corporate behaviour towards everyone we
work with, the communities we touch, and the environment on which we have an impact. This is our
road to sustainable, profitable growth and creating long-term value for our shareholders, our people,
and our business partners.
The Board of Directors of the Company represents an optimum mix of professionalism, knowledge and
experience. The total strength of the Board of Directors of the Company is nine Directors, comprising
Non-Executive Chairman, four Executive Directors and four Non-Executive Independent Directors.
“I believe that nothing can be greater than a business, however small it may be, that is governed by
conscience; and that nothing can be meaner or more petty than a business, however large,
governed without honesty and without brotherhood.”
– William Hesketh Lever
For details, refer investor center at:
http://www.hul.co.in/investorrelations/CorporateGovernance/?WT.LHNAV=Corporate_Governance
51. Further information & contact details
More information is available at http://www.hul.co.in/investorrelations/
The IR team can be contacted by
telephone as follows:
+91 22 39832211
Or by e-mail at:
Investor.Relations-hul@unilever.com