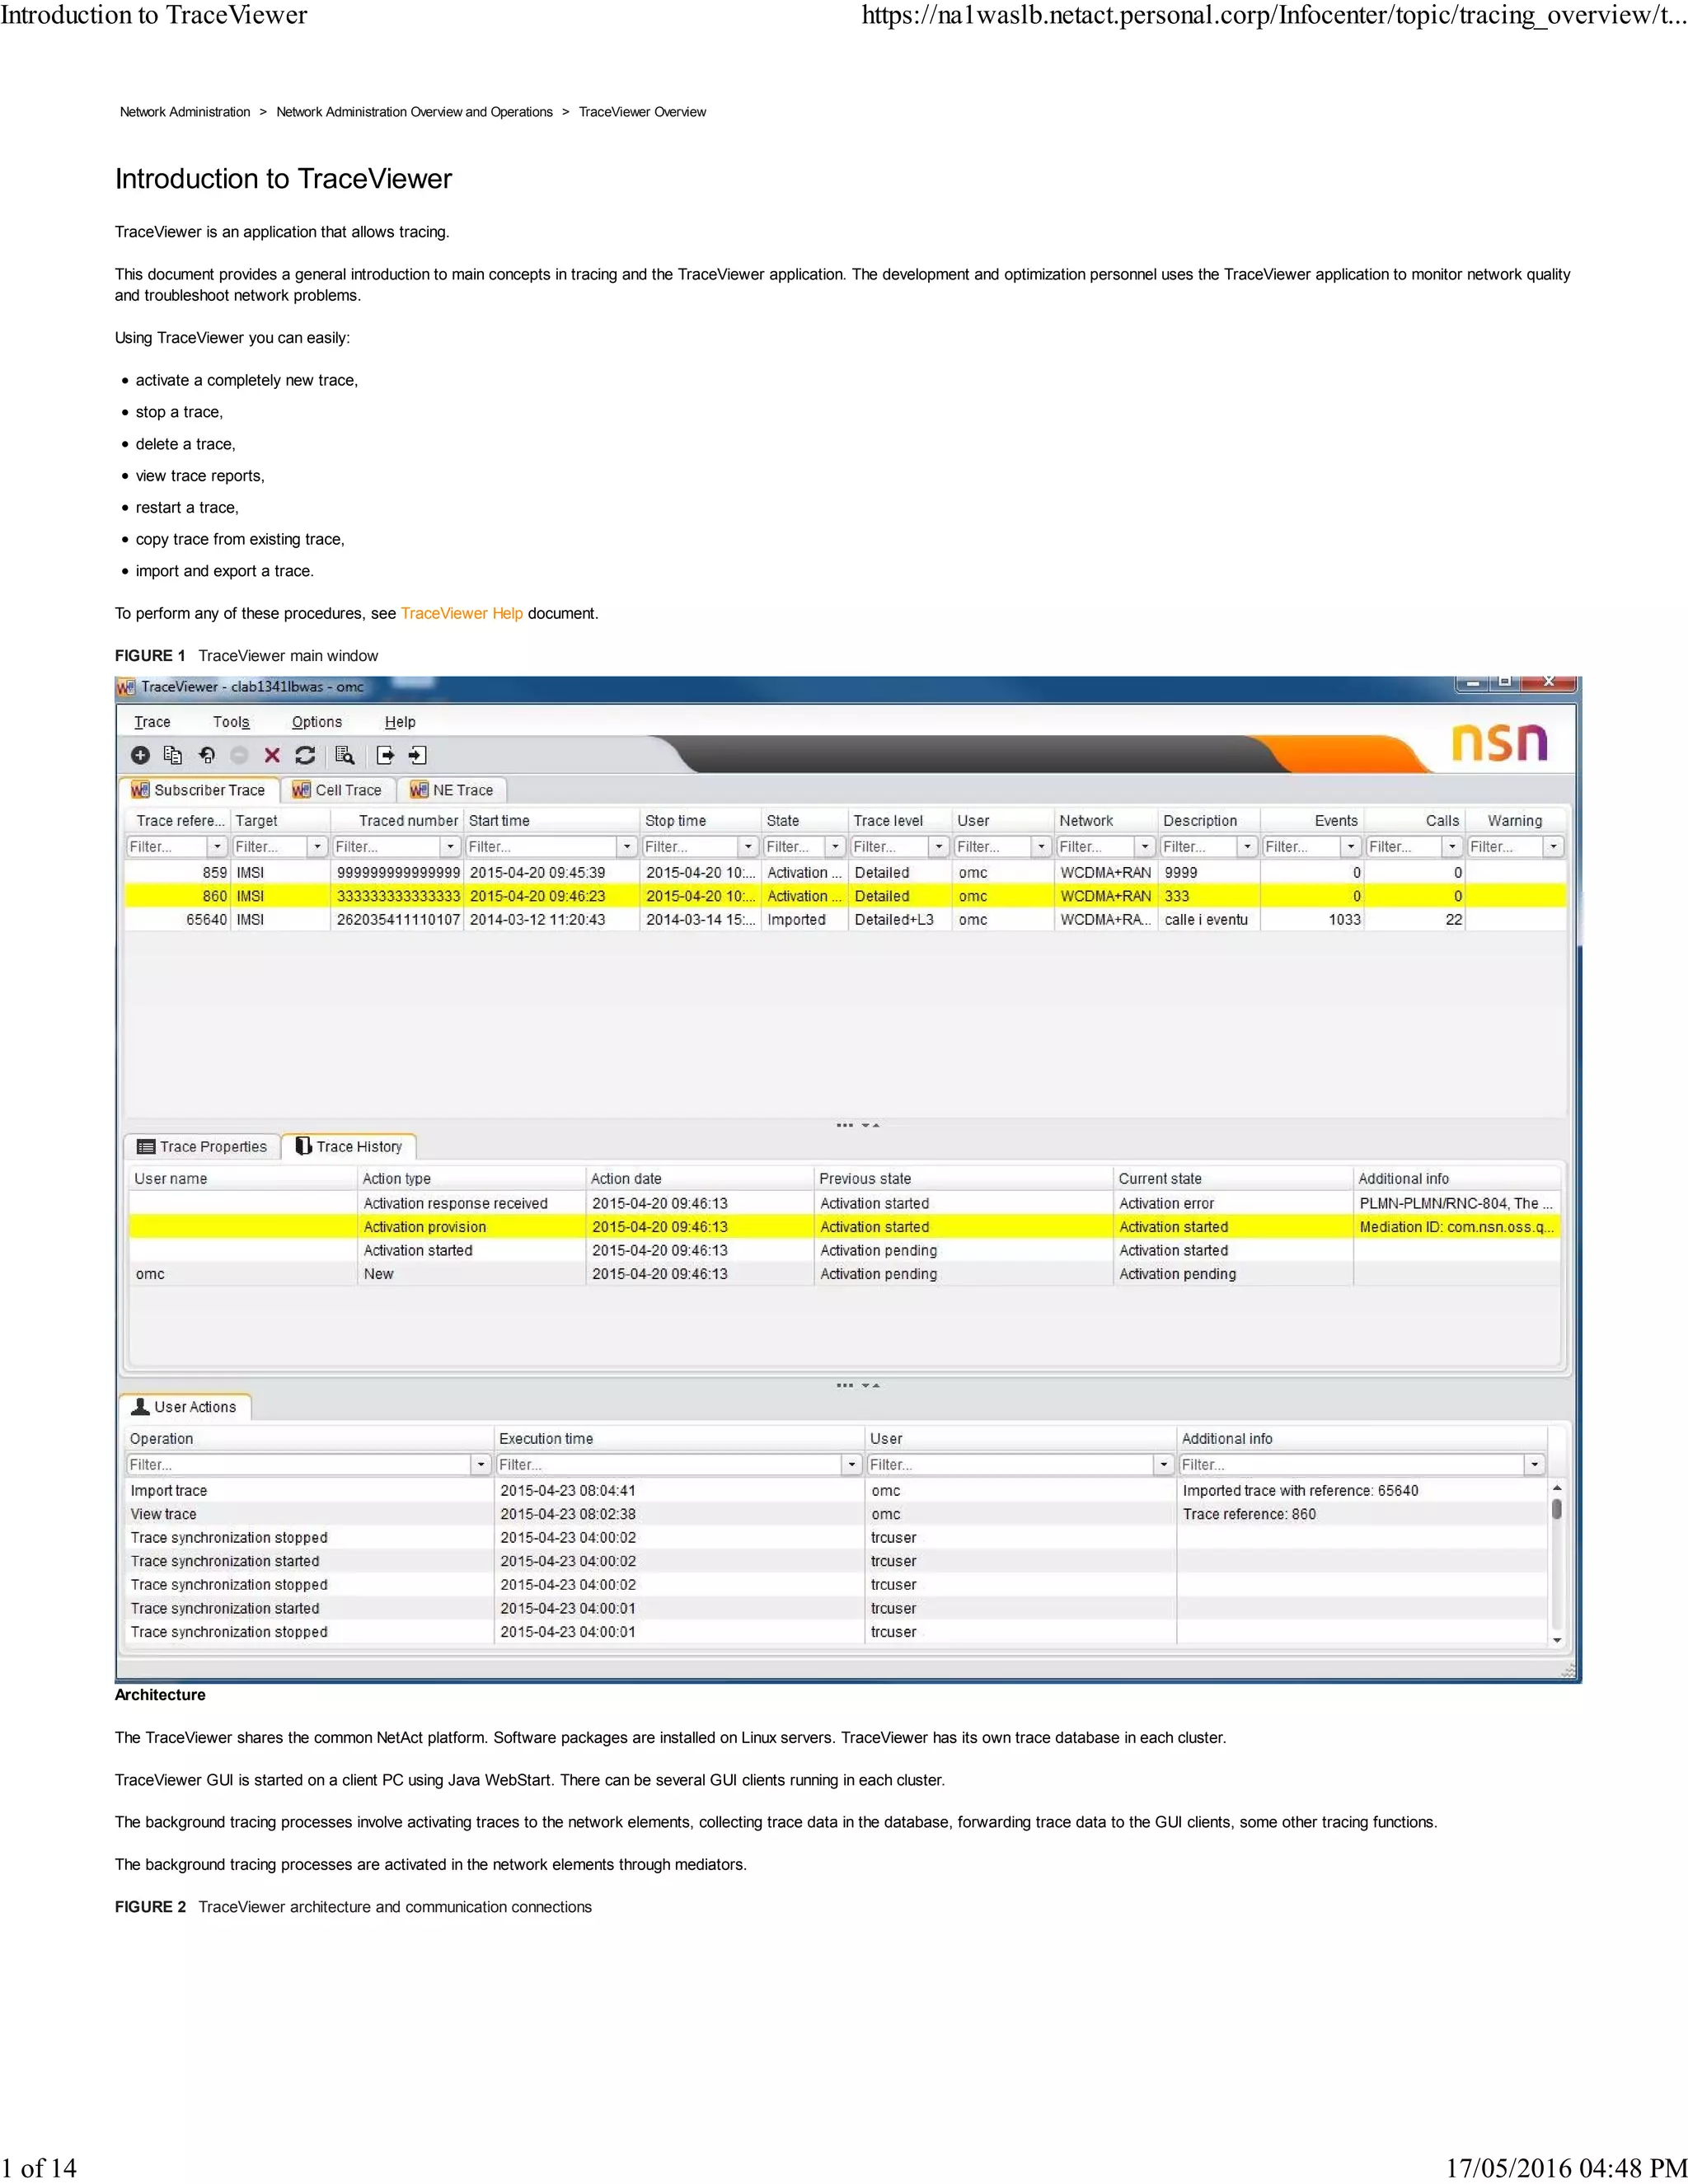
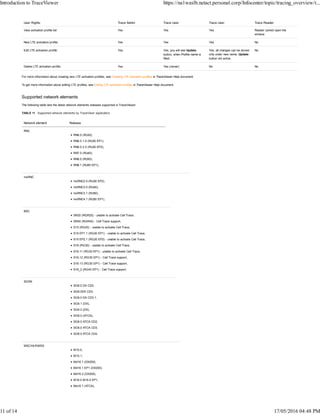
TraceViewer is an application that allows tracing of network elements and subscribers to monitor network quality and troubleshoot problems. It collects trace data from elements and stores it in a database where it can be viewed as reports. Key features of TraceViewer include activating new traces, stopping traces, deleting traces, and viewing trace reports. The architecture involves TraceViewer installing on Linux servers with a GUI accessed via Java WebStart, while background tracing processes activate traces in network elements and collect data.
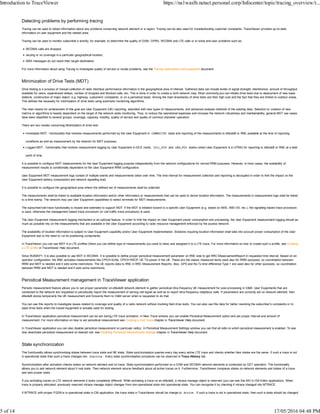
Call Setup Success Rate Definition and Troubleshooting Assim Mubder
The CSSR indicates the probability of successful calls initiated by the MS. The CSSR is an important KPI for evaluating the network performance. If this KPI is too low, the subscribers are not likely to make calls successfully. The user experience is thus affected.
This documents will help to understand the details procedure of GSM IDLE Mode Behavior. GSM Idle mode behavior starting from PLMN selection, GSM Cell Camp, Cell Selection, Cell Reselection, Location Update, Paging, System Information to Measurements procedures have been captured in this document.
. Overview
2. Handover Causes & Priorities
3. Threshold Comparison Process
4. Target Cell Evaluation Process
5. Handover Algorithms
Power Budget (PBGT)
Level & Quality (RXLEV & RXQUAL)
Umbrella (& Combined Umbrella/PBGT)
MS Speed (FMMS & MS_SPEED_DETECTION)
6. Imperative Handovers
Distance
Rapid Field Drop (RFD) & Enhanced Rapid Field Drop (ERFD)
7. Handover Timers
Call continuity - to ensure a call can be maintained as a MS moves geographical location from the coverage area of one cell to another
Call quality - to ensure that if an MS moves into a poor quality/coverage area the call can be moved from the serving cell to a neighbouring cell (with better quality) without dropping the call
Traffic Reasons - to ensure that the traffic within the network is optimally
distributed between the different layers/bands of a network
If 2 or more handover (PC) criteria are satisfied simultaneously the following priority list
is used in determining which process is performed;
. Uplink and downlink Interference
2. Uplink quality
3. Downlink quality
4. Uplink level
5. Downlink level
6. Distance
7. Enhanced (RFD)
8. Rapid Field Drop (RFD)
9. Slow moving MS
10. Better cell i.e. Periodic check (Power Budget HO or Umbrella HO)
11. PC: Lower quality/level thresholds (UL/DL)
12. PC: Upper quality/level thresholds (UL/DL)
Managing enterprise networks with cisco prime infrastructure_ 1 of 2Abdullaziz Tagawy
Network Management is define as monitoring, testing, configuring, and troubleshooting network components to meet a set of requirements defined by an organization.
The requirements include the smooth, efficient operation of the network that provides the predefined quality of service for users.
To accomplish this task, a network management system uses hardware, software, and humans.
ADVANCED MULTIMEDIA PLATFORM BASED ON BIG DATA AND ARTIFICIAL INTELLIGENCE IM...IJNSA Journal
The proposed work describes the design of a multimedia platform managing users and implementing cybersecurity. The paper describes in details the use cases of the whole platform embedding Big Data and artificial intelligence (AI) engine predicting network attacks. The platform has been tested by Tree Ensemble algorithm classifying and predicting anomalous server logs of possible attacks. The data logs are collected in Cassandra Big Data System enabling the AI training model. The work has been developed within the framework of a research industry project.
An Efficient Framework for Detection & Classification of IoT BotNet.pptxSandeep Maurya
The Internet of Things (IoT) has become an integral requirement to equip common life. According to IDC, the number of IoT devices may increase exponentially up to a trillion in near future. Thus, their cyberspace having inherent vulnerabilities leads to various possible serious cyber-attacks. So, the security of IoT systems becomes the prime concern for its consumers and businesses. Therefore, to enhance the reliability of IoT security systems, a better and real-time approach is required. For this purpose, the creation of a real-time dataset is essential for IoT traffic analysis. In this paper, the experimental testbed has been devised for the generation of a real-time dataset using the IoT botnet traffic in which each of the bots consists of several possible attacks. Besides, an extensive comparative study of the proposed dataset and existing datasets are done using popular Machine Learning (ML) techniques to show its relevance in the real-time scenario.
NON-INTRUSIVE REMOTE MONITORING OF SERVICES IN A DATA CENTREcscpconf
Non-intrusive remote monitoring of data centre services should be such that it does not require
(or minimal) modification of legacy code and standard practices. Also, allowing third party
agent to sit on every server in a data centre is a risk from security perspective. Hence, use of
standard such as SNMPv3 is advocated in this kind of environment. There are many tools (open
source or commercial) available which uses SNMP; but we observe that most of the tools do not
have an essential feature for auto-discovery of network. In this paper we present an algorithm
for remote monitoring of services in a data centre. The algorithm has two stages: 1) auto
discovery of network topology and 2) data collection from remote machine. Further, we
compare SNMP with WBEM and identify some other options for remote monitoring of services
and their advantages and disadvantages.
[White paper] detecting problems in industrial networks though continuous mon...TI Safe
Automation networks offer a range of real-time applications and data, making necessary the continuous monitoring of the quality of services. The parameters of QoS (Quality of Service) seek to address priorities, bandwidth allocation and network latency control. There are several QoS parameters to characterize a computer network, and that can be used for monitoring purposes.
Each SCADA network, in a healthy state, presents a specific QoS which rarely changes given the repetitive process of the IACS operations. The continuous monitoring of QoS parameters of an automation network may anticipate problems such as malware contamination and equipment failures like switches and routers. It is very important to be aware of these changes in behavior in order to receive alerts and promptly handle them, avoiding incidents that could compromise the operation of the network and be financially or environmentally costly.
In addition to the monitoring of network traffic, it is also necessary to monitor resource consumption of critical servers, such as the processing (CPU), memory, storage capacity and hard disk failures, among others.
This work aims to establish a method by which SCADA security professionals can differentiate and qualify any problems that may be occurring through continuous monitoring of the automation network performance parameters giving a more behavioral approach than current signature-based ones.
We presented a series of tests conducted in our laboratories in order to measure the performance of a simulated automation network parameters using a small SCADA network sandbox. First we measured the normal operating parameters of the network and reap its main graphics obtained with the proper tools. In a second step we practiced several attacks against the simulated automation network. During all attacks we collected the operating parameters of the network and its main graphics.
At the conclusion of the work we compared the graphs of the network in healthy state with the graphs of the network with the security incidents described above. We detailed how the network parameters were affected by each kind of incident and built a table showing the way the main parameters of an automation network were affected by the attacks
HOST AND NETWORK SECURITY by ThesisScientist.comProf Ansari
Network management means different things to different people. In some cases, it involves a solitary network consultant monitoring network activity with an outdated protocol analyzer. In other cases, network management involves a distributed database, auto polling of network devices, and high-end workstations generating real-time graphical views of network topology changes and traffic. In general, network management is a service that employs a variety of tools, applications, and devices to assist human network managers in monitoring and maintaining networks.
Elevating Tactical DDD Patterns Through Object CalisthenicsDorra BARTAGUIZ
After immersing yourself in the blue book and its red counterpart, attending DDD-focused conferences, and applying tactical patterns, you're left with a crucial question: How do I ensure my design is effective? Tactical patterns within Domain-Driven Design (DDD) serve as guiding principles for creating clear and manageable domain models. However, achieving success with these patterns requires additional guidance. Interestingly, we've observed that a set of constraints initially designed for training purposes remarkably aligns with effective pattern implementation, offering a more ‘mechanical’ approach. Let's explore together how Object Calisthenics can elevate the design of your tactical DDD patterns, offering concrete help for those venturing into DDD for the first time!
PHP Frameworks: I want to break free (IPC Berlin 2024)Ralf Eggert
In this presentation, we examine the challenges and limitations of relying too heavily on PHP frameworks in web development. We discuss the history of PHP and its frameworks to understand how this dependence has evolved. The focus will be on providing concrete tips and strategies to reduce reliance on these frameworks, based on real-world examples and practical considerations. The goal is to equip developers with the skills and knowledge to create more flexible and future-proof web applications. We'll explore the importance of maintaining autonomy in a rapidly changing tech landscape and how to make informed decisions in PHP development.
This talk is aimed at encouraging a more independent approach to using PHP frameworks, moving towards a more flexible and future-proof approach to PHP development.
State of ICS and IoT Cyber Threat Landscape Report 2024 previewPrayukth K V
The IoT and OT threat landscape report has been prepared by the Threat Research Team at Sectrio using data from Sectrio, cyber threat intelligence farming facilities spread across over 85 cities around the world. In addition, Sectrio also runs AI-based advanced threat and payload engagement facilities that serve as sinks to attract and engage sophisticated threat actors, and newer malware including new variants and latent threats that are at an earlier stage of development.
The latest edition of the OT/ICS and IoT security Threat Landscape Report 2024 also covers:
State of global ICS asset and network exposure
Sectoral targets and attacks as well as the cost of ransom
Global APT activity, AI usage, actor and tactic profiles, and implications
Rise in volumes of AI-powered cyberattacks
Major cyber events in 2024
Malware and malicious payload trends
Cyberattack types and targets
Vulnerability exploit attempts on CVEs
Attacks on counties – USA
Expansion of bot farms – how, where, and why
In-depth analysis of the cyber threat landscape across North America, South America, Europe, APAC, and the Middle East
Why are attacks on smart factories rising?
Cyber risk predictions
Axis of attacks – Europe
Systemic attacks in the Middle East
Download the full report from here:
https://sectrio.com/resources/ot-threat-landscape-reports/sectrio-releases-ot-ics-and-iot-security-threat-landscape-report-2024/
zkStudyClub - Reef: Fast Succinct Non-Interactive Zero-Knowledge Regex ProofsAlex Pruden
This paper presents Reef, a system for generating publicly verifiable succinct non-interactive zero-knowledge proofs that a committed document matches or does not match a regular expression. We describe applications such as proving the strength of passwords, the provenance of email despite redactions, the validity of oblivious DNS queries, and the existence of mutations in DNA. Reef supports the Perl Compatible Regular Expression syntax, including wildcards, alternation, ranges, capture groups, Kleene star, negations, and lookarounds. Reef introduces a new type of automata, Skipping Alternating Finite Automata (SAFA), that skips irrelevant parts of a document when producing proofs without undermining soundness, and instantiates SAFA with a lookup argument. Our experimental evaluation confirms that Reef can generate proofs for documents with 32M characters; the proofs are small and cheap to verify (under a second).
Paper: https://eprint.iacr.org/2023/1886
UiPath Test Automation using UiPath Test Suite series, part 4DianaGray10
Welcome to UiPath Test Automation using UiPath Test Suite series part 4. In this session, we will cover Test Manager overview along with SAP heatmap.
The UiPath Test Manager overview with SAP heatmap webinar offers a concise yet comprehensive exploration of the role of a Test Manager within SAP environments, coupled with the utilization of heatmaps for effective testing strategies.
Participants will gain insights into the responsibilities, challenges, and best practices associated with test management in SAP projects. Additionally, the webinar delves into the significance of heatmaps as a visual aid for identifying testing priorities, areas of risk, and resource allocation within SAP landscapes. Through this session, attendees can expect to enhance their understanding of test management principles while learning practical approaches to optimize testing processes in SAP environments using heatmap visualization techniques
What will you get from this session?
1. Insights into SAP testing best practices
2. Heatmap utilization for testing
3. Optimization of testing processes
4. Demo
Topics covered:
Execution from the test manager
Orchestrator execution result
Defect reporting
SAP heatmap example with demo
Speaker:
Deepak Rai, Automation Practice Lead, Boundaryless Group and UiPath MVP
Epistemic Interaction - tuning interfaces to provide information for AI supportAlan Dix
Paper presented at SYNERGY workshop at AVI 2024, Genoa, Italy. 3rd June 2024
https://alandix.com/academic/papers/synergy2024-epistemic/
As machine learning integrates deeper into human-computer interactions, the concept of epistemic interaction emerges, aiming to refine these interactions to enhance system adaptability. This approach encourages minor, intentional adjustments in user behaviour to enrich the data available for system learning. This paper introduces epistemic interaction within the context of human-system communication, illustrating how deliberate interaction design can improve system understanding and adaptation. Through concrete examples, we demonstrate the potential of epistemic interaction to significantly advance human-computer interaction by leveraging intuitive human communication strategies to inform system design and functionality, offering a novel pathway for enriching user-system engagements.
Accelerate your Kubernetes clusters with Varnish CachingThijs Feryn
A presentation about the usage and availability of Varnish on Kubernetes. This talk explores the capabilities of Varnish caching and shows how to use the Varnish Helm chart to deploy it to Kubernetes.
This presentation was delivered at K8SUG Singapore. See https://feryn.eu/presentations/accelerate-your-kubernetes-clusters-with-varnish-caching-k8sug-singapore-28-2024 for more details.
GDG Cloud Southlake #33: Boule & Rebala: Effective AppSec in SDLC using Deplo...James Anderson
Effective Application Security in Software Delivery lifecycle using Deployment Firewall and DBOM
The modern software delivery process (or the CI/CD process) includes many tools, distributed teams, open-source code, and cloud platforms. Constant focus on speed to release software to market, along with the traditional slow and manual security checks has caused gaps in continuous security as an important piece in the software supply chain. Today organizations feel more susceptible to external and internal cyber threats due to the vast attack surface in their applications supply chain and the lack of end-to-end governance and risk management.
The software team must secure its software delivery process to avoid vulnerability and security breaches. This needs to be achieved with existing tool chains and without extensive rework of the delivery processes. This talk will present strategies and techniques for providing visibility into the true risk of the existing vulnerabilities, preventing the introduction of security issues in the software, resolving vulnerabilities in production environments quickly, and capturing the deployment bill of materials (DBOM).
Speakers:
Bob Boule
Robert Boule is a technology enthusiast with PASSION for technology and making things work along with a knack for helping others understand how things work. He comes with around 20 years of solution engineering experience in application security, software continuous delivery, and SaaS platforms. He is known for his dynamic presentations in CI/CD and application security integrated in software delivery lifecycle.
Gopinath Rebala
Gopinath Rebala is the CTO of OpsMx, where he has overall responsibility for the machine learning and data processing architectures for Secure Software Delivery. Gopi also has a strong connection with our customers, leading design and architecture for strategic implementations. Gopi is a frequent speaker and well-known leader in continuous delivery and integrating security into software delivery.
Smart TV Buyer Insights Survey 2024 by 91mobiles.pdf91mobiles
91mobiles recently conducted a Smart TV Buyer Insights Survey in which we asked over 3,000 respondents about the TV they own, aspects they look at on a new TV, and their TV buying preferences.
Transcript: Selling digital books in 2024: Insights from industry leaders - T...BookNet Canada
The publishing industry has been selling digital audiobooks and ebooks for over a decade and has found its groove. What’s changed? What has stayed the same? Where do we go from here? Join a group of leading sales peers from across the industry for a conversation about the lessons learned since the popularization of digital books, best practices, digital book supply chain management, and more.
Link to video recording: https://bnctechforum.ca/sessions/selling-digital-books-in-2024-insights-from-industry-leaders/
Presented by BookNet Canada on May 28, 2024, with support from the Department of Canadian Heritage.
DevOps and Testing slides at DASA ConnectKari Kakkonen
My and Rik Marselis slides at 30.5.2024 DASA Connect conference. We discuss about what is testing, then what is agile testing and finally what is Testing in DevOps. Finally we had lovely workshop with the participants trying to find out different ways to think about quality and testing in different parts of the DevOps infinity loop.
Observability Concepts EVERY Developer Should Know -- DeveloperWeek Europe.pdfPaige Cruz
Monitoring and observability aren’t traditionally found in software curriculums and many of us cobble this knowledge together from whatever vendor or ecosystem we were first introduced to and whatever is a part of your current company’s observability stack.
While the dev and ops silo continues to crumble….many organizations still relegate monitoring & observability as the purview of ops, infra and SRE teams. This is a mistake - achieving a highly observable system requires collaboration up and down the stack.
I, a former op, would like to extend an invitation to all application developers to join the observability party will share these foundational concepts to build on:
Observability Concepts EVERY Developer Should Know -- DeveloperWeek Europe.pdf
Introduction to trace viewer
1. Network Administration > Network Administration Overview and Operations > TraceViewer Overview
Introduction to TraceViewer
TraceViewer is an application that allows tracing.
This document provides a general introduction to main concepts in tracing and the TraceViewer application. The development and optimization personnel uses the TraceViewer application to monitor network quality
and troubleshoot network problems.
Using TraceViewer you can easily:
activate a completely new trace,
stop a trace,
delete a trace,
view trace reports,
restart a trace,
copy trace from existing trace,
import and export a trace.
To perform any of these procedures, see TraceViewer Help document.
FIGURE 1 TraceViewer main window
Architecture
The TraceViewer shares the common NetAct platform. Software packages are installed on Linux servers. TraceViewer has its own trace database in each cluster.
TraceViewer GUI is started on a client PC using Java WebStart. There can be several GUI clients running in each cluster.
The background tracing processes involve activating traces to the network elements, collecting trace data in the database, forwarding trace data to the GUI clients, some other tracing functions.
The background tracing processes are activated in the network elements through mediators.
FIGURE 2 TraceViewer architecture and communication connections
Introduction to TraceViewer https://na1waslb.netact.personal.corp/Infocenter/topic/tracing_overview/t...
1 of 14 17/05/2016 04:48 PM
2. Introduction to tracing
Operators can use tracing to troubleshoot problems with mobile equipment or subscriber’s connections and to follow up customer complaints. Tracing can be also used to monitor the network and to check the
results of the network optimization.
Tracing is a concept name for an optional NetAct functionality, which is performed by the TraceViewer application, and allows the tracing of mobile equipment and subscribers in mobile networks.
TraceViewer enables global tracing, which means that a user can trace:
Mobile Station International Subscriber Directory Number (MSISDN),
International Mobile Equipment Identity (IMEI) number,
International Mobile Subscriber Identity (IMSI) number,
IMS Public User Identity (IMPU) number,
IMS Private User Identity (IMPI) number,
throughout the network.
TraceViewer can activate traces in several network elements, including Nokia Solutions and Networks RNC, FlexiNS, MSC, eNB, IADA, BSC, HLR, openTAS, IMS. In addition, TraceViewer receives events from
Nokia Solutions and Networks BSC and MGW network elements.
Trace data is collected from the network elements and is sent to TraceViewer, where it can be viewed in the form of reports.
Audit Trail logging
The Trace core subsystem writes log files that are saved to a trace folder, that is, to the debug folder of the process. These files are named as /var/opt/oss/log/audit/oss_change0_0.log and they
include information of each Trace user action:
log file lists the time
user name
name of the operation that has been performed with the TraceViewer
The log files are written daily, and they are saved to a folder in which all process-specific operations are located. The folder is emptied weekly by the platform.
The log file can be used to ascertain that tracing is directed to the correct target. These logs can be viewed with the Audit Trail.
The log file consists of a header and a formal body part. The header contains the time and action information. The table below describes all possible entries in the log file body part.
TABLE 1 Elements in the log entry body part
Identifier Description
User The account name of the user invoking the operation.
Operation Identifies the operation that was performed.
For TraceViewer operations these are:
Introduction to TraceViewer https://na1waslb.netact.personal.corp/Infocenter/topic/tracing_overview/t...
2 of 14 17/05/2016 04:48 PM
3. Identifier Description
activate_trace
stop_trace
remove_trace
copy_trace
restart_trace
Effect code Identifies whether the operation was create (C) or delete (D).
For TraceViewer operations these are:
copy 'C'
restart 'C'
activate_trace 'C'
deactivate_trace 'D'
remove_trace 'D'
Client address IP address from which the user was connected.
Category code Subscriber-sensitive configuration (SUBC).
Timestamp Timestamp of the operation, which should also include the time zone.
Format for this entry is:
2011-12-05T13:06:55.792+0200
Element Name of the element on which the operation was performed.
Identifier Identifies whether the operation succeeded or not.
T=succeeded
F=failure
Operation identifier Identifiers of the operations:
Activation
Deactivation
Copy
Restart
Deletion
Resource type The resource type for the following resource values that the operation affected.
This depends on the application and the operation (for example access_point, msisdn, imsi).
Resource Resource value, for example, target IMSI/IMEI/MSISDN number.
Cause code The reason for the operation failure. The allowed values are:
‘N/A’
The following is an example of a possible application startup entry in a log file:
trace activation:
2015-04-06T14:07:45.795+0200 | (104,713) | OSS_CHANGE |
com.nsn.nas.trc.trc_core.beans.act.TraceOperationManagerBean.requestActivation | audit[ | Source='Server' | User
identity='omc' | Operation identifier='Activation' | Success code='T' | Cause code='N/A' | Identifier='SUCCESS' | Target
element='TraceViewer' | Client address='10.9.167.172' |
Resource type='NetworkElements' |
Resource='PLMN-123/RNC-124,PLMN-123/RNC-123' | Resource
type='TraceReference' | Resource='952' | Source session
identifier='' | Target session identifier='' | Category code='SUBC' | Effect code='C' | Network Transaction
identifier='' | Source user identity='' | Target user
identity='' | Timestamp='1323083215791']
noticication about trace activation:
2015-04-06T14:07:46.637+0200 | (104,810) | OSS_CHANGE |
com.nsn.nas.trc.trc_core.beans.nh.handlers.ReportOperationStatusHandler.process
| audit[ | Source='Server' | User identity='omc' | Operation
identifier='Activation' | Success code='T' | Cause code='N/A' |
Identifier='SUCCESS' | Target element='PLMN-123/RNC-124' |
Client address='10.9.167.172' | Resource type='TraceReference'
| Resource='952' | Source session identifier='' | Target session
identifier='' | Category code='SUBC' | Effect code='C' | Network
Transaction identifier='' | Source user identity='' | Target
user identity='' | Timestamp='1323083216636']
Tracing concepts
Introduction to TraceViewer https://na1waslb.netact.personal.corp/Infocenter/topic/tracing_overview/t...
3 of 14 17/05/2016 04:48 PM
4. This chapter provides a list of concepts (terms) related to tracing and the TraceViewer application.
Concept Description
Subscriber trace Subscriber trace refers to the tracing of a subscriber using the IMSI number as the trace target.
Cell trace Cell trace refers to trace data from eNodeB in LTE system. Trace can be cell based that allows to collect all signaling messages for calls within the cell, moreover it can be
subscriber traced or can be set to interface tracing that allows to collect data from whole interface.
Offline Tracing Trace data can be viewed as an offline trace.
Offline: All data is stored in the trace database, from where it can be retrieved later for offline viewing.
Trace data Trace data is gathered from the network elements and stored in the trace database, from where it can be accessed for offline viewing or sent directly to TraceViewer for online
viewing and stored in the database. Data is collected in counters, which are grouped together in observation reports.
Trace event A trace event is a measurement or a notification of a change in the state of the traced mobile equipment or a subscriber. The event may cause an observation report to be
generated. For example, the connection with the network is set, the cell is added to the active set, then a report is generated including information about observation
(RAN_ActSetCell).
Trace database The TraceViewer owns a database.
Trace observation A trace observation report is a set of counters related to particular events collected by a network element. For example, the TBF observation for GPRS trace is an observation
report (GSMBSC25) that contains counters related to temporary block flow (TBF). These counters include information about the cause of the TBF release and the TBF
reallocation time.
Note:
Trace observations (observation reports) differ from TraceViewer reports.
Trace reference value A trace reference is an integer between 1 and 65534 used to identify traces. The trace reference is automatically assigned by TraceViewer when a trace is created in
TraceViewer. For more information, see Setting trace reference value section.
TraceViewer reports TraceViewer allows you to view the trace data in the form of reports. There are four report sets:
GSM reports,
GPRS reports,
WCDMA reports,
LTE reports,
IMS reports.
Note:
There is a difference between an observation report (Trace observation), which is a collection of counters related to specific events gathered from the network element, and
a report in TraceViewer, which is a graphical or textual representation of the data in the observation report.
Using TraceViewer
TraceViewer can be used in the network maintenance and restoration process as well as in solving end-user problems. This chapter presents some examples of the TraceViewer functionality.
Activating traces
Note:
You should not activate, deactivate and delete traces manually. You can only perform these using TraceViewer. Deleting traces directly in NEs is forbidden and causes unstability of the system.
If you activate trace manually in the network element, trace data coming into TraceViewer is shown as an unknown trace.
You can activate a trace in more than one network element, but the network elements have to be of the same type.
In TraceViewer, it is possible to create, activate, stop, and delete traces. Trace data can be exported to a XML file. For a description of the user interface and instructions on how to use TraceViewer, see the
TraceViewer Help document. For example procedures, see the Tracing Subscribers and Equipment document.
Certain network elements define an expiration time for their traces, which cannot be modified with TraceViewer. After the defined time has expired, the NE deactivates the trace, even if you prolong it with
TraceViewer.
To know how to activate new trace, see Creating a new trace in TraceVeiwer Help document.
When a trace is in Active state, data is coming to TraceViewer application. It may occur that amount of data is too huge and it may overload NetAct database. To protect application from that scenario a
protection mechanism is introduced. In that case, trace which you have activated is going to be de-activated automatically and data is no longer saved into TraceViewer database. You can see in User Actions tab
an information that overload mechanism was performed and trace reference numbers of traces which has been deactivated.
Note:
TraceViewer can show currently active traces on Network Element after executing LTE trace synchronization (from Tools menu select Synchronize Traces/LTE Traces). After that operation, there will be
active LTE traces for trcuser user and activation profile described as Externaly created and they can be deactivated by user via TraceViewer GUI.
Attention:
It is scritly recommended to use TraceViewer as one and only tool for managing traces in the network. It allows to avoid many possible problems with wrong configuration, not coming data or other not
predictable issues.
If external traces (e.g. activated via CM Editor) have to be used, be advised that MTRACEs and LTRACEs must be unically defined. E-UTRAN trace identifier - Trace ID must be unique on NetAct level.
Analysing trace data
The data presented in the TraceViewer reports is taken from observation reports sent by the network elements. For more information on how to analyse TraceViewer reports, see Viewing a trace in TraceViewer
Help document.
Introduction to TraceViewer https://na1waslb.netact.personal.corp/Infocenter/topic/tracing_overview/t...
4 of 14 17/05/2016 04:48 PM
5. Detecting problems by performing tracing
Tracing can be used to obtain information about any problems concerning network element or a region. Tracing can be also used for troubleshooting customer complaints. TraceViewer provides up-to-date
information on user equipment and the related area.
Tracing can be used to monitor subscriber’s activity, for example, to determine the quality of GSM, GPRS, WCDMA and LTE calls or to solve end-user problems such as:
WCDMA calls are dropped,
varying or no coverage in a particular geographical location,
SMS messages do not reach their target destination.
For more information about using Tracing to investigate quality of service or locate problems, see the Tracing Subscribers and Equipment document.
Minimization of Drive Tests (MDT)
Drive testing is a process of manual collection of radio interface performance information in the geographical area of interest. Gathered data can include levels of signal strength, interference, amount of throughput
available for users, experienced delays, number of dropped and blocked calls, etc. This is done in order to create a QoS network map. Most commonly,you can initiate drive tests due to deployment of new base
stations, construction of major object, e.g. highway, customers’ complaints, or on a periodical basis. Among the main drawbacks of drive tests are their high cost and the fact that they are limited to outdoor areas.
This defines the necessity for minimization of drive tests using automatic monitoring algorithms.
The main means for achievement of this goal are User Equipment (UE) reporting, extended with new types of measurements, and advanced analysis methods of the existing data. Selection or creation of new
metrics or algorithms is heavily dependent on the target of the network state monitoring. Thus, to reduce the operational expenses and increase the network robustness and maintainability, general MDT use cases
have been classified to several groups: coverage, capacity, mobility, quality of service and quality of common channels’ operation.
There are two modes concerning Minimization of drive test:
Immediate MDT - functionality that involves measurements performed by the User Equipment in CONNECTED state and reporting of the measurements to eNodeB or RNC available at the time of reporting
conditions as well as measurement by the network for MDT purposes.
Logged MDT - functionality that involves measurement logging by User Equipment in IDLE mode, CELL_PCH and URA_PCH states (when User Equipment is in UTRA) for reporting to eNodeB or RNC at a later
point of time.
It is possible to configure MDT measurements for the User Equipment logging purpose independently from the network configurations for normal RRM purposes. However, in most cases, the availability of
measurement results is conditionally dependent on the User Equipment RRM configuration.
User Equipment MDT measurement logs consist of multiple events and measurements taken over time. The time interval for measurement collection and reporting is decoupled in order to limit the impact on the
User Equipment battery consumption and network signalling load.
It is possible to configure the geographical area where the defined set of measurements shall be collected.
The measurements shall be linked to available location information and/or other information or measurements that can be used to derive location information. The measurements in measurement logs shall be linked
to a time stamp. The network may use User Equipment capabilities to select terminals for MDT measurements.
The subscriber/cell trace functionality is reused and extended to support MDT. If the MDT is initiated toward to a specific User Equipment (e.g. based on IMSI, IMEI-SV, etc.), the signalling based trace procedure
is used, otherwise the management based trace procedure (or cell traffic trace procedure) is used.
The User Equipment measurement logging mechanism is an optional feature. In order to limit the impact on User Equipment power consumption and processing, the User Equipment measurement logging should as
much as possible rely on the measurements that are available in the User Equipment according to radio resource management enforced by the access network.
The availability of location information is subject to User Equipment capability and/or User Equipment implementation. Solutions requiring location information shall take into account power consumption of the User
Equipment due to the need to run its positioning components.
In TraceViewer you can use MDT in a LTE profiles (there you can define type of measurements you want to take) and assigned it to a LTE trace. For more information on how to create such a profile, see Creating
a LTE profile in TraceViewer Help document.
Since RU50EP1, it is also possible to use MDT in WCDMA. It is possible to define proper periodical measurement parameter on RNC side to get RRC:MeasruementReport in requested time interval. Based on an
operator configuration, the RNC activates measurements like CPICH EcNo, CPICH RSCP, UE TX-power in the UE. These are the classic measured items used also for RRM purposes, so coordination between
RRM and MDT is needed and it sets some restrictions. The UE reports data to RNC in RRC Measurement Reports. Also, GPS and Rx-Tx time difference Type 1 are used also for other purposes, so coordination
between RRM and MDT is needed and it sets some restrictions.
Periodical Measurement management in TraceViewer application
Periodic measurement feature allows you to set proper parameter on eNodeB network element to gather periodical intra-frequency UE measurement for post-processing in O&M. User Equipments that are
connected to the network are requested to periodically report the measurement of serving cell signal as well as to report intra-frequency neighbour cells. If parameters are correctly set on network element, then
eNodeB stores temporarily the UE measurement and forwards them to O&M server when is requested to do that.
You can use this reports to investigate issues related to coverage and quality of a radio network without involving field drive tests. You can also use this data for better resolving the subscriber's complaints or to
ease drive tests when the traced equipment is actually used for testing.
In TraceViewer application periodical measurement can be set during LTE trace activation. In New Trace window you can enable Periodical Measurement option and set proper interval and amount of
measurement. For more information on how to set periodical measurement see Creating a Cell Trace chapter in TraceViewer Help document.
In TraceViewer application you can also disable periodical measurement on particular cell(s). In Periodical Measurement Settings window you can find all cells on which periodical measurement is enabled. To see
how deactivate periodical measurement on desired cell, see Disabling Periodical Measurement settings chapter in TraceViewer Help document.
State synchronization
This functionality allows synchronizing states between trace state and NE state. State synchronization queries every day every active LTE trace and checks whether their states are the same. If such a trace is not
in operational state than such a trace changes into Inactive . Every state synchronization procedure can be observed in Trace History tab.
Synchronization after activation checks states on network element and on trace. State synchronization performed on a GSM and WCDMA network elements is conducted by GET operation. This functionality
allows you to ask network element about it real state. Then network element returns feedback about all active traces on it. Furthermore, TraceViewer compares states on network elements and states of a trace
and sets proper state.
If you activating traces on LTE network elements it looks completely different. While activating a trace on an eNodeB, a mtrace manage object is reserved (you can see this MO in CM Editor application). When
trace is properly allocated, previously reserved mtrace manage object changes from non-operational state into operational state. You can recognize it by checking if mtrace changed into MTRACE.
If MTRACE with proper FQDN is in operational state in CM application, the trace state in TraceViewer should be change to Active . If such a trace is not in operational state, then such a state should be changed
Introduction to TraceViewer https://na1waslb.netact.personal.corp/Infocenter/topic/tracing_overview/t...
5 of 14 17/05/2016 04:48 PM
6. into Activation error state.
What is more, synchronization also checks state of a trace after deactivation procedure. If proper MTRACE is not in operational state, then state of a trace is changed into Inactive . If proper MTRACE is in
operational state in CM application, then state of such a trace is changed into Active . If deactivation of a trace on a network element ends with Deactivation timeout or Deactivation error states,
then CM application via WebService is asked to return a state of a trace with proper FQDN.
State synchronization related to LTE concerns state synchronization only between TraceVeiwer and CM Editor application. In that case state synchronization does not check what is state of a trace on network
element. In other network elements (BSC, SGSN, HLR, MSC, RNC, mcRNC, etc) state synchronization is directly checked on it. Application sets request about trace's state and should receive feedback about it
actual state.
You cannot change state of a trace manually, you are only allowed to run state synchronization manually and then TraceViewer changes state of a trace if it is necessary. You can observed that state
synchronization can be run in three scenarios:
you can run it manually using State synchronization option. For more information on how to use state synchronization, see note in point 5 in Creating new trace in TraceViewer Help document,
State synchronization is run automatically every 24h, by default it is set to 5:00 AM local time,
when activation of a trace take too long and trace state changes into Activation time-out then trace synchronization is automatically run.
Using TraceViewer you can check status of each trace. TraceViewer gathers information about which trace is activated and on which network element and it returns proper value. It sends information to network
element and returns information about which trace is activated and in which network elements. This specified information you can see in trace logs. For more information on how to activate state synchronization,
see note in Creating LTE trace chapter in TraceViewer Help document.
Supporting network planning and optimisation by performing tracing
Tracing can also be used to analyse and test the behaviour and performance of the network for network planning and optimisation purposes. It can be used, for example, to measure the network performance as a
basis for planning configuration changes or network expansion. After configuration changes or the network expansion, tracing can be used to check how the changes have affected the quality of the network
performance.
TraceViewer can be used for different network maintenance and restoration tasks, such as:
network planning and optimisation: the need to re-plan according to call statistics;
network troubleshooting: identification of problematic network elements;
network configuration: comparison of call statistics before and after configuration changes, access point tests;
performance analysis: troubleshooting BTS sites, handover verification tests, checking adjacent cells, and so on;
system acceptance testing or field testing;
network element integration: the comparison of call statistics before and after element integration.
Cell Trace with IMSI
The feature is standardized in 3GPP as Subscriber and Equipment Trace and affects circuit and packet switched network, radio network and IMS. Cell Traffic trace is part of System Level Trace which allows
collecting and reporting the activities of subscriber or mobile equipment.
When Subscriber and Equipment Trace is activated through Management in the eNB, a functionality called Cell Traffic Trace is needed. The eNB does not have IMSI or IMEI information because this information is
not sent through S1AP protocol for security reasons. S1AP, as opposite to NAS protocol, is not protected. Cell Traffic Trace allows the eNB to ask the MME to send IMSI and IMEI to NetAct so reports coming
from the eNB can be correlated with IMSI and IMEI in NetAct.
In E-UTRAN the Management Based Trace Activation is done to one or a list of E-UTRAN cells within one eNB. After the Cell Traffic Trace has been activated in the monitored cell(s), the eNB starts a Trace
Recording Session for each new session and for each already existing session and for each S1 connection the eNB sends a S1AP Cell Traffic Trace message to the MME containing Trace Reference, Trace
Recording Session Reference, NetAct address and CGI. MME sends this information together with IMSI and IMEI(SV) to NetAct through NE3S interface.
Note:
If you want to activate a cell trace with IMSI, following conditions should be fulfilled:
In CM Editor, Activate cell trace with IMSI parameter under LNBTS manged object should be set to true ,1.
In MME, Cell traffic trace feature should be enabled via MML command: ZWOC:2,2314,1;2.
Adding support for new NE release (INES)
This chapter describes how to add new release of supported network element via INES (Instant Network Element Support) feature.
To add new release of supported NE to TraceViewer you need to obtain adaptation file which contains zipped files with appropriate entries for specific NE type and NE version.
Adaptation deployment procedure:
To deploy new release adaptation file you need to:
1. Login NetAct startpage.
2. Go to 'Administration' directory.
3. Launch 'Adaptation Manager'.
4. Push 'Deploy Adaptation'.
5. Push 'Browse' button and find adaptation file location.
6. Choose adaptation file and push 'Open' button.
7. Push 'Deploy' button below.
After deploying new NE release adaptation please wait 5 minutes until changes are being applied. After integrating of new network element to NetAct please run CM Upload and update TraceViewer topology by
pushing F12 button while any trace is being selected in main TraceViewer window. After mentioned procedures new network element release might be used in TraceViewer.
Introduction to TraceViewer https://na1waslb.netact.personal.corp/Infocenter/topic/tracing_overview/t...
6 of 14 17/05/2016 04:48 PM
7. Tracing capacity
This chapter describes maximum possible values of active trace sessions in TraceViewer application.
In TraceViewer applicaton it is recommended not to exceed following number of active trace sessions:
Only 1 active All calls trace session from Geo Server in TraceViewer,
Up to 10 abnormal call trace sessions from GeoServer,
30 active LTE cell trace sessions which collects data to TraceViewer
Note:
You can activate up to 5000 cell trace sessions when 3rd party tracing flag and TCE IP in CTRLTS points to 3rd party tool.
300 active subscriber trace sessions which collects data to TraceViewer application
Tracing management
This section presents information required for tracing management. Tracing management covers such information as licensing, assigning TraceViewer roles to user groups, setting trace activation permissions for
user groups, dividing trace reference values among clusters and enabling or restricting communication connections between clusters.
Licensing
There are following licenses for TraceViewer application:
Cell Trace for GSM - allows to activate trace on GSM network elements and see GSM reports.
Cell Trace for LTE - allows to activate a cell trace for LTE functionality and see LTE reports
Cell Tracing for WCDMA CTA - allows to activate a trace on GeoServer and see traces in NE Trace tab,
CLA and MDT trace support for LTE - allows you to use CLA request manager and change settings related to position calculation,
Subscriber Trace for EPC - allows you to activate a subscriber trace and see reports from IMS, FlexiNS,
Subscriber Trace for LTE - allows you to activate a subscriber trace,
Subscriber Tracing for GPRS Radio - allows to see GPRS reports,
Subscriber Tracing for GSM Radio - allows to see GSM reports,
Subscriber Tracing for FlexiDirect - allows to activate subscriber trace on IADA,
Subscriber Tracing for Mobile Voice - allows to see reports gathered from Core NE,
Subscriber Tracing for WCDMA - allows to activate a trace on RNC and GeoServer,
Trace based monitoring for WCDMA - allows you to see reports from GeoServer,
Tracing System - allows to launch TraceViewer application,
Unlimited number of Traces - allows you to activate unlimited number of traces within one tab.
Managing MTRACE managed object in TraceViewer and CM Editor applications
To perform tracing on a eNodeB network element you need to configure proper manged object. This operation is performed not in TraceViewer application but in CM Editor.
Before you activate LTE trace you need to create and configure CTRLTS (The Trace Control) object by using CM Editor and then provision changes to the network by using CM Operation Manager. It is important
to specify proper NetAct IP addresses and ports number in CM Editor. For more information how to create CTRLTS object see Creating new managed object in the plan in CM Editor Help document. For more
information how to provision changes to the network see Provisioning Plans in CM Operation Manager Help document. For more information on how to set up correct NetAct IP Address, see Configuring default IP
Addresses in TraceViewer chapters in Configuring Trace Data Flow document.
After creating CTRLTS object (under LNBTS object), network elements are visible in TraceViewer and ready to trace but to see and trace eNodeB, you need to check if the following preconditions are being
fulfilled:
In CM Editor, Activate cell trace parameter under LNBTS managed object should be set to true ,
In CM Editor, Activate MDT cell trace parameter under LNBTS managed object should be set to true (only if you want to activate a trace with MDT),
In CM Editor, Activate vendor specific cell trace enhancements parameter under LNBTS managed object should be set to true (only if you want to activate vendor specific cell trace
enhancements) - supported only for RL55, RL70 or newer releases,
In CM Editor, created CTRLTS managed object should be in operational state. You can create this managed object in CM Editor, for more information see To create a new managed object in the plan in CM
Editor Help document. You need to remember to enter correct NetAct IP Address in this object. To check which IP is correct, you need to run smanager.pl status command on any node and find NWI3
service. Node on which mentioned service is available defines NetAct IP Address.
Remember:
All changes you have performed in CM Editor requires provisioning changes to the network.
Note:
You should not modify Activate cell trace parameter under LNBTS and create MTRACE or LTRACE object within the same CM plan. Mentioned parameter should be already set to true before
M(L)TRACE object creation.
WARNING!:
It may occur that activation of a trace may fall due to wrong configured CTRLTS, for example IP Address may be different because OMS has changed or settings were migrated from OSS 5.x release. In that
case, you need to modify IP Address which is set under CTRLTS into correct one that points to correct NWI3 node.
If you want to change NetAct IP address under CTRLTS object, you need to delete it (by creation of a new plan) and then provision changes to the network (you need to be ensured that option: create backup plan
is enabled). Than after provisioning changes you can take backup plan ID and open it in CM Editor, than you can modify NetAct IP under that CTRLTS. After that change you need to provision changes to the
network. If you performing trace activation on other network elements than LTE elements, activation may differ.
Introduction to TraceViewer https://na1waslb.netact.personal.corp/Infocenter/topic/tracing_overview/t...
7 of 14 17/05/2016 04:48 PM
8. While activating a trace on an eNodeB, a mtrace manage object is reserved (you can see this MO in CM Editor application). When trace is properly allocated, previously reserved mtrace manage object
changes from non-operational state into operational state. You can recognize it by checking if mtrace changed into MTRACE . If MTRACE with proper FQDN is in operational state in CM application, the trace
state in TraceViewer should be change to Active . If such a trace is not in operational state, then such a state should be changed into Activation error state.
In TraceViewer application there is also a possibility to synchronize all LTE cell traces with NetAct Configurator application. It may occur that some information that are coming from NetAct Configurator do not
reach TraceViewer. In that scenario some of trace states may be not updated due to not coming JMS information. To check whether all trace states are created properly, or to check trace states, run Synchronize
LTE Traces with Configurator option in TraceViewer, for more information, see Synchronizing trace states with NetAct Configurator in TraceViewer Help document. This option sends request to Configurator to
check which traces are still active. An information about active and inactive traces is send back by JMS information. The TraceViewer checks whether traces that are in application are active or have been
deactivated. If there are not any traces created in TraceViewer and in JMS message there is an information about such a trace, than proper trace is created in TraceViewer application. It works also in different
way, if trace is active in TraceViewer and JMS message comes with information that in Configurator there is not such a trace, than trace from TraceViewer is deactivated.
Performance and resource usage
This section provides information about Tracing performance and resource usage.
Setting the trace level
When activating a trace, the trace level determines how much trace data is collected from the network elements. Selecting a lower trace level decreases the load on the system.
Trace level
Because of the potentially large amounts of trace data collected for trace, it is worth considering what kind of data is really needed for a particular trace. The trace level determines how much data is collected,
which can be set when activating a new trace.
Depending on the type of network, the following observations are available for traces activated in the following:
SGSN,
HLR,
RNC,
MSC,
Flexi Direct,
OpenTAS.
TABLE 2 Available observations for HLR trace levels in GSM and GPRS networks
detailed calls only location update no BSS
GSM/GPRS networks: GSM/GPRS networks: GSM/GPRS networks: GSM/GPRS networks:
NSSR59H
NSSR5AH
NSSR60H
NSSR61H
NSSR62H
NSSR166H
NSSR167H
GSMBSC16
GSMBSC17
GSMBSC18
GSMBSC19
GSMBSC20
GSMBSC21
GSMBSC25
GSMBSC27
GSMBSC28
GSMSGSN1
MGW_ATM
MGW_TDM
NSSR59H
NSSR60H
NSSR61H
NSSR62H
NSSR166H
NSSR167H
GSMBSC16
GSMBSC17
GSMBSC18
GSMBSC19
GSMBSC20
GSMBSC21
GSMBSC25
GSMBSC27
GSMBSC28
GSMSGSN1
MGW_ATM
MGW_TDM
NSSR59H
NSSR5AH
NSSR166H
NSSR167H
GSMBSC16
GSMBSC17
GSMBSC18
GSMBSC19
GSMBSC20
GSMBSC21
GSMBSC25
GSMBSC27
GSMBSC28
GSMSGSN1
MGW_ATM
MGW_TDM
NSSR59H
NSSR5AH
NSSR60H
NSSR61H
NSSR62H
NSSR166H
NSSR167H
GSMSGSN1
MGW_ATM
MGW_TDM
TABLE 3 Available observations for HLR trace levels in WCDMA networks
detailed calls only location update no BSS
NSSR59H
NSSR5AH
NSSR60H
NSSR61H
NSSR62H
NSSR166H
NSSR167H
RAN_SignConnection
RAN_CapTracedUE
RAN_TrafficVol
RAN_RAB
RAN_RadioBearer
RAN_DedTransCh
RAN_ActSetCell
RAN_CellUpdate
RAN_ULPerformance
RAN_BTSTransPwr
RAN_UETransPwr
RAN_UERedirection
RAN_UERxTxTimeDiff
RAN_URAUpdate
RAN_IntraFreqMea
RAN_IntraFreqMeaCtrl
RAN_InterFreqMea
NSSR59H
NSSR60H
NSSR61H
NSSR62H
NSSR166H
NSSR167H
RAN_SignConnection
RAN_CapTracedUE
RAN_TrafficVol
RAN_RAB
RAN_RadioBearer
RAN_DedTransCh
RAN_ActSetCell
RAN_CellUpdate
RAN_URAUpdate
MGW_ATM
MGW_TDM
MGW_IP
NSSR59H
NSSR5AH
NSSR166H
NSSR167H
RAN_SignConnection
RAN_CapTracedUE
RAN_TrafficVol
RAN_RAB
RAN_RadioBearer
RAN_DedTransCh
RAN_ActSetCell
RAN_CellUpdate
RAN_URAUpdate
MGW_ATM
MGW_TDM
MGW_IP
NSSR59H
NSSR5AH
NSSR60H
NSSR61H
NSSR62H
NSSR166H
NSSR167H
MGW_ATM
MGW_TDM
MGW_IP
Introduction to TraceViewer https://na1waslb.netact.personal.corp/Infocenter/topic/tracing_overview/t...
8 of 14 17/05/2016 04:48 PM
9. detailed calls only location update no BSS
RAN_InterFreqMeaCtrl
RAN_InterSystMea
RAN_InterSystMeaCtrl
RAN_DLAmRLC
RAN_DLPerf
MGW_ATM
MGW_TDM
MGW_IP
Note:
Since NetAct8 EP2 release there are two additional Trace Level types for RNC RU50 EP1:
detailed + MDT (minimization of drive tests without GPS support)
detailed + MDT + GPS (minimization of drive tests with GPS support)
The results of MDT measurements collection will be available in the RNC message monitoring captured by Megamon/TV for the user for which the trace is activated e.g. RRCMeasurementReport,
NBAPDedicateMeasurementReport, NBAPDedicateMeasurementInitiationResponse or GeoServer Ticket.
TABLE 4 Available observations for MSC trace levels in GSM networks
detailed calls only location update no BSS
NSSR5AH
NSSR60H
NSSR61H
NSSR62H
NSSR166H
NSSR167H
GSMBSC16
GSMBSC17
GSMBSC18
GSMBSC19
GSMBSC20
GSMBSC21
MGW_ATM
MGW_TDM
NSSR60H
NSSR61H
NSSR62H
NSSR166H
NSSR167H
GSMBSC16
GSMBSC17
GSMBSC18
GSMBSC19
GSMBSC20
GSMBSC21
MGW_ATM
MGW_TDM
NSSR5AH
NSSR166H
NSSR167H
GSMBSC16
GSMBSC17
GSMBSC18
GSMBSC19
GSMBSC20
GSMBSC21
MGW_ATM
MGW_TDM
NSSR5AH
NSSR60H
NSSR61H
NSSR62H
NSSR166H
NSSR167H
MGW_ATM
MGW_TDM
TABLE 5 Available observations for MSC trace levels in WCDMA networks
detailed calls only location update no BSS
NSSR5AH
NSSR60H
NSSR61H
NSSR62H
NSSR166H
NSSR167H
RAN_SignConnection
RAN_CapTracedUE
RAN_RAB
RAN_RadioBearer
RAN_DedTransCh
RAN_ActSetCell
RAN_ULPerformance
RAN_BTSTransPwr
RAN_UETransPwr
RAN_UERxTxTimeDiff
RAN_IntraFreqMea
RAN_IntraFreqMeaCtrl
RAN_InterFreqMea
RAN_InterFreqMeaCtrl
RAN_InterSystMea
RAN_InterSystMeaCtrl
RAN_DLAmRLC
RAN_DLPerf
MGW_ATM
MGW_TDM
MGW_IP
NSSR60H
NSSR61H
NSSR62H
NSSR166H
NSSR167H
RAN_SignConnection
RAN_CapTracedUE
RAN_RAB
RAN_RadioBearer
RAN_DedTransCh
RAN_ActSetCell
MGW_ATM
MGW_TDM
MGW_IP
NSSR5AH
NSSR166H
NSSR167H
RAN_SignConnection
RAN_CapTracedUE
RAN_RAB
RAN_RadioBearer
RAN_DedTransCh
RAN_ActSetCell
MGW_ATM
MGW_TDM
MGW_IP
NSSR5AH
NSSR60H
NSSR61H
NSSR62H
NSSR166H
NSSR167H
MGW_ATM
MGW_TDM
MGW_IP
TABLE 6 Available observations for GSM SGSN trace levels in GPRS
networks
detailed calls only location update no BSS
GSMSGSN1
GSMBSC25
GSMBSC27
GSMBSC28
GSMSGSN1
GSMBSC25
GSMBSC27
GSMBSC28
GSMSGSN1
GSMBSC25
GSMBSC27
GSMBSC28
GSMSGSN1
TABLE 7 Available observations for WCDMA SGSN trace levels in WCDMA networks
detailed calls only location update no BSS
3GSGSN 3GSGSN 3GSGSN 3GSGSN
Introduction to TraceViewer https://na1waslb.netact.personal.corp/Infocenter/topic/tracing_overview/t...
9 of 14 17/05/2016 04:48 PM
10. detailed calls only location update no BSS
RAN_SignConnection
RAN_CapTracedUE
RAN_TrafficVol
RAN_RAB
RAN_RadioBearer
RAN_DedTransCh
RAN_ActSetCell
RAN_CellUpdate
RAN_ULPerformance
RAN_BTSTransPwr
RAN_UETransPwr
RAN_UERedirection
RAN_UERxTxTimeDiff
RAN_URAUpdate
RAN_IntraFreqMea
RAN_IntraFreqMeaCtrl
RAN_InterFreqMea
RAN_InterFreqMeaCtrl
RAN_InterSystMea
RAN_InterSystMeaCtrl
RAN_DLAmRLC
RAN_DLPerf
RAN_SignConnection
RAN_CapTracedUE
RAN_TrafficVol
RAN_RAB
RAN_RadioBearer
RAN_DedTransCh
RAN_ActSetCell
RAN_CellUpdate
RAN_ULPerformance
RAN_BTSTransPwr
RAN_UETransPwr
RAN_UERxTxTimeDiff
RAN_URAUpdate
RAN_SignConnection
RAN_CapTracedUE
RAN_TrafficVol
RAN_RAB
RAN_RadioBearer
RAN_DedTransCh
RAN_ActSetCell
RAN_CellUpdate
RAN_URAUpdate
TABLE 8 Available observations for RNC trace levels in WCDMA networks
detailed calls only location update no BSS
RAN_SignConnection
RAN_CapTracedUE
RAN_TrafficVol
RAN_RAB
RAN_RadioBearer
RAN_DedTransCh
RAN_ActSetCell
RAN_CellUpdate
RAN_ULPerformance
RAN_BTSTransPwr
RAN_UETransPwr
RAN_UERxTxTimeDiff
RAN_IntraFreqMea
RAN_IntraFreqMeaCtrl
RAN_InterFreqMea
RAN_InterFreqMeaCtrl
RAN_InterSystMea
RAN_InterSystMeaCtrl
RAN_DLAmRLC
RAN_DLPerf
RAN_SignConnection
RAN_CapTracedUE
RAN_TrafficVol
RAN_RAB
RAN_RadioBearer
RAN_DedTransCh
RAN_ActSetCell
RAN_CellUpdate
RAN_ULPerformance
RAN_BTSTransPwr
RAN_UETransPwr
RAN_UERxTxTimeDiff
RAN_SignConnection
RAN_CapTracedUE
RAN_TrafficVol
RAN_RAB
RAN_RadioBearer
RAN_DedTransCh
RAN_ActSetCell
RAN_CellUpdate
-
TABLE 9 Available observations for Flexi Direct trace levels in networks
detailed calls only location update no BSS
RAN_SignConnection
RAN_CapTracedUE
RAN_TrafficVol
RAN_RAB
RAN_RadioBearer
RAN_DedTransCh
RAN_ActSetCell
RAN_CellUpdate
RAN_ULPerformance
RAN_UETransPwr
RAN_UERxTxTimeDiff
RAN_IntraFreqMea
RAN_IntraFreqMeaCtrl
RAN_InterFreqMea
RAN_InterFreqMeaCtrl
RAN_InterSystMea
RAN_InterSystMeaCtrl
RAN_DLAmRLC
RAN_URAUpdate
RAN_UERedirection
RAN_SignConnection
RAN_CapTracedUE
RAN_TrafficVol
RAN_RAB
RAN_RadioBearer
RAN_DedTransCh
RAN_ActSetCell
RAN_CellUpdate
RAN_ULPerformance
RAN_UETransPwr
RAN_UERxTxTimeDiff
RAN_URAUpdate
RAN_SignConnection
RAN_CapTracedUE
RAN_TrafficVol
RAN_RAB
RAN_RadioBearer
RAN_DedTransCh
RAN_ActSetCell
RAN_CellUpdate
RAN_URAUpdate
-
Roles and permissions in LTE activation profiles
During activating LTE profiles you can have different roles and permissions depending on role you have. In the following table you can find all information related to user rights:
TABLE 10 User rights in activating LTE profiles.
User Rights: Trace Admin Trace User Trace User Trace Reader
Privileges: All Owner Not owner Not owner
Introduction to TraceViewer https://na1waslb.netact.personal.corp/Infocenter/topic/tracing_overview/t...
10 of 14 17/05/2016 04:48 PM
11. User Rights: Trace Admin Trace User Trace User Trace Reader
View activation profile list: Yes Yes Yes Reader cannot open the
window.
New LTE activation profile: Yes Yes Yes No
Edit LTE activation profile: Yes Yes, you will see Update
button, when Profile name is
filled.
Yes, all changes can be stored
only under new name, Update
button not active.
No
Delete LTE activation profile: Yes Yes (owner) No No
For more information about creating new LTE activation profiles, see Creating LTE activation profiles in TraceViewer Help document.
To get more information about editing LTE profiles, see Editing LTE activation profiles in TraceViewer Help document.
Supported network elements
The following table lists the latest network elements releases supported in TraceViewer:
TABLE 11 Supported network elements by TraceViwer application.
Network element Release
RNC
RN6.0 (RU30),
RN6.0 1.0 (RU30 EP1),
RN6.0 2.0 (RU30 EP2),
RN7.0 (RU40),
RN8.0 (RU50),
RN8.1 (RU50 EP1),
mcRNC
mcRNC2.0 (RU30 EP2),
mcRNC3.0 (RU40),
mcRNC3.1 (RU50),
mcRNC4.1 (RU50 EP1),
BSC
SR20 (RGR20) - unable to activate Cell Trace,
SR40 (RGR40) - Cell Trace support,
S15 (RG20) - unable to activate Cell Trace,
S15 EP1.1 (RG20 EP1) - unable to activate Cell Trace,
S15 EP2.1 (RG20 EP2) - unable to activate Cell Trace,
S16 (RG30) - unable to activate Cell Trace,
S16.11 (RG30 EP1) - unable to activate Cell Trace,
S16.12 (RG30 EP1) - Cell Trace support,
S16.13 (RG30 EP1) - Cell Trace support,
S16_2 (RG40 EP1) - Cell Trace support,
SGSN
SG8.0 DX CD2,
SG8.0DX CD3,
SG8.0 DX CD3.1,
SG9.1 (DX),
SG9.2 (DX),
SG8.0 (ATCA),
SG8.0 ATCA CD2,
SG8.0 ATCA CD3,
SG8.0 ATCA CD4,
MSC/HLR/MSS
M15.0,
M15.1,
Md16.1 (DX200),
Md16.1 EP1 (DX200),
Md16.2 (DX200),
M16.0 M16.0 EP1,
Ma16.1 (ATCA),
Introduction to TraceViewer https://na1waslb.netact.personal.corp/Infocenter/topic/tracing_overview/t...
11 of 14 17/05/2016 04:48 PM
13. Network element Release
15.5VI
HSSFE
11.0
15.5
15.5VI
TAC list
TAC (Type Allocation Code) list allows to identify a particular model UE’s device. That list is stored in TraceViewer database. TAC list is installed with a system and is updated every two weeks. You can import
your own list which overwrites existing one.
Based on extracted IMEI number it’s possible to recognize manufacturer and handset type. To do that a TAC part from IMEI is compared with TAC list provided with a system. Additional information concerning
structure of IMEI and IMEISV numbers:
IMEI consists of 15 digits where:
8 = TAC - Type Allocation Code (6 TAC+2FAC – Final Assembly Code – company name e.g. 10,20= Nokia)
6 = SNR - Serial Number Code
1 = redundant, check digit
IMEISV consists of 16 digits where:
8 = TAC - Type Allocation Code (6 TAC+2FAC – Final Assembly Code – company name e.g. 10,20= Nokia)
6 = SNR - Serial Number Code
2 = SVN - Software Version Number
Manufacturer, Handset type and SW version columns are displayed in Trace Analysis window for WCDMA and LTE calls based on IMEI number and provided TAC list.
User management
In the TraceViewer application there are defined the following roles:
TraceAdmin,
TraceUser,
TraceReader.
User roles are installed with application. In a table below you can find detailed information about exact user role and their permissions:
TABLE 12 Security management of a TraceViewer application.
Functions: Trace Admin Trace User Trace Reader
Activation of a trace Yes Yes No
Deactivation of a trace Yes Yes No
Trace restart Yes Yes No
Deletion of a trace Yes No No
Copy of a trace Yes Yes No
List trace Yes Yes Yes
View a trace Yes Yes Yes
View options Yes Yes Yes
Edit security options Yes No No
Edit general options Yes Only CLA No
Edit network settings Yes No No
Managing templates Yes Yes Yes
In the table you can find whole functions that are available in TraceViewer application. Functions that are marked as Yes, are available for current user. In Editing general options TraceUser has only right to edit
CLA (Call Location Analysis) settings. For more information about CLA Functionality, see Call trace analyzer chapter in Tracing subscribers and Equipment document.
Data deletion in TraceViewer
In TraceViewer application you can manage trace and trace data that has been received. The amount of data can be so huge that it might overload the DB, in that case deletion operation was introduced due to
decrease amount of data in DB. You can specify in TraceViewer options how many days proper data is stored, how to do that see Modifying options for the current user chapter in TraceViewer Help document.
However, there are some limitation, you cannot set number of days to infinity, cause this might disturb functionality of a TraceViewer or NetAct system or overload data base.
You can modify setting in the following way:
in Subscriber trace data you can set deletion to the fallowing values:
Number of days to keep traces: default value is 14 days, range is between 0 - 28,
Number of days to keep events or calls: default value is set to 14 days, range is between 0 - 28,
Introduction to TraceViewer https://na1waslb.netact.personal.corp/Infocenter/topic/tracing_overview/t...
13 of 14 17/05/2016 04:48 PM