Download to read offline

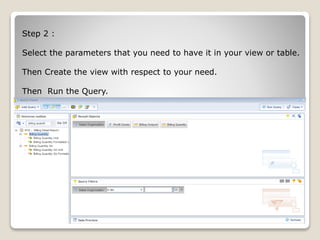
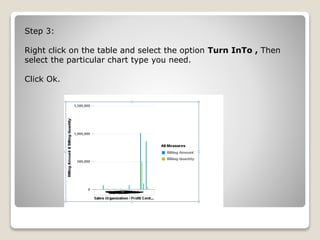

To create a chart from a table or view in SAP Webi, first open a new document and connect to a data source to retrieve data. Select the necessary parameters to build the view or table, create it, and run the query. Then right click the table, select "Turn Into", choose a chart type, and click OK to generate the chart with respect to the underlying table or view.


![제 23회 보아즈(BOAZ) 빅데이터 컨퍼런스 - [MBOAX] : ABSA를 활용한 소비자 반응 분석 기반 운영 효율화 대시보드 설계](https://cdn.slidesharecdn.com/ss_thumbnails/3-1boaz23rdconferencemboax-260203102709-9d519923-thumbnail.jpg?width=640&height=640&fit=bounds)


