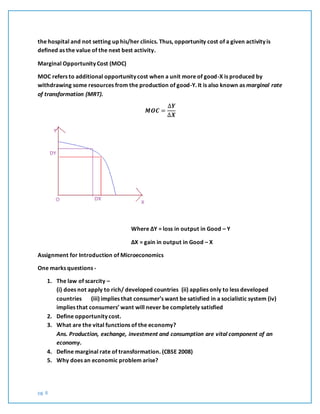
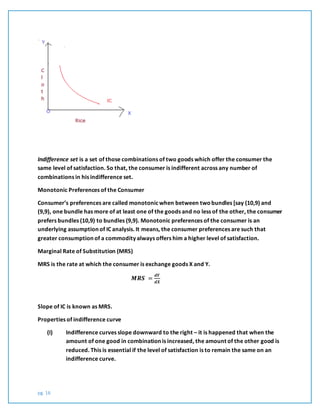
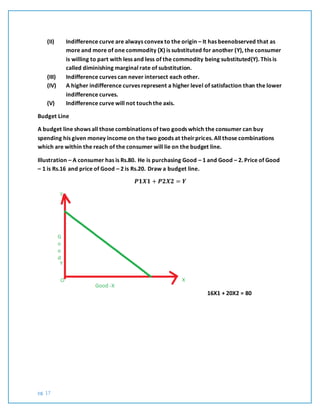
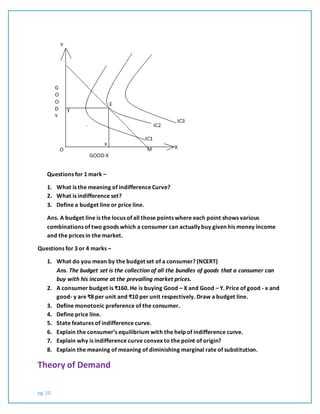
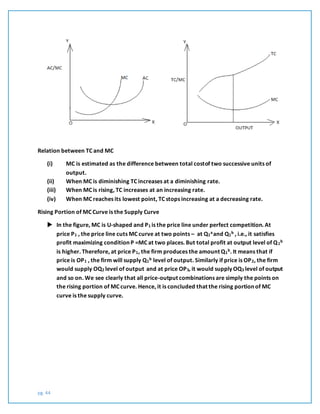
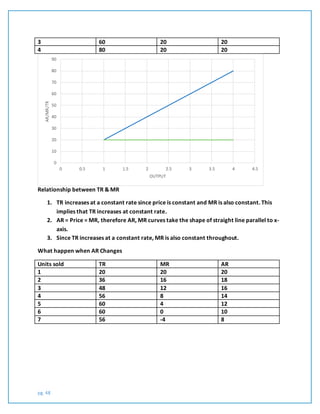
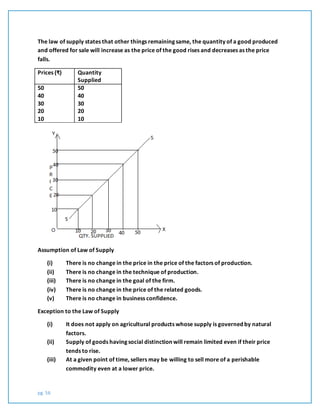
SlideShare a Scribd company logo
RAJA RAM SHARMA
PGT ECONOMICS
SURAJKUND INTERNATIONAL SCHOOL
DAYAL BAGH, FARIDABAD, HARYANA
INTRODUCTORY MICROECONOMICS
pg. 1
Introduction to Micro Economics
What is Economics about?
Take an example, Ram has Rs.1000. He is free to spend to spend the money as he like. What
will he do? He has many options before him,
(i) He can purchase a dress for him.
(ii) He may go to watch a movie and eat in a restaurant.
(iii) He can give tuition fees for his children.
What do you notice about this above example? He has many options before him. He is not
enough money to fulfil his all wants. This arises due to means are limited and human wants
are unlimited. The two main facts for this โ€“
a. Human beings have unlimited wants, and
b. The means of satisfying these wants are relatively scarce,
Term economics is derived from Greek wordOikonomia meaning household.
Definitions of Economics
There are four main definition of Economics which are as follows:
A. Science of wealth โ€“ The classical economist defined economics in terms of the science
of wealth. Adam Smith is known as father of Modern Economics published his book
entitled โ€œ An Enquiry intothe Nature and Causes of Wealth of Nationโ€ in in 1776.โ€œ
Science which deals with wealthโ€. โ€“ J.B. Say.
pg. 2
B. Science of material well-beingโ€“ Alfred Marshall was in favor of welfare of human
beings. According to him,โ€ Economics is the study of mankind in the ordinary business
of life. It examines that part of individual and social action which is most closely
connected with the attainment and with the use of the material requisites of well
beings.
C. Science of choice making โ€“ Lionel Robbins of the London School of Economics gave a
new definition to Economics in his famous bookโ€ nature and significance of
Economicsโ€ in 1931. According to him,โ€™โ€ Economics is the science which studies human
behavior as a relationship between ends and scarce means which have alternative
usesโ€.
D. Science of dynamic growth and developmentโ€“ Innovative and scientific definition was
given by Paul Anderson Samuelson. According to him,โ€ Economics is the study of men
and society choose, with or without the use of money, to employ scarce productive
resources which could have alternative uses, to produce various commodities over
time and distribute them for consumption now and in the future amongst various
people and groups of societyโ€.
Microeconomics and Macroeconomics
The subject matter of economics has been divided into twoparts โ€“ microeconomics and
macroeconomics. In Microeconomics we study the economic behavior of an individual units
like firm. It is basically concerned with the mechanism of allocation of resources. It is show
partial equilibrium analysis as it seeks to determine price and output in an industry
independent of those in other industries. Following are studied under this branch-
(a) Product pricing (Theory of Demand and Theory of Production & Cost)
(b) Consumer behavior
(c) Factor pricing (Theory of Distribution)
(d) Economic conditions of a section of the people
(e) Study of firms and location of a industry
The term Macroeconomics derived from Greek wordMakros which means large. In
macroeconomics we study the economic behavior of the large aggregates such as the overall
economic conditions of the economy such as total production, totalconsumption
etc.Following are come under macroeconomics-
(a) National income and output
(b) General price level
(c) Balance of trade and payments
(d) External value of money
(e) Savings and investment; and
pg. 3
(f) Employment and economicgrowth
Economy and its Central Problems
Economy refers to the nature and level of economic activities in an area, which may be a
village, a city, a country as a whole. Economic activities include production, consumption,
investment and exchange.
There are three types of the economy which are as follows-
A. Capitalist Economy โ€“ Capitalism is an economic system in which all the means of
production are owned and controlled by private individuals for making profits. In
brief, private property is the mainstay of capitalism and main motive to earn
maximum profits. Price is determined with the free interplay of forces of demand and
supply.
There are many features of capitalism:
(i) The right of private property
(ii) Freedom of enterprise
(iii) Freedom to choice by the consumers
(iv) Profit maximization
(v) Competition among firms
(vi) Inequalities of income
B. Socialist Economy โ€“ The material means of production i.e. factories, capital, mines etc.
are owned by the whole community represented by the state is known as socialist
economy or centrally planned economy. Its main objective to attain maximum welfare
for the whole society.
(i) There is collective ownership of all means of production except small farms,
workshops and trading firms which may remain in private hands.
(ii) There is a central authority to set and accomplish socio-economicgoals.
(iii) Freedom from hunger is guaranteed.
(iv) A relative equality is an important feature.
(v) Price mechanism exists in a socialist economy.
C. Mixed Economy โ€“ In a mixed economy, the aim is to develop a system which tries to
include the best features of both the controlled economy and the market economy
while excluding the demerits of both.
Features of the mixed economy:
(i) Private sector
(ii) Public sector
pg. 4
(iii) Combined sector
Market Economy Planned Economy Mixed Economy
There is a market
mechanism that connects
buyers and sellers.
There is a lack of market
mechanism
Market mechanism
operates that connects
buyers and sellers but
checks and balances by the
government.
The main objective of this
economy is to earn
maximum profit.
The main objective of this
economy is to social
welfare.
One way to get profit and
other way to provide social
welfare.
Means of resources are
owned and controlled by
individual.
Means of production are
owned by govt. or govt.
agency.
There are co-existence of
public and private sectors
on allocation of resources.
Consumer are sovereign by
in sense of taste and
preference of consumer.
There is no consumer
sovereignty in this type of
economy.
There is some extent of
consumer sovereignty.
Central problems of an Economy
Resources are scarce, every economy faces the problems of choice. It is the problem related
to the allocation of resources to alternative uses, is called the prob;ems of resource
allocation. There are four basic problems:
What to produce?
Every society has to decide which goods and services are to be produced and in what
quantities. Food or cloth? Much food and less cloth or vice versa? Wheat or sugarcane? More
butter or more tanks? In case of more tanks, some resources will have to be diverted from
butter, but the economy cannot have more tanks and more butters with available resources
at the same time. Similarly, society has to decide between consumer goods and producer
goods, between necessary goods and luxury goods. Since resources are limited, all goods and
services desired cannot be produced. So the society has to decide which goods to be
produced and the quantities in which selected commodities are to be produced.
How to produce?
pg. 5
There are various alternative techniques of producing a good. For example sugar is produced
with either employing more labour or machine. As we know that resources are scarce, a
decision has to be taken about which technique should be used. The guiding principle is to
adopt those techniques which involve least possible cost to produce per unit of commodity.
For whom to produce?
This problem relates to the problem of distribution of goods and services among the society.
As we know that the society cannot satisfy all wants of all the people. Therefore, it has to
decide who should get how much of the total output of goods and services. Another aspect of
this problem is how should output of the economy be distributed among different persons
and families so that all persons get minimum level of consumption. This problem of
distribution arises due to output produced in the economy is limited while wants of the
people are unlimited.
What provisions are to be made for the economic growth?
A society would not like to use all its scarce resources for current consumption only. This is
because if it uses all the resources for current consumption and no provision is made for
future production, the societyโ€™s production capacity would not increase.
Production Possibility Curve(PPC)
A production possibility is a curve which shows various combination of two goods which are
producing in an economy with the given level of resources and technology. Thus PPC is a
curve that shows the different rates of production of two goods that an individual or group
can efficiently produce with given resources and state of technology.
Assumption of PPC
(a) Two goods are taken
(b) A given amount of productive resources
(c) Resources are neither unemployed nor underemployed
(d) Technology remains same
Table No. 1. For PPC
Production
Possibilities
Wheat
(kg)
Cloth
(meter)
Opportunity
Cost
A 15 0 -
B 14 1 1
C 12 2 2
D 9 3 3
E 5 4 4
pg. 6
F 0 5 5
Shifting/ Rotation of Production Possibility Curve
1. Change in resources โ€“ Due to change in resources, PPC shift right ward or leftward. If
resources are increased in the economy, production of both goods are increased or
decreased in resources means less of both goods in the economy.
2. Change in technology โ€“ Improved technology used in production of good โ€“ Y, more of
good โ€“ Y is to be produced in the economy.
pg. 7
(a) Efficient technology used in production of good โ€“ Y , we get more of good โ€“Y which
is shown in figure 1A.
(b) Efficient technology used in production of good โ€“ X, we get more of good โ€“ X,
which is shown in figure 1B.
(c) Efficient technology used in production of both goods โ€“ X and Y, we get both goods
more which is shown in figure 1C.
Properties of Production Possibility Curve
Production possibility curve has two basic properties-
(i) Production possibility curve slopes downward โ€“ PPC is downward sloping because
more of one good can be obtained only by giving the production of another good
given the resources of the economy. Increasing the production of one good,
sacrificing other good.
(ii) Production possibility curve is concave to the point of origin โ€“ Increasing MRT
implies that for producing an additional unit of a good, sacrifice of units of other
goods goes on increasing. MRT increases because it is assumed that no resource is
equally efficient in production of all goods. So it becomes difficult tosubstitute
resources specialized in one good to production of othergood. As the increasing
MRT, shape of PPC concave to the origin.
Opportunity Cost
Suppose a student completing his medical degree, he/she has two option open to him. One
to join a hospital which gives him/her Rs.15 lakh annum and second to start his/her clinics
and earn Rs.12 lakh annum. Now if he/she join the hospital, he/she earn Rs.15 lakh annum
but he/she will not get Rs.12 lakh. This Rs.12 lakh is his/her opportunity cost for serving in
pg. 8
the hospital and not setting up his/her clinics. Thus, opportunity cost of a given activity is
defined as the value of the next best activity.
Marginal Opportunity Cost (MOC)
MOC refers to additional opportunity cost when a unit more of good-X is produced by
withdrawing some resources from the production of good-Y. It is also known as marginal rate
of transformation (MRT).
๐‘ด๐‘ถ๐‘ช =
โˆ†๐’€
โˆ†๐‘ฟ
Where โˆ†Y = loss in output in Good โ€“ Y
โˆ†X = gain in output in Good โ€“ X
Assignment for Introduction of Microeconomics
One marks questions -
1. The law of scarcity โ€“
(i) does not apply to rich/ developed countries (ii) applies only to less developed
countries (iii) implies that consumerโ€™s want be satisfied in a socialistic system (iv)
implies that consumersโ€™ want will never be completely satisfied
2. Define opportunity cost.
3. What are the vital functions of the economy?
Ans. Production, exchange, investment and consumption are vital component of an
economy.
4. Define marginal rate of transformation. (CBSE 2008)
5. Why does an economic problem arise?
pg. 9
Ans. Scarcity of resources having alternative uses in relation to unlimited wants give s
rise to economic problem.
6. Give two examples of microeconomic study.(CBSE 2011)
7. What is the meaning of economics?
3 or 4 marks questions โ€“
1. Production in an economy is below its potential due to unemployment. Government
starts income generation schemes. Explain its effect using production possibilities
schedules. (CBSE 2013)
2. State factors which cause rightward shift of PPC. (CBSE 2007)
3. Why is a PPC concave to the point of origin? (CBSE 2014)
4. Explain central problem โ€˜what to produceโ€™.
5. Explain central problem โ€˜for whom to produceโ€™.
6. What does increasing MOC along a PPC mean?
7. Explain how scarcity and choice go together.
8. Give two examples of underutilizations of resources.
9. Differentiate between centrally planned economy and market economy.
10. Differentiate between microeconomics and macroeconomics.
11. Find Marginal Rate of Transformation from the following table-
Good โ€“ X 0 1 2 3 4 5
Good โ€“ Y 20 19 17 14 10 0
12. Explain PPC with help of schedule and diagram.
13. Which technique of production โ€“ labourintensive technique or capital intensive โ€“
should be adopted when Indian economy is labourabundance and capital scarcity
economy? (value based)
14. As water resources are limited in our economy, suggest two measures of economizing
water resources so that it would not become a future problem for us. (value based)
15. An economy always produces on, but not inside a PPC. Defend or refute. (NCERT)
pg. 10
Consumerโ€™sEquilibrium โ€“ Utility Analysis
Utility
In economics, the term utility refers to the quantity of a commodity tosatisfy human wants.
In other words, want satisfying power of a commodity termed as utility. The good has quality
to satisfy human desires by consuming of it.
Total Utility โ€“ Sum total of utility derived from the consumption of all the units of a
commodity is called total utility (TU).
๐‘ป๐‘ผ = โˆ‘๐‘ด๐‘ผ
Marginal Utility โ€“ An additional utility derived from consumption of one extra unit of a
commodity is called marginal utility (MU).
๐‘ด๐‘ผ๐’ = ๐‘ป๐‘ผ๐’ โ€“ ๐‘ป๐‘ผ๐’ โˆ’1
Law of Diminishing Marginal Utility (LDMU)
One of the important law under MU analysis is the LDMU. It states that as more and more
units of a commodity are consumed, MU derived from every additional unit must decline. It
happens in all goods and services. It is, therefore called Fundamental Law of Satisfaction or
Fundamental Psychological Law.
Suppose a consumer has to consume apples. He may get utility from different units of apples
as follows
Units of
Apples
MU Graphic Presention
1
2
3
4
5
6
7
25
20
15
10
5
0
-5
pg. 11
Assumption of the LDMU
i. Only standard units of the commodity are consumed.
ii. Consumption of the commodity is continuous.
iii. There is no change in taste and preferences of the consumer.
iv. There is no change in income of the consumer.
Table No. 2 Utility Analysis
Units of
commodity
Marginal
Utility
Total
Utility
1 50 50
2 40 90
3 30 120
4 20 140
5 10 150
6 0 150
7 -10 140
Relation between TU and MU
(i) TU= โˆ‘๐‘ด๐‘ผ
(ii) TU increases so long as MU is positive.
(iii) When MU is zero, TU is maximum.
(iv) When MU is negative, TU starts diminishing.
pg. 12
(v) Decreasing MU implies that TU is increasing at a diminishing rate.
Concept of Consumerโ€™s Equilibrium
Consumerโ€™s equilibrium is a situation when a consumer spends his entire income in such a
way, he gets maximum satisfaction.
There are two situations for consumerโ€™s equilibrium:
A. One commodity case
B. Two commodities case
Consumers Equilibrium in one commodity case:
Buying of a commodity by a consumer depends on three factors:
a. Price of the commodity
b. Marginal utility of the commodity
c. Marginal utility of money
๐‘ด๐‘ผ๐’Ž =
๐‘ด๐‘ผ๐’™
๐‘ท๐’™
Units of
commodity
MUx MUm
1
2
3
4
5
6
20
18
16
10
0
-5
20/4=5
18/4=4.5
16/4=4
10/4=2.5
0/4=0
-5/4=-
1.25
pg. 13
Consumerโ€™s Equilibrium in two commodities case:
In X-commodity, A consumer strikes his equilibrium when:
๐‘ด๐‘ผ๐’Ž =
๐‘ด๐‘ผ๐’™
๐‘ท๐’™
-------- (i)
In Y-commodity, A consumer strikes his equilibrium when:
๐‘ด๐‘ผ๐’Ž =
๐‘ด๐‘ผ๐’š
๐‘ท๐’š
--------- (ii)
Relating equation (i) and (ii), we get
๐‘ด๐‘ผ๐’™
๐‘ท๐’™
=
๐‘ด๐‘ผ๐’š
๐‘ท๐’š
= ๐‘ด๐‘ผ๐’Ž
Utility Schedule in case of Two Commodities
Units of Goods MUX ๐‘ด๐‘ผ๐’Ž
=
๐‘ด๐‘ผ๐’™
๐‘ท๐’™
MUY
๐‘ด๐‘ผ๐’Ž =
๐‘ด๐‘ผ๐’š
๐‘ท๐’š
1
2
3
4
5
6
7
8
9
35
30
25
24
20
16
12
8
4
7
6
5
4.8
4
3.2
2.4
1.6
0.8
72
64
56
48
40
32
24
16
12
9
8
7
6
5
4
3
2
1.5
pg. 14
10 0 0 8 1
Suppose a consumer who has โ‚น55 with him to spend on two goods X and Y and price of goods
are โ‚น5 and โ‚น8 respectively. How will a consumer attain his equilibrium?
For obtaining maximum satisfaction from spending his given income of โ‚น55, the consumer
will buy 3 units of good X and 5 units of good Y. In this way, he will get maximum satisfaction.
๐’€ = ๐‘ท๐’™ . ๐‘ธ๐’™ + ๐‘ท๐’š. ๐‘ธ๐’š
55 = 5 X 3 + 8 X 5
Condition of Consumerโ€™s Equilibrium
i. Rupee worth of marginal utility should be equal tomarginal utility of money.
ii. Marginal utility of money remains constant.
iii. Law of diminishing marginal utility must hold good.
Questions for 1 mark โ€“
1. What do you mean by utility?(CBSE 2006)
Ans. Utility is the quality or power to satisfy human wants.
2. What is meant by marginal utility of money?
3. What is total utility?
4. State law of diminishing marginal utility.
5. What do you mean by marginal utility?
6. What is consumerโ€™s equilibrium?
Questions for 3 or 4 marks โ€“
1. A consumer consumes only two commodities x and y and is in equilibrium. Show that
when the price of x rises, consumer buys less of good x. use utility analysis. (CBSE
2014)
2. A consumer consumes only two goods X & Y. state and explain the conditions of
consumerโ€™s equilibrium with help of utility analysis.
3. Explain the relation between total utility and marginal utility.
Ans. Followings are the relations between TU and MU โ€“
(i) Both TU and MU are equal in the beginning.
(ii) When Mu is positive, TU is increasing.
(iii) When MU is zero, TU is maximum.
pg. 15
(iv) When MU is negative, TU is decreasing.
4. Define marginal utility. State the law of diminishing marginal utility.
5. State consumerโ€™s equilibrium in one commodity case.
6. When onion price hits hard, the poor man simply stops buying it. Explain of it, using
utility analysis.
Application and Value Based Questions
1. As a consumer, would you equate price of a commodity with total utility or marginal
utility? Give reason in support of your answer.
2. When onion price hits hard, the poor man simply stops buying it. Explain the
economics of it, using utility analysis.
Consumerโ€™sEquilibrium โ€“ Indifference Curve Analysis
Comparison of utility in terms higher or lower level of satisfaction refers to Ordinal concept of
utility. It differs from the Cardinal concept where utility is measured in terms like 1,2,3,4, etc.
Prof. Hicks has developed a theory of consumerโ€™s equilibrium based on ordinal concept of
utility. This theory is popularly known as Indifference Curve Analysis.
Concept of Indifference Set and Indifference Curve
Can indifference curve is a curve which represents all those combinations of goods which give
same satisfaction to the consumer.
Table No.3 Indifference Schedule
combination Rice cloth MRS
A 1 12
B 2 6 6
C 3 4 2
D 4 3 1
pg. 16
Indifference set is a set of those combinations of two goods which offer the consumer the
same level of satisfaction. So that, the consumer is indifferent across any number of
combinations in his indifference set.
Monotonic Preferences of the Consumer
Consumerโ€™s preferences are called monotonicwhen between twobundles [say (10,9) and
(9,9), one bundle has more of at least one of the goods and no less of the other, the consumer
prefers bundles (10,9) to bundles (9,9). Monotonic preferences of the consumer is an
underlying assumption of IC analysis. It means, the consumer preferences are such that
greater consumption of a commodity always offers him a higher level of satisfaction.
Marginal Rate of Substitution (MRS)
MRS is the rate at which the consumer is exchange goods X and Y.
๐‘ด๐‘น๐‘บ =
๐’…๐’€
๐’…๐‘ฟ
Slope of IC is known as MRS.
Properties of indifference curve
(I) Indifference curves slope downward to the right โ€“ it is happened that when the
amount of one good in combination is increased, the amount of the other good is
reduced. This is essential if the level of satisfaction is to remain the same on an
indifference curve.
pg. 17
(II) Indifference curve are always convex to the origin โ€“ It has beenobserved that as
more and more of one commodity (X) is substituted for another (Y), the consumer
is willing to part with less and less of the commodity being substituted(Y). This is
called diminishing marginal rate of substitution.
(III) Indifference curves can never intersect each other.
(IV) A higher indifference curves represent a higher level of satisfaction than the lower
indifference curves.
(V) Indifference curve will not touch the axis.
Budget Line
A budget line shows all those combinations of two goods which the consumer can buy
spending his given money income on the two goods at theirprices. All those combinations
which are within the reach of the consumer will lie on the budget line.
Illustration โ€“ A consumer has is Rs.80. He is purchasing Good โ€“ 1 and Good โ€“ 2. Price of Good
โ€“ 1 is Rs.16 and price of Good โ€“ 2 is Rs.20. Draw a budget line.
๐‘ท๐Ÿ๐‘ฟ๐Ÿ + ๐‘ท๐Ÿ๐‘ฟ๐Ÿ = ๐’€
16X1 + 20X2 = 80
pg. 18
A consumer can only afford to buy
combinations that fall along his
budget line, is called feasible or
attainable combinations. A
consumer cannot afford to buy
combinations that are beyond his
budget line , is called non-feasible or
non-attainable combination.
Consumerโ€™s Equilibrium
A consumer is in equilibrium when he is deriving maximum possible satisfaction from the
goods and is in no position to rearrange his purchases of goods. We assume that:
(i) The consumer has a given indifference map which shows his scale of preferences
for various combinations of two goods X and Y.
(ii) He has a fixed money income which he has to spend wholly on goods X and Y.
(iii) Prices of goods X and Y are given and are fixed for him.
(iv) All goods are homogeneous and divisible.
(v) The consumers act rationally and maximizes his satisfaction.
Conditions of Consumerโ€™s Equilibrium through Indifference Curve
(i) MRSxy =
๐’‘๐’™
๐’‘๐’š
i.e., marginal rate of substitution must be equal to ratio of prices of two
goods. Digrammatically, it means a consumer attains equilibrium at the point
where budget line is tangent to indifference curve.
(ii) MRSxymust be decreasing i.e., indifference curve should be convex to the origin.
Let two goods be x any Y. MRSxy means the number of units of Y the consumer is
willing to sacrifice for getting one extra unit of X.
๐‘ท๐’™
๐‘ท๐’š
is the ratio of prices in the
market which is equal to the ratio of units of Y required to be sacrificed for getting
one extra unit of X.
For consumerโ€™s equilibrium graphically, two basic tools โ€“ indifference map and budget line โ€“
are required. In figure, we superimpose budget line or price line M on consumerโ€™s
indifference map touching indifference curve IC2 at point E. As we know that indifference to
the right represent higher satisfaction. The aim of the consumer is to obtain the highest
combination on his indifference map and therefore he tries to go to the highest indifference
curve with his given budget line. He would be in equilibrium only on such point which is
pg. 19
common to both the budget line and the highest attainable indifference curve. Here that
point is E where budget line M is tangent to indifference curve IC2.
In the figure, E is the equilibrium point where both the conditions are fulfilled
simultaneously. Bundles on the higher indifference curve IC3 are not affordable because his
income does not permit to move above the budget line whereas bundles on the lower
indifference curve IC1 give lower satisfaction than at IC2. Hence the equilibrium choice is only
point E which is point of tengency of budget line with indifference curve IC2. At this point,
slope of indifference curve is equal to slope of budget line or MRSxy=
๐‘ท๐’™
๐‘ท๐’š
. Thus at the point E
the consumer achieves state of equilibrium. The equilibrium purchase is OX of good X and OY
of good Y on indifference curve IC2.
Why MRS must be equal to the Ratio of prices of two goods?
Let two goods be X and Y. MRSxy is the number of units of Y the consumer is willing to
sacrifice to get extra unit of X. the ratio of prices
๐‘ท๐’™
๐‘ท๐’š
which is also equal to ratio of units of Y
required to be sacrificed to get one extra unit of X. Suppose MRS is greater than ratio of
prices of two goods (MRSโ€บ
๐‘ท๐’™
๐‘ท๐’š
). Then consumer gains and increases consumption of X. but as
he gets more and more units of X, marginal utility of X goes on falling. So the consumeris
willing to sacrifice less and less of Y each time he gets one extra unit of X. As a result, MRS
falls and ultimately becomes equal to
๐‘ท๐’™
๐‘ท๐’š
. At this point, consumer is in equilibrium. Suppose
MRSxyโ€น
๐‘ท๐’™
๐‘ท๐’š
. It means the consumer is willing to sacrifice less units of Y for getting one extra
unit of X. The consumer losses and reduces consumption of good X. The process continues till
MRSxy=
๐‘ท๐’™
๐‘ท๐’š
. Hence MRS must be equal to ratio of prices of two goods, i.e.,
๐‘ท๐’™
๐‘ท๐’š
.
pg. 20
Questions for 1 mark โ€“
1. What is the meaning of indifference Curve?
2. What is indifference set?
3. Define a budget line or price line.
Ans. A budget line is the locus of all those points where each point shows various
combinations of two goods which a consumer can actually buy given his money income
and the prices in the market.
Questions for 3 or 4 marks โ€“
1. What do you mean by the budget set of a consumer? (NCERT)
Ans. The budget set is the collection of all the bundles of goods that a consumer can
buy with his income at the prevailing market prices.
2. A consumer budget is โ‚น160. He is buying Good โ€“ X and Good โ€“ Y. Price of good - x and
good- y are โ‚น8 per unit and โ‚น10 per unit respectively. Draw a budget line.
3. Define monotonic preference of the consumer.
4. Define price line.
5. State features of indifference curve.
6. Explain the consumerโ€™s equilibrium with the help of indifference curve.
7. Explain why is indifference curve convex to the point of origin?
8. Explain the meaning of meaning of diminishing marginal rate of substitution.
Theory of Demand
pg. 21
The concept of demand refers to the quantity of a good orservice that consumers are willing
and able to purchase at of various prices during a period time. In other words, demand for a
commodity refers to the desire to buy a commodity backed with sufficient purchasing power
and the willingness to spend.
Demand for a commodity is always expressed with reference to price. There is inverse
relationship between price and demand. Quantity demanded refers to specific quantity tobe
purchased against a specific price of the commodity.
Demand Schedule
Demand schedule is a tabular presentation of showing the relation between different
quantities of a commodity to be bought at different price of that commodity. There are two
types of demand schedule:
A. Individual Demand Schedule (IDS) โ€“ It refers to demand schedule of an individual
buyer in the market. It shows quantities of a commodity which an individual will
purchase at different possible prices of that commodity, at a point of time.
B. Market Demand Schedule (MDS) โ€“ It is a table showing different quantities of a
commodity that all the buyers in the market are ready to buy at different possible
prices of the commodity at a point of time. In simple words, when we add up the
various quantities demanded by the number of consumers in the market we can
obtain the market demand schedule.
Table No. โ€“ 5 Demand Schedule
Price of
Apple
A B C D
5 10 25 15 50
4 15 30 20 65
3 20 35 25 80
2 25 40 30 95
1 30 45 35 110
pg. 22
Demand Curve
Demand curve is a graphic representation of demand schedule showing how quantity
demanded of a commodity is related to its own price. There is two types of demand
curve:
a. Individual Demand Curve โ€“ It is a curve showing different quantities of a commodity
that one particular buyer is ready to buy at different possible prices of the commodity
at a point of time.
b. Market Demand Curve โ€“ It shows various quantities of a commodity that all the
buyers in the market are ready to buy at different possible prices of the commodity at
a point of time.
Determinants of Demand or Demand Function
Demand function shows the relationship between demand for a commodity and its various
determinants.
Dx = f(Px,Pr,Y,T,E,N,Yd)
Where Dx = demand for a commodity-X
Px = price of the commodity
Pr = price of related commodity
Y = income of the consumer
T = taste and preference of the consumers
pg. 23
E = expectations of consumers
N = size of population
Yd = distribution of income
(i) Price of the commodity โ€“ Other things remaining constant, with a rise in own price
of tโ†‘he commodity, its demand diminish and with a fall in price, its demand
extends. This inverse relationship between own price of the commodity and its
demand is called law of demand.
(ii) Price of related goods โ€“ There are two types of related goods
(a) Substitute goods โ€“ these are those goods which are used in place one another
like tea and coffee. Increase in price of coffee will increase in demand of tea. There
is direct or positive relation between price and quantity demanded for the
commodity. Increase in price of coffee will increase the demand of tea and vice-
versa.
Good (Tea) Substitute (coffee)
Price โ†‘ Demand โ†“ Price โ€“ no change Demand โ†‘
Price โ†“ Demand Price โ€“ no change Demand โ†“
(b) Complementary goods โ€“ These are those goods which used jointly like car and petrol.
Increase price of car will fall in demand of petrol. There is inverse relation between price and
quantity demanded in complementary goods.
Good (car) Complimentary (petrol)
Price โ†‘ Demand โ†“ Price โ€“ no change Demand โ†“
Price โ†“ Demand โ†‘ Price โ€“ no change Demand โ†‘
(iii) Income of the consumer โ€“ Change in income of the consumer also effects his
demandfor different goods. Increase in income of the consumer will increase the
demand of normal goods and decrease the demand of inferiorgoods.
(iv) Tastes and preferences โ€“ Demand for goods and services also depends on
individualโ€™s tastes and preferences. Tastes and preferences of the consumers are
influenced by advertisement, change in fashion, climate, new inventions etc.
Favourable taste and preference attracts more demand of that goods and
unfavourable taste and preference lose its demand in the market.
(v) Expectation โ€“ If the consumer expects a significant change in the availability of the
concerned commodity in the near future, he may decide to change his present
demand for the commodity.
pg. 24
(vi) Population size โ€“ Demand increases with increase in the number of buyers for a
commodity. Suppose size of population increases, demand also increases. There is
also positive relation between population and demand.
(vii) Distribution of income โ€“ It is also influenced by the distribution of income in the
society. If redistribution of income increases inequality ( rich becoming richer and
poor becoming poorer), the demand for luxury goods is expected to rise and
poorer section go for inferior goods.
Law of Demand
The law of demand is one of the most important laws of economic theory. According to law
of demand, other things being equal, if the price of a commodity falls, the quantity
demanded of it will rise and if the price of a commodity rises, its quantity demanded will
decline.
Demand Schedule
Price (โ‚น) Quantity Demanded (kg)
100 100
80 150
60 200
40 250
20 300
Assumptions of the Law of Demand
(i) Tastes and preferences of the consumers remains same.
(ii) There is no change in the income of the buyers.
(iii) Prices of the related goods do not change.
(iv) There is no change in the price of the commodity.
pg. 25
Why does Demand Curve slope Downward from left to right?
(a) Law of Diminishing Marginal Utility- According to law of diminishing marginal utility,
as a consumer uses more and more units of a commodity, marginal utility of that
commodity goes on decreasing. A consumer will try to extend his consumption to the
point where the marginal utility of the commodity is equal to the price of the
commodity. So it is only at a low price at that a consumer would like to purchase more
quantities of a commodity.
(b) Income effect โ€“ When price of a commodity falls, the purchasing powerof the
consumer increases and vice-versa. For example, a consumerโ€™s income is โ‚น150. He
buys 15 kg of potatoes at a price of โ‚น10 per kg. But now price increases to โ‚น15 per kg,
he will purchase only 10 kg of potatoes. In this sense, consumerโ€™s real income falls and
vice-versa.
(c) Substitution effect โ€“ When price of a commodity falls, it becomes relatively cheaper
than its substitutes. For example: tea and coffee are substitutes, if price of coffee falls,
it will become relatively cheaper than tea. So people, who were purchasing tea before
may now purchase coffee. This will increase the demand for coffee.
(d) Size of consumer group โ€“ When price of a commodity falls, it comes within the
purchasing power of some households, who could not afford to purchase it earlier.
Thus a fall in price increase the number of consumers and a rise in price decreases the
number of consumers.
(e) Different uses
Exceptions to the Law of Demand
Followings are the important exceptions to the law of demand
(i) Conspicuous Goods โ€“ Articles of prestige value are demanded only by the rich
people and these articles become more attractive if their prices go up. Such
articles will not conform to the usual law of demand. This was found out by Veblen
Effect or prestige goods effect.
(ii) Giffen Goods โ€“ Sir Robert Giffen, an British Economist, was surprised to find out
that as the price of bread increased, the British workers purchased more bread
and not less of it. This was something against the law of demand. Why did this
happen? Because when the price of bread went up, it caused such a large decline
in the purchasing power of the poorpeople that they were forced to cut down the
consumption of meat and othermore expensive foods. Since bread even when its
price was higher than before was still the cheapest food article, people consumed
more of it and not less when its price went up. Such goods which
exhibit direct relation between price and demand are called โ€˜Giffen Goodsโ€™.
pg. 26
(iii) Conspicuous Necessities โ€“ The demand for certain goods is affected by the
demonstration effect of the consumption pattern of a social group to which an
individual belongs. These goods, due to theirconstant usage, have become
necessities of life. For example, cooking gas, prices of television sets, refrigerators,
coolers etc.
Movements along a Demand Curve
A movement along the demand curve indicates changes in the quantity demanded
because of price changes, other factors remaining constant. Due to this movement
extension of demand and contraction of demand happens.
a. Extension of demand โ€“ It occurs when quantity demanded increases in response to a
fall in own price of the commodity.
b. Contraction of demand โ€“ It occurs when quantity demanded decreases in response to
a rise in own price of the commodity.
Shifts in Demand Curve
A shift of the demand curve indicates that there is a change in demand at each possible
price because one or more other factors, such as incomes, tastes or the price of some
other goods, have changed. In short, change in demand represents shifts of the demand
curve to right or left resulting from changes in factors such as income, tastes, prices of
other goods etc. there is two ways of shifting like increase in demand and decrease in
demand.
pg. 27
a. Increase in demand โ€“ It refers to a situation when quantity demanded of a commodity
increases, even when own price of the commodity is same.
b. Decrease in demand โ€“ It refers to a situation when quantity demanded of a
commodity decrease, even when own price of the commodity is same.
Price (โ‚น) Quantity Demanded
20 40
20 60
20 80
Causes of Change in Demand
a. When income of the consumer changes.
b. When price of substitute good change.
c. When price of the complementary good change.
d. When taste of the consumer shifts against the commodity due to change in fashion or
climate.
pg. 28
e. When availability of the commodity is expected to change in the near future.
Cross Price Effect: How Price of Related Goods affects Demand for a Commodity
Effectof change in price of related good on the demand for a commodity is called cross
price effect. We know related goods are two types โ€“ (a) substitute goods and (b)
complimentary goods
(a) Demand for a commodity in relation to price of the substitute good โ€“ Let us consider
tea and coffee as the substitute goods. If tea and coffee are substitute and price of Tea
remains constant โ€“ (a) demand curve for Tea would shift to the right if price of Coffee
increases And (b) demand curve for Tea would shift to the left if price of Coffee
decreases.
(b) Demand for a commodity in relation to price of the complimentary goods โ€“ If car and
petrol are complimentary goods and price of car remains constant โ€“ (a) demand curve
for car shift forward if price of petrol reduces and (b) demand curve for car shift
backward if price of petrol increases.
Relationship between Income and Demand
If our income rises, we generally tend to buy more of goods. More income would mean
more things like stationery, clothes or medicines. There are two types of goods โ€“ normal
goods and inferior goods.
(i) Normal goods โ€“ These are the goods the demand for which increases as income of
the buyer rises. There is positive relationship between income and demand.
(ii) Inferior goods โ€“ These are the goods the demand for which decreases as income of
buyer rises. There is negative or inverse relation between income and demand.
Impact of taste and preference of demand for a commodity
pg. 29
Favourable and Unfavourable change in Tastes and Preferences
Favourable change in taste and preferences attracts buyers to purchase more of the
commodity on the same price, while unfavourable change in taste and preferences does
not attract more purchase for the commodity.
Questions for 1 marks โ€“
1. What do you mean by demand?
2. What is market demand schedule?
3. What is meant by demand curve?
Questions for 3 or 4 Marks
1. Explain law of demand with graph and schedule.
2. Distinguish between contraction of demand and extension of demand.
3. Difference between decrease in demand and increase of demand.
4. Distinguish between normal goods and inferior goods.
5. Difference between substitute good and complimentary good.
6. Why demand curve slopes downward from left to right?
7. State the exceptional of law of demand.
8. How does change in substitute good affect the demand of the given good? Explain
with the help of an example.
9. Give one reason for a shift in demand curve.
10. Distinguish between movement along demand curve and shift in demand curve.
Movement along demand curve Shift in demand Curve
A demand curve which shows change in
demand caused by change in price alone is
called movement along demand curve.
Shift in demand curve which is caused
by factors other than price denotes
shifting of original demand curve to the
right or to the left.
pg. 30
In this, we can see extension or contraction
of demand.
In this, we can see increase or decrease
of demand.
Application and Value Based Questions
1. Explain how the demand for a good is affected by the prices of its related goods. Give
examples.
2. Certain goods are demanded even when their price is zero. Does it mean that we are
demanding even those goods which are scarce?
3. Why should diamonds be priced so high and water be priced so low even when water
is essential to sustain life while diamonds are not?
4. What is the relation between good โ€“ x and good โ€“ y, if with rise in the price of good โ€“
x, demand for good โ€“ y rises? Give an example.
5. Fall in price of a commodity always leads to expansion of its demand. Comments.
pg. 31
Price Elasticity of Demand
Till now we were concerned with the direction of the changes in prices and quantities
demanded. We learnt that increase or decrease in own price of the commodity causes
contraction or extension of demand. While discussing the concepts of contraction or
extension of demand. We do not talk degree of change in quantity of a commodity; we only
talk of the direction of change. Degree of change ( the degree of extension and contraction) in
response to change in own price of the commodity is the subject matter of elasticity of
demand.
Price Elasticity of Demand
Price elasticity of demand expresses the response of quantity demanded of a good to a
change in its price.
๐‘ท๐’“๐’Š๐’„๐’† ๐‘ฌ๐’๐’‚๐’”๐’•๐’Š๐’„๐’Š๐’•๐’š = % ๐’„๐’‰๐’‚๐’๐’ˆ๐’† ๐’Š๐’ ๐’’๐’–๐’‚๐’๐’•๐’Š๐’•๐’š ๐’…๐’†๐’Ž๐’‚๐’๐’…๐’†๐’… / % ๐’„๐’‰๐’‚๐’๐’ˆ๐’† ๐’Š๐’ ๐’‘๐’“๐’Š๐’„๐’†
๐‘ฌ๐’‘ = ๐’…๐’’/๐’…๐’‘ ๐’™ ๐’‘/๐’’
Geometric Method
It measures price elasticity of demand at different points on the demand curve. It is also
called point method of measuring elasticity of demand.
๐‘ฌ๐’‘ = ๐’๐’๐’˜๐’†๐’“ ๐’”๐’†๐’ˆ๐’Ž๐’†๐’๐’• / ๐’–๐’‘๐’‘๐’†๐’“ ๐’”๐’†๐’ˆ๐’Ž๐’†๐’๐’•
Relationship between Price Elasticity of Demand and Total Expenditure
1. If rise or fall in own price of a commodity causes no change in total expenditure on the
commodity, the elasticity of demand is unitary.
2. If a fall in own price of a commodity causes a rise in total expenditure and a rise in
price causes a fall in total expenditure on the commodity, then elasticity of demand is
greater than one.
3. If a fall in own price of a commodity causes a fall in total expenditure and a rise in
price causes a rise in total expenditure on the commodity, then elasticity of demand is
less than one.
Total Expenditure in response to a fall in price of
the good
Elasticity of Demand
Constant Unitary
Increases Greater than one
Decreases Less than one
Price (โ‚น) Demand
(kg)
Total
Expenditure(โ‚น)
Nature of
Elastic
pg. 32
10
12
12
9
120
108
Edโ€บ1
10
12
12
10
120
120
Ed=1
10
12
10
9
100
108
Edโ€น1
Degrees of Price Elasticity of Demand
1. Perfectly Elastic (Ed=โˆž) โ€“ It refers to the situation when demand is infinite at the
prevailing price.
2. Perfectly Inelastic (Ed=0) โ€“ It refers to a situation when change in price causes no
change in the quantity demanded.
3. Unitary Elastic (Ed=1)โ€“ It is a situation when change in quantity demanded in response
to change in own price of the commodity is such that total expenditure on the
commodity remains same.
๐‘ป๐’๐’•๐’‚๐’ ๐‘ฌ๐’™๐’‘๐’†๐’๐’…๐’Š๐’•๐’–๐’“๐’† = ๐‘ธ๐’–๐’‚๐’๐’•๐’Š๐’•๐’š ๐‘ฉ๐’๐’–๐’ˆ๐’‰๐’• ๐‘ฟ ๐‘ท๐’“๐’Š๐’„e
4. Greater than Unitary Elastic โ€“ Demand is greater than unitary elastic when change in
quantity demanded in response to change in price of the commodity is such that total
expenditure on the commodity increases when price decreases and total expenditure
decreases when price increases.
5. Less than Unitary Elastic โ€“ Demand is less than unitary elastic when change in quantity
demanded in response to change in price of the commodity is such that total
expenditure on the commodity decreases when price falls and totalexpenditure
increases when price rises.
Five Degrees of Elasticity of Demand
(i) Perfectly Elastic Demand (Ed = โˆž)
(ii) Perfectly Inelastic Demand (Ed = 0)
(iii) Unitary Elastic Demand (Ed =1)
(iv) More Elastic Demand (Ed >1)
(v) Less Elastic Demand (Ed <1)
pg. 33
Factors Affecting Price Elasticity of Demand
1. Nature of commodity โ€“ Necessities goods like salt, kerosene oil, matchboxes,
textbooks, seasonal vegetable, have inelastic demand. Luxurious goods like air-
conditioner, fashionable garments have elastic demand.
Luxurious Goods Necessities Goods Comfortable goods
Elastic Inelastic Moderate elastic
2. Availability of Substitutes โ€“ Demand for goods which have close substitute is more
elastic demand. Those have no substitute have inelastic demand (cigarettes and
liquor).
3. Diversity of Usesโ€“ Goods that can be put to a variety of uses have elastic demand
(milk, electricity). A commodity has only few uses, its demand will be inelastic.
Multiple use of goods More elastic
Single use Inelastic
4. Price Range โ€“ Goods which are in very range or in very low price range have inelastic
demand. But those in the middle range have elastic demand.
5. Consumerโ€™s habits โ€“ If a consumer is a habitual consumption of commodity will have
inelastic demand.
6. Time Period
pg. 34
Long time Elastic demand
Short period goods Inelastic
Questions for 1 mark โ€“
1. What is meant by price elasticity of demand?
2. When is elasticity of demand called unitary?
3. Why is perfectly elastic demand curve parallel toX-axis?
4. Give the formula of price elasticity of demand by percentage method.
5. What is meant by perfectly elastic demand?
Questions for 3 or 4 marks โ€“
1. How is price elasticity of demand effected by โ€“
(i) Number of substitute available for the goods
(ii) Nature of the good
2. Define price elasticity of demand. Explain any one method of measuring it.
Practical Exercises
1. Suppose the price of milk falls from โ‚น50 per litre to โ‚น45 per litre, what will be the
consumerโ€™s price elasticity of demand, if its demand for milk goes up from 4 litres to 6
litres.
2. Price of a goods falls from โ‚น40 to โ‚น32. As a result, its demand rises from 80 units to
100 units. Calculate price elasticity of demand by expenditure method.
3. When price of a commodity falls by โ‚น2 per unit, its quantity demanded increases by 10
units. Its price elasticity is (-)1. Calculate its quantity demanded at the price before
change which was โ‚น10 per unit.
4. A consumer buys 80 units of a good at a price of โ‚น10 per unit. Suppose price elasticity
of demand is (-)2. At what price will he buy 64 units?
Assignment
1. What do you understand by elasticity of demand?
2. Write the formula of price elasticity of demand.
3. What is meant by perfectly elastic demand?
4. Explain geometric method of measuring price elasticity of demand.
5. Give the formula to measure elasticity of demand on a straight line demand curve.
6. When price of a good rises from Rs.40 per unit to Rs.46 per unit, its demand falls by 30
percent. Calculate price elasticity of demand.
pg. 35
7. The government in India keeps raising taxes on liquor and cigarettes to rise in price of
these goods. But the fall in demand is insignificant. How do you explain this
phenomenon?
8. A consumer buys 10 units of a good at a price of Rs.6 per unit. Price elasticity of
demand is 1. At what price will he buy 12 units? Use expenditure method.
9. โ€˜Flatter the demand curve, greater the price elasticity of demand. Explain.
10. Explain factors determining price elasticity of demand.
11. Show the different degrees of elasticity of demand with help of a diagram.
Work Sheets
1. If two demand curves intersect, which one has higher price elasticity at the point of
intersection? Or
If two negatively sloped straight line demand curves cross
each other, will price elasticity of demand be equal at the point of intersection.
Explain. Ans.
We know that different demand curves have different elasticities. When two
negatively sloped demand curves intersect each other, the flatter demand curve has
higher price elasticity at the point of intersection.
2. Whatis the relationship between elasticity of demand and change in expenditure on a
good?
pg. 36
3. Draw demand curves showing price elasticity of demand equal to (i) zero (ii) infinity
and (iii) unity.
4. Why is coefficient of price elasticity of demand negative?
Ans โ€“ The coefficient of price elasticity of demand is
always negative because there is an inverse relationship between demand and price.
Production Function and Returns to a Factor
Concept of Production Function
Production is a very important economicactivity. The standard of living in the ultimate
analysis depends on the volume and variety of goods and services produced in a country. In
fact, the performance of an economy is judged by the level of production.
In simple, the term production is used for an activity of making something material. The
growing of wheat or any other agricultural crop by farmers and manufacturing of cloth, radio-
sets, or any other industrial product is often referred to as production. In Economics, by
production we mean the process by which man utilizes or converts the resources of nature,
working upon them so as to make them satisfy human wants. In other words, production is
any economic activity which is directed towards the satisfaction of the wants of the people by
converting physical inputs into the physical output.
Production function studies the functional relationship between physical inputs and physical
output of a commodity.
๐‘ธ๐’™ = ๐’‡(๐‘ณ, ๐‘ฒ)
Factors of Production
pg. 37
The process of producing goods in the modern economy is very complex. A good has to pass
through many stages and many hands until it reaches the consumerโ€™s hands in a finished
form. Land, labour, capital, entrepreneurial ability are all the factors or resources which make
it possible to produce goods and services.
Total Product (TP)
It is the sum total of output produced by all the units of a variable factor along with some
constant amount of the fixed factors used in the process of production.
๐‘ป๐‘ท = ๐‘ด๐‘ท๐Ÿ + ๐‘ด๐‘ท๐Ÿ + ๐‘ด๐‘ท๐Ÿ‘ + โ€ฆ โ€ฆ . + ๐‘ด๐‘ท๐’
Marginal Product (MP)
It is the change in total product per unit change in the quantity of variable factor. In other
words, it is the addition made to the totalproduction by an additional unit of output.
๐‘ด๐‘ท๐’ = ๐‘ป๐‘ท๐’ โ€“ ๐‘ป๐‘ท๐’ โˆ’ ๐Ÿ
Average Product (AP)
It is the total product per unit of the variable factor.
๐‘จ๐‘ท =
๐‘ป๐‘ท
๐‘ณ
Table No. 7
Units
of
Labour
Total
Product
Marginal
Product
Average
Product
Result
1 10 10 10
2 40 30 20
3 90 50 30
4 120 30 30
5 130 10 26
6 130 0 21.67
7 120 -10 17.14
-20
0
20
40
60
80
100
120
140
0 2 4 6 8
pg. 38
Relationship between AP and MP
(i) When AP rises as a result of an increase in the quantity of variable input, MP > AP.
(ii) When AP is maximum, MP = AP.
(iii) When average product falls as a result of a decrease in the quantity of variable
input, MP < AP.
Relationship between TP and MP
(i) So long as MP is increasing, TP is increasing at increasing rate.
(ii) When MP starts diminishing, TP increases only at a diminishing rate.
(iii) When MP = 0, there is no addition to TP. (TP is maximum).
(iv) When MP is negative, TP starts declining.
Law of Variable of Production
It states that as more and more of the variable factor is combined with fixed factor (capital), a
stage must ultimately come when marginal product of the variable factor starts declining.
Three stages of Production
(i) Stage 1, when MP is increasing, called the stage of increasing returns โ€“ TPP
increases at an increasing rate.
(ii) Stage 2, when MP is diminishing, called the stage of diminishing returns
(iii) Stage 3, when MP is negative, called the stage of negative returns.
pg. 39
Causes of Increasing Return to a Factor
(i) Fuller utilization of resources โ€“ When we go towards this optimum, we get
increasing returns because with increase in labour, the under-utilized fixed factors
like machinery and building are better and more efficiently used.
(ii) Increased efficiency of the variable factor โ€“ Specialization resulting from division of
labour increases efficiency which helps in getting increasing returns, i.e., MPP goes
on rising till it achieves maximum production with given inputs.
(iii) Better coordination between the factorsโ€“Among different combination of factors
of production, there is one optimum combination which gives maximum
production with given resources. Moreover, better coordination among factors
results in increasing returns.
Causes of Diminishing Return to a Factor
(i) Fixity of the factor โ€“ As more and more units of the variable factor are combined
with the fixed factor, the latter gets excessively utilized. It suffers greater wear and
tear and losses its efficiency.
(ii) Imperfect factor substitutability โ€“ Factors of production are imperfect substitutes
of each other. More and more of labour cannot be continuously used in place of
capital.
(iii) Poor coordination between the factors โ€“ Increasing application of the variable
factor.
Assignment
1. What is meant by inputs?
2. What is meant by output?
3. What is the general shape of MP?
4. Can there be fixed cost of a firm in the long run?
5. What is production function?
6. Explain relationship between AP and MP.
7. Distinguish between fixed factors and variable factors.
8. Explain the concepts of total product, average product and marginalproduct.
9. Explain law of variable factors in detail.
Application based questions
1. Calculate AP and MP from the following schedule -
pg. 40
Units of
Labour
1 2 3 4 5 6
Total
Product
20 30 36 38 38 36
2. Calculate TP and MP from the following schedule -
Units 1 2 3 4 5 6
AP 50 55 50 45 36 25
3. Explain three stages of production when one factorinput is variable. Use diagram and
schedule.
4. Explain reasons for increasing returns to a factor.
5. The following table gives APP of a factor. It is also known that the TPP at zero level of
employment is zero. Determine TPP and MPP schedules -
Level of employment 1 2 3 4 5 6
APP 50 48 45 42 39 35
6. Output of food grain in India at one stage was less than its domestic demand. Now it is
not. Does it mean that the law of diminishing returns has failed in Indian agriculture?
pg. 41
Concept of Cost
Cost analysis refers to the study of the behavior of cost in relation toone or more production
criteria, namely, size of output, scale of operations, prices of factors of production and other
relevant economic variables. Thus, cost refers to the expenditure incurred by a producer on
the factor as well as non-factor inputs for a given amount of output of a commodity.
Explicit Cost Implicit Cost
Expenditure incurred by the producer on the purchase of inputs from the market is called
Explicit Cost while estimated expenditure on the use of self-owned inputs is called Implicit
Cost.
Accounting Cost โ€“ When an entrepreneur undertakes an act of production he has to pay
prices of the factors which he employs for production. He thus pays, wages to workers
employed, prices for the raw materials, fuel and power used, rent for building he hires and
interest on the money borrowed for doing business. All these are included in his cost of
production are termed as accounting costs. Thus accounting costs take care of all the
payments and charges made by the entrepreneur tothe suppliers of various productive
factors.
Economic Costs โ€“ Economic cost include (i) the normal return on money capital invested by
the entrepreneur himself in his own business, (ii) the wages or salary not paid to the
entrepreneur but could not have been earned if the services had been sold somewhere else.
Likewise the monetary reward for all factors owned by the entrepreneurhimself and
employed by him in his own business are also considered a part of economic cost.
pg. 42
Outlay Costs โ€“ They involve actual expenditure of funds on wages, material, rent, interest etc.
Cost Function
The cost function refers to the mathematical relation between cost of product and the
various determinants of cost.
ShortRun Costs
There are some factors which can be easily adjusted with changes in the level of output. Thus
a firm readily employ more workers if it has to increase output. There is two types of cost.
1. Fixed Costs โ€“ These are sum total of expenditure incurred by the producer on the
purchase or hiring of fixed factors of production. These are also called supplementary
costs, overhead costs or indirect costs. These costs do not change with change in
output. For example, rent, wages of permanent employees, license fees etc.
2. Variable Costs โ€“ These costs are the expenditure incurred by the producer on the use
of variable factors of production. These are also called Prime Costs or Direct Costs.
These costs change on with change in output. For example, purchase of raw material,
wages of causal labour, expense electricity, wear and tear expenses etc.
Total Cost = Fixed Cost + Variable Cost
Total Cost โ€“ It is sum total of total fixed costs and total variable costs.
๐‘ป๐‘ช = ๐‘ป๐‘ญ๐‘ช + ๐‘ป๐‘ฝ๐‘ช
Average Fixed Cost โ€“ AFC is the total fixed cost is divided by the number of units of output
produced.The shape of AFC is rectangular hyperbola.
๐‘จ๐‘ญ๐‘ช = ๐‘ป๐‘ญ๐‘ช/๐‘ธ
Average Variable Cost โ€“ AVC is the total variable cost is divided by the number of units of
output produced.AVC = ๐‘ป๐‘ฝ๐‘ช/๐‘ธ
Average Total Cost โ€“ ATC is the total cost is divided by the numberof units of output
produced.
๐‘จ๐‘ป๐‘ช = ๐‘จ๐‘ญ๐‘ช + ๐‘จ๐‘ฝ๐‘ช
Marginal Cost โ€“ It the addition to total cost due to addition of one unit of output.
๐‘ด๐‘ช๐’ = ๐‘ป๐‘ช๐’ โˆ’ ๐‘ป๐‘ช๐’ โˆ’ ๐Ÿ
๐‘ด๐‘ช๐’ = ๐‘ป๐‘ฝ๐‘ช๐’ โˆ’ ๐‘ป๐‘ฝ๐’„๐’ โˆ’ ๐Ÿ
pg. 43
Output
(Units)
TFC TVC TC AFC AVC ATC MC
0 10 0 10 - - - -
1 10 10 20 10 10 20 10
2 10 18 28 5 9 14 8
3 10 24 34 3.33 8 11.33 6
4 10 28 38 2.50 7 9.50 4
5 10 32 42 2 6.40 8.40 4
6 10 38 48 1.66 6.33 7.99 6
7 10 46 56 1.42 6.57 7.99 8
8 10 56 66 1.25 7 8.25 10
MC is
U-
shaped
MC is U-shaped in accordance with the law of variable proportions. Falling MC is in
accordance with rising MP when there are increasing returns to a factor. Rising MC is in
accordance with falling MP when there are diminishing returns to a factor.
Relation between AC and MC
(i) When AC falls, MC<AC.
(ii) When AC rises, MC >AC.
(iii) When AC does not change, MC = AC.
(iv) MC cuts AC at its lowest point.
0
10
20
30
40
50
60
70
0 1 2 3 4 5 6 7 8 9
cost
output
pg. 44
Relation between TC and MC
(i) MC is estimated as the difference between total costof two successive units of
output.
(ii) When MC is diminishing TC increases at a diminishing rate.
(iii) When MC is rising, TC increases at an increasing rate.
(iv) When MC reaches its lowest point, TC stops increasing at a decreasing rate.
Rising Portion of MC Curve is the Supply Curve
๏ต In the figure, MC is U-shaped and P1 is the price line under perfect competition. At
price P1 , the price line cuts MC curve at two points โ€“ at Q1
aand Q1
b , i.e., it satisfies
profit maximizing condition P =MC at two places. But total profit at output level of Q1
b
is higher. Therefore, at price P1, the firm produces the amount Q1
b. It means that if
price is OP1 , the firm will supply Q1
b level of output. Similarly if price is OP2, the firm
would supply OQ2 level of output and at price OP3, it would supply OQ3 level of output
and so on. We see clearly that all price-output combinations are simply the points on
the rising portion of MC curve. Hence, it is concluded that the rising portion of MC
curve is the supply curve.
pg. 45
Assignment for Concept of Cost
1. What is variable cost?
2. What is meant by average cost?
3. What are selling cost?
4. What is the general shape of MC?
5. Explain the relationship between MC and AC.
6. Draw total variable cost, total cost and total fixed cost curves in a single diagram.
7. Complete the following table-
Outputs (Units) Average Cost (โ‚น) Marginal Cost (โ‚น)
1 12 -----
2 10 ------
3 ----- 10
4 10.5 -----
5 11 ------
6 ----- 17
8. Give two example of fixed cost.
9. What are the difference between variable costs and fixed costs?
10. A firmโ€™s fixed cost is โ‚น2000. Compare TVC, AVC, TC, and ATC โ€“
Output
(units)
1 2 3 4 5 6 7
Marginal Cost 2000 1500 1200 1500 2000 2700 3500
11. Classify the following into fixed and variable cost โ€“
(i) Rent for a shed
(ii) Minimum telephone bill
(iii) Cost of raw materials
pg. 46
(iv) Wages of permanent staff
(v) Interest on capital
Concept of Revenue
By selling a commodity whatever money a firm receives is called its revenue. For example, a
firm produces 500 shirts daily and sells these shirts at the price โ‚น200 per shirt, then revenue
of the firm is โ‚น100,000.
๐‘น๐’†๐’๐’†๐’๐’–๐’† = ๐‘ช๐’๐’”๐’•๐’” + ๐‘ท๐’“๐’๐’‡๐’Š๐’•๐’”
Total Revenue (TR) โ€“ total receipts of a firm from the sale of a given output is called total
revenue.
๐‘ป๐’๐’•๐’‚๐’ ๐‘น๐’†๐’—๐’†๐’๐’–๐’† = ๐‘ถ๐’–๐’•๐’‘๐’–๐’• ๐‘ฟ ๐‘ท๐’“๐’Š๐’„๐’†
Marginal Revenue โ€“ It is the change in total revenue which results from the sale of one more
unit of a commodity.
๐‘ด๐‘น = ๐‘ป๐‘น๐’ โˆ’ ๐‘ป๐‘น๐’ โˆ’ ๐Ÿ
๐‘ด๐‘น = โˆ†๐‘ป๐‘น/โˆ†๐‘ธ
Average Revenue โ€“ It refers to revenue per unit of output sold.
๐‘จ๐‘น =
๐‘ป๐‘น
๐‘ธ
pg. 47
Output
(units)
AR TR MR
1 10 10 10
2 9 18 8
3 8 24 6
4 7 28 4
5 6 30 2
6 5 30 0
7 4 28 -2
8 3 24 -4
Relation between MR and TR
(i) MR can be zero or even negative, but only when price is declining as under
monopoly or monopolistic competition.
(ii) TR stops increasing when MR = 0, so that TR is maximum when MR = 0.
(iii) TR starts declining when MR is negative.
(iv) When MR is declining, less and less is added to TR for every additional unit sold.
Accordingly TR increases only at a diminishing rate.
Relationship between TR and MR under Perfect Competition
In perfect competition, a firm is a price taker. It can sell as many units of its product at the
price given by the industry. Here price (AR) is constant and therefore, MR is also constant
because when an additional unit is sold, the addition made to total revenue, i.e., MR will be
equal to price (AR).
๐‘ท๐’“๐’Š๐’„๐’† = ๐‘จ๐‘น = ๐‘ด๐‘น
Units sold TR MR AR
1 20 20 20
2 40 20 20
-10
-5
0
5
10
15
20
25
30
35
0 1 2 3 4 5 6 7 8 9
pg. 48
3 60 20 20
4 80 20 20
Relationship between TR & MR
1. TR increases at a constant rate since price is constant and MR is also constant. This
implies that TR increases at constant rate.
2. AR = Price = MR, therefore AR, MR curves take the shape of straight line parallel to x-
axis.
3. Since TR increases at a constant rate, MR is also constant throughout.
What happen when AR Changes
Units sold TR MR AR
1 20 20 20
2 36 16 18
3 48 12 16
4 56 8 14
5 60 4 12
6 60 0 10
7 56 -4 8
0
10
20
30
40
50
60
70
80
90
0 0.5 1 1.5 2 2.5 3 3.5 4 4.5
AR/MR/TR
OUTPUT
pg. 49
Firms Revenue Curve in Different Markets
1. Revenue curve under Perfectly Competitive Markets โ€“ Under perfect competition, a
firm is a price taker. It cannot influence the market price. It can sell any number of
units of output at the prevailing price. Firmโ€™s price line or revenue curve under perfect
competition is a horizontal straight line. AR and MR coincidence with each other.
2. Revenue Curve under Monopoly โ€“ Under monopoly, AR and MR curve slope
downward from left to right. It m
eans that if a monopolist desires to sell more, he has to reduce price of the product.
-10
0
10
20
30
40
50
60
70
0 1 2 3 4 5 6 7 8
pg. 50
3. Revenue Curves under Monopolistic Marketsโ€“Under monopolistic competition, there
is inverse relationship between AR and output. Accordingly, AR and MR curves slope
download. The difference between monopoly and monopolistic is that under
monopolistic competition, AR and MR curves are more elastic.
Assignment for Concept of Revenue
1. What do you mean by revenue?
2. Define marginal revenue.
3. Explain relationship between average revenue and marginalrevenue under perfect
competition.
4. How do change in marginal revenue affect total revenue?
5. Describe relationship between TR and MR under perfect completion. Use diagram.
Or
What is behavior of MR in a market in which a firm can sell any quantity of output at a
given price?
6. What is the shape of TR curve under monopoly?
7. Why is AR always equal to MR for a competitive firm?
8. Complete the following table when each unit of commodity can be sold at โ‚น12.
Quantity
sold
1 2 3 4 5 6 7 8
TR
MR
AR
9. Complete the following table โ€“
Output AR MR TR
1 ____ 10 ___
2 9 ____ ____
3 ____ ____ 24
4 _____ 4 ____
pg. 51
Producerโ€™s Equilibrium
Producerโ€™s Equilibrium โ€“ It refers to a situation of profit maximization.
๐… = ๐‘ป๐‘น โˆ’ ๐‘ป๐‘ช
Producerโ€™s equilibrium is struck as that level of output where profit is maximized.
We know, ๐‘ป๐‘ช = ๐‘ป๐‘ฝ๐‘ช + ๐‘ป๐‘ญ๐‘ช
Gross Profit = TR โ€“ TVC
Net Profit = TR - (TVC +TFC)
Concept of Profit
(i) Abnormal profit or extra-normal profits, when
TR > TC Or, AR > AC
(ii) Normal profit, when
TR = TC Or, AR = AC
(iii) Sub-normal profits, when
TR < TC Or, AR < AC
Conditions of Producerโ€™s Equilibrium
(i) MR = MC and
(ii) MC is rising
Output MR TR MC TC ฯ€
1 20 20 15 15 5
2 20 40 20 35 5
3 20 60 18 53 7
4 20 80 16 69 11
5 20 100 14 83 17
6 20 120 12 95 25
7 20 140 15 110 30
8 20 160 19 129 31
9 20 180 20 149 31
10 20 200 22 171 29
pg. 52
Firmโ€™s Equilibrium when AR is not constant
When price is not constant, a firm can generally sell more of a commodity by lowering its
price. AR & MR slopes downward and MR slopes at a faster than AR. In such a situation,
equilibrium of a firm is struck when two conditions are satisfied โ€“
(i) MR = MC
(ii) MC is rising.
Assignment for Producerโ€™s Equilibrium
1. What is meant by producerโ€™s equilibrium?
2. Explain conditions of producerโ€™s equilibrium under MR and MC approach?
3. Explain producerโ€™s equilibrium in terms of TC and TR. Use diagram.
4. What are net profits?
5. Define sub-normal profit?
0
5
10
15
20
25
30
0 2 4 6 8 10
pg. 53
6. What are extra-normal profits?
7. Define normal profit.
8. Explain what happens to the profits if output level is beyond the equilibrium level.
Application and Value Based Questions
1. Normal profit is a part of total cost. Is it true?
2. Why equilibrium is not struck when MRโ€บ MC?
3. Should production be discontinued when AR = AVC?
4. Do you think it is a rational for a producer to strike equilibrium when MC is rising, not
when it is falling?
5. Find the equilibrium of a producer from the following table showing AR and AC of a
competitive firm โ€“
Output 1 2 3 4 5
AR 13 12 10 9 8
AC 7 8 10 11 12
6. Given below is a cost and revenue schedule of a producer. At what level of output the
producer is in equilibrium? Give reasons for your answer.
Output 1 2 3 4 5 6 7
Price 10 10 10 10 10 10 10
TC 10 22 30 38 47 57 71
pg. 54
Theory of Supply
The term supply refers the amount of a good or service that the producers are willing and
able to offer to the market at the various prices during a period of time. Quantity supplied
refers to specific amount offered for sale at a specific price of the commodity.
Supply Schedule
Supply schedule is a schedule showing various quantities of a commodity offered for sale
corresponding todifferent possible prices of the commodity. It has two aspects โ€“
a. Individual Supply Schedule (ISS) โ€“ It shows different quantities supplied by affirm at
different prices of a commodity.
b. Market Supply Schedule (MSS) โ€“It refers to supply of all the firms in the market
producing a particularcommodity.
Table No. - Supply Schedule
Price Supply
by firm
A
Supply
by firm
B
Market
Supply A
+ B
10 10 20 30
20 20 30 50
30 30 40 70
40 40 50 90
Supply Curve
It is the graphic presentation of supply schedule, showing various quantities of a commodity
offered for sale at different possible prices of that commodity.
a. Individual Supply Curveโ€“Individual supply schedule states the quantities of a
commodity that a producerwould offer for sale at various prices.
0
20
40
60
80
100
0 10 20 30 40 50
pg. 55
b. Market Supply Curve โ€“ A market supply schedule for a given commodity is the sum of
individual supply schedules of all those firms which are engaged in the production of a
given commodity during a given time.
Determinants of Supply or Supply Function
It studies the functional relationship between supply of a commodity and its various
determinants.
๐‘บ๐’™ = ๐’‡ (๐‘ท๐’™, ๐‘ท๐’“, ๐‘ต๐’‡, ๐‘ฎ, ๐‘ท๐’‡, ๐‘ป, ๐‘ฌ๐’™, ๐‘ฎ๐’‘)
Where Sx = supply of the commodity
1. Px = price of the commodity-Xโ€“The most important determinant of supply of a
commodity is its price. Higher the price of a commodity, the producers will produce
more quantities for sale in the market. There is direct relationship between price and
quantity supplied. This is also known as law of supply.
2. Pr = price of the related goods โ€“ Supply of a commodity also depends upon the prices
of the related goods especially substitute goods. If the price of substitute goods goes
up, producers will be tempted to produce the substitute goods. For example, if the
price of wheat goes up the land be put under cultivation of wheat.
3. Nf = number of the firms -
4. G = goal of the firm โ€“ Generally every firm tries to get maximum profit. But at times,
individual producers may be induced to increase the supply of a commodity not
because it brings in more profits for them, but because its supply in the market is a
source of status and prestige in the market.
5. Pf = price of factors of production โ€“ Prices of the factors of production used in the
production of a commodity constitute the cost of production of this commodity. If the
prices of these factors go up, its total cost of production may rise. In such a situation ,
the producers may divert theirresources to the production of some other commodity,
which can be produced at a lower cost. As a result, the supply of this commodity will
decrease.
6. T = state of technology โ€“ Over time, technical knowledge changes. Discoveries and
innovations help raise the productivity of the factors and thus contribute to the
raising of the supply upwards.
7. Ex = business confidence
8. Gp = government policy
โ‚นโ‚นโ‚น
Law of Supply
pg. 56
The law of supply states that other things remaining same, the quantity of a good produced
and offered for sale will increase as the price of the good rises and decreases as the price
falls.
Prices (โ‚น) Quantity
Supplied
50
40
30
20
10
50
40
30
20
10
Assumption of Law of Supply
(i) There is no change in the price in the price of the factors of production.
(ii) There is no change in the technique of production.
(iii) There is no change in the goal of the firm.
(iv) There is no change in the price of the related goods.
(v) There is no change in business confidence.
Exception to the Law of Supply
(i) It does not apply on agricultural products whose supply is governed by natural
factors.
(ii) Supply of goods having social distinction will remain limited even if their price
tends to rise.
(iii) At a given point of time, sellers may be willing to sell more of a perishable
commodity even at a lower price.
pg. 57
Movements along a Supply Curve
Due to movement of supply curve, there is extension and contraction of supply curve. When
the supply of a good rises due to rise in the price of the good alone, it is termed as extension
of supply. When supply of a good falls due to fall in its price, it is called contraction of supply.
Shift in Supply Curve
Shifts in supply curve refers to situations of increase or decrease in supply when own price of
the commodity remains constant. When at the given price, the supply of a good increases, it
is termed as increase in supply. When at the given price, the supply of a good decreases, it is
termed as decrease in supply.
Causes of Shifts in Supply Curve
(i) Improvement in technology/outdated technology causes shifts in supply curve.
(ii) Changes in factor prices
(iii) Changes in the price of a competing product
(iv) Change in the number of firms
(v) Changes in taxation policy.
Price Elasticity of Supply
The price elasticity of supply is the measure of change in quantity supplied of a commodity
due to change in its price. i.e.
๐‘ฌ๐’‘ = ๐’‘๐’†๐’“๐’„๐’†๐’๐’•๐’‚๐’ˆ๐’† ๐’„๐’‰๐’‚๐’๐’ˆ๐’† ๐’Š๐’ ๐’’๐’–๐’‚๐’๐’•๐’Š๐’•๐’š ๐’”๐’–๐’‘๐’‘๐’๐’Š๐’†๐’…/ ๐’‘๐’†๐’“๐’„๐’†๐’๐’•๐’‚๐’ˆ๐’† ๐’„๐’‰๐’‚๐’๐’ˆ๐’† ๐’Š๐’ ๐’‘๐’“๐’Š๐’„๐’†
๐‘ฌ๐’‘ = ๐’…๐’’/๐’…๐’‘ ๐‘ฟ ๐’‘/๐’’
Types of Price Elasticity of Supply
A. Perfectly Inelastic Supply โ€“ If as a result of change in price, the quantity supplied of a
good remains unchanged, we say that the elasticity of supply is zero or the good has
perfectly inelastic supply. The vertical supply curve shows that irrespective of the
price change, the quantity supplied remains unchanged.
B. Relatively less-elastic Supply โ€“ If as a result of a change in the price of a good its
supply changes less proportionately, we say that the good is relatively less elastic.
C. Relatively greater-elastic Supply โ€“ If elasticity of supply is greater than one i.e., when
the quantity supplied of a good changes substantially in response to a small change in
the price of the good.
D. Unit-elastic โ€“ If the relative change in the quantity supplied is exactly equal to the
relative change in price, the supply is said to be unitary elastic.
pg. 58
E. Perfectly Elastic Supply โ€“ The supply elasticity is infinite when nothing is supplied at a
lower price but a small increase in price causes supply to rise from zero to an
indefinitely large amount indicating that producers will supply any quantity
demanded at that price.
Factors affecting Price Elasticity of Supply
Following factors affect the elasticity of supply of a commodity โ€“
(i) Nature of inputs used โ€“ The elasticity of supply depends on the nature of inputs
used for the production of a commodity. Easily available inputs will be elastic, and
scarcely available will be inelastic.
(ii) Nature of the commodity โ€“ Perishable goods are relatively less elastic in supply
than durable goods.
(iii) Time factor โ€“ Longer the time period, greater will be the elasticity of supply.
(iv) Technique of production โ€“ Less elastic in case of a commodity involves the use of
complex and expensive technology.
Assignment for Supply
1. Define supply.
2. What is supply function?
3. What will be the shape of a perfectly inelastic supply curve?
4. What will be the shape of a perfectly elastic supply curve?
5. Write formula price elasticity of supply.
6. State law of supply.
7. Explain effect of the change in technology on the supply of a good.
8. Explain the effect of rise in input prices on the supply of a good.
9. Government imposes a tax on production of a good. Explain its effect on supply of
that good.
10. What is elasticity of supply? How is it measured?
11. Use diagram and schedule to distinguish increase in supply and decrease in supply.
12. Distinguish between movement of supply curve and shift in supply curve.
13. At a price of โ‚น12 per unit, the quantity supplied of a commodity is 200 units. Its price
elasticity of supply is 1.5. If its price rises to โ‚น16 per unit, calculate its quantity
supplied at new price.
14. The supply of a commodity at a price of โ‚น20 is 50 units. A 10% rise in its price results in
a 15% rise in its supply. Calculate its price elasticity of supply.
15. The quantity supplied of a commodity at a price of โ‚น8 per unit is 400 units. Its price
elasticity of supply is 2. Calculate the price at which price its quantity supplied will be
600 units.
pg. 59
Forms of Market
Market is the life-line of modern economic life. It is the medium to bring together the sellers
and buyers. Market may be defined as the entire area in which buyers and sellers are in
contact with each other for the purchase and sale of the commodity. In other words, market
is a mechanism that facilitates contact the buyers and sellers for the sale and purchase of
goods and services.
Forms of markets
A. Perfect Competition
B. Monopoly
C. Monopolistic Competition
D. Oligopoly
Perfect Competition
It is a form of the market where there is a large number of buyers and sellers of a commodity.
Homogeneous product is sold with no control overprice by an individual firm.
Features of Perfect Competition
i. Large number of buyers and sellers โ€“Thereare a large number of buyers and sellers
who compete among themselves and their number is so large that no buyer or
seller is in a position to influence the demand orsupply in the market.
ii. Homogeneous Product โ€“ All the firms sell identical product. The commodity is
dealt in homogeneous product i.e., identical product in colour, size, shape or
quality.
iii. Free Entry and Exit of the firm โ€“ Everyfirm is free to enter the market or to go out
of it. In long run, any firm will enter if there are extra normal profit or exit the
industry if there are sub normal profit (loss).
iv. Perfect Knowledge of the Market โ€“There is a perfect knowledge of the
market.Both of buyers and sellers know that the uniform price prevails for a
homogeneous product.
v. Perfect Mobility โ€“ There is perfect mobility of the factors of production within the
market, which ensures uniform cost of production in whole economy. They can
move to the industry which offers them maximum.
vi. No Transportation Cost โ€“ There is no transportation cost, as there is uniform price
which prevails in the economy and thus producers prefer to sell in nearby areas
and buyers prefer to buy from nearest places.
pg. 60
Vital Component of Perfect Competition
(1) Demand Curve under Perfect Competition โ€“ Under this market, the numberof the
firms producing homogeneous product is so large that a single firm cannot influence
the price as market supply remains unaffected, even if a few firms change the supply
of the product.
(2) A Firm is a Price Taker โ€“ A firm is price taker and not a price maker. Price in perfect
competition is determined by the industry and all the firms in the industry sell their
output at the given price, determined by the industry.
Monopoly
โ€˜Monoโ€™ means single and โ€˜polyโ€™ means to control. Thus, monopoly is a situation in which
there is single seller of a product which has no close substitute. Pure monopoly is never found
in practice. However, in public utilities such as transport, water and electricity, we generally
find monopoly form of market.
Features of Monopoly Market
(i) Single Seller in the Market โ€“ There is only one firm producing/ supplying a
product. This single firm constitutes the industry and as such there is no
distinction between the firm and the industry in a monopolistic market.
(ii) There is restriction to entry of the new firm. The restriction to entry could be
economic, institutional, legal or artificial.
(iii) No Close Substitute โ€“ It sells a product which has no close substitutes. As there
are no close substitutes, a monopolist does not face any competition.
(iv) Price Discrimination โ€“ As monopolist is a price maker, he sometimes charges
different prices from different consumers in different market areas. This is
known as Price Discrimination. For example, electricity tariff is different for
commercial use as compared to domestic use.
(v) Full control over Price โ€“ Monopolist is price maker and can fix whatever price
he wishes to fix for his product.
(vi) Slopes of AR and MR Curves โ€“ Although monopolist has full control over price
and supply of the product, yet he faces negative market demand curve, which
pg. 61
is a constraint for him. Market demand gives inverse relation between price
and demand of the commodity. So, in orderto sell more units of the
commodity, he has to reduce the price of the product.
Table No. โ€“
Average Revenue, Total Revenue and Marginal Revenue in Monopoly
Quantity
sold
AR TR MR
0 10 0 0
1 9 9 9
2 8 16 7
3 7 21 5
4 6 24 3
5 5 25 1
6 4 24 -1
7 3 21 -3
Monopolistic Competition
Consider the market of soaps. Well-known brands on sale are lux, Dettol, liril, pears, lifebuoy
plus, dove and so many others. Is this market an example of perfect competition? Since all
soaps are almost similar, this appears to be an example of perfect competition. But on close
inspection we find that each seller has at least some variation between his product and those
of its competitors.This type of market shows monopolisticcompetition. Thus monopolistic
market is a form of the market there are many sellers of the product, but the product is little
be different from that of the other.
Features of Monopolistic Competition
(i) A Large of firms - There are a large number of sellers who individually have a small
share in the market. As a result, firms are in a position to influence marginally the
-10
0
10
20
30
40
0 2 4 6 8 10
revenue
quantity sold
pg. 62
price of their product due to their names. For instance, among soaps of different
brands, Dettol, Liril, Godrej No. 1 etc.
(ii) Product Differentiation โ€“ The products of different sellers are differentiated on the
basis of brands. They can be differentiated from each other on the basis of brand
name, shape, colour, quality, type of service and workmanship etc.
(iii) Free Entry and Exit of Firms โ€“ New firms are free to enter into the market and
existing firms are free to quit it.
(iv) Selling Costs โ€“ Sellers try to compete on the basis other than price, as for example
aggressive advertising, product development, better distribution arrangements,
efficient after-sale service and so on.
Causes of Emergence of Monopoly
A monopoly structure arise in any of the following ways โ€“
(i) Government Licensing/Government Control โ€“ The government may grant license
for production of particular commodity only to one another leading to monopoly.
Licensing is used to ensure minimum standards of competency. For example โ€“
Indian Railway.
(ii) Patent Rights โ€“ Patent rights entitle the owner an exclusive right to a production
process. New products may secure patent rights which prohibit others from using
the shape, design or other features of the product, thus creating a monopoly.
(iii) Cartels โ€“ It is a large number of firms which have explicitly agreed to work
together. This is done to avoid competition and secure monopoly control of the
market. For example โ€“ OPEC ( Organization of Petroleum Exporting Countries)
(iv) Control of Resources โ€“ Monopoly sometimes occurs due to substantial control
over certain resources required in the production. For example DeBeercompany of
South Africa controls about 80% of the worldโ€™s production of diamond.
Oligopoly
The word โ€œOligopolyโ€ derived from two Greek โ€œOligosโ€ which means few and โ€œPollenโ€™ which
means to sell. Thus, oligopoly is a form of market in which there are a few big sellers of a
commodity and a large number of buyers. Each seller has a significant share of the market.
For example, Tata, Ford etc. In oligopoly, sellers produce homogeneous goods or the close
substitute but not perfect substitutes of one another.
Features of Oligopoly
(i) A few Firms โ€“ There are a few sellers of the commodity and each produces a
substantial portion of total output of the industry. The numberof the firms is so
small that each seller knows that he can influence the output and profit of rival
pg. 63
firms whose reaction may prove counterproductive. This makes the firms mutually
dependent on each otherin case of decisions about price and output. For example,
there is interdependence of decision about price between Pepsi and Coca Cola. If
Pepsi reduces price, Coca Cola may do the same substantially.
(ii) Importance of advertising and selling costs โ€“ Heavy selling and advertisement
costs are incurred to attract customers.
(iii) Group behavior โ€“ Interdependence of firms compels them to act in mutual
cooperation. Thus, group behavior in the form of collective decisions and mutual
cooperation by the firm is very common.
(iv) Barriers to entry of new firms โ€“ The barriers are โ€“
๏ƒผ Patents โ€“ the patent holder may give license to only a few firms.
๏ƒผ Requirement of Huge Capital โ€“ Since huge investment is required , it may
not be very easy to arrange funds for new firms on the basis of their
worthiness.
๏ƒผ Control over Resources โ€“ Ability and availability of strategic raw materials
and other inputs may be restricted tofew firms.
(v) Indeterminate demand Curve โ€“ Under oligopoly, there is no certainty in the
behavior pattern of the producer. So demand curve faced by an oligopolistic
market is undetermined. Any change in price by one producer may or may not lead
to change in prices by the rival firms. Therefore, the demand curve is not definite
i.e., it is undetermined.
(vi) Selling Costs โ€“ Due to cut throat competition and interdependence among the
firms, various sales promotion are used. Firms in oligopoly spend on persuasive
advertisement and other promotion schemes in order to increase the volume of
sales.
Types of Oligopoly
A. Collusive or Cooperative Oligopoly โ€“ It is a form of the market in which there are few
firms in the market and all agree to avoid competition through a formal agreement.
They cooperate with each other, in determining price or output or both.
B. Non-Collusive or Non-Cooperative Oligopoly โ€“ It is a form of the market in which there
are few firms in the market and each firm follows its price and output policy
independent of the rival firms. The firms compete with each other and there is cut
throat competition. Each firm tries to increase its market share through competition.
Comparative Study of All Markets
Perfect Competition Monopoly Monopolistic Oligopoly
pg. 64
Competition
Very large number
of buyers and
sellers
Single seller Large number of firms A few firms
Homogeneous
product
Product without
substitute
Differentiated product Homogeneous
and
differentiated
product
Free entry and exit
of the firm
Very difficult entry
of new firm
Free entry and exit of the
firm
Difficult entry
of new firms
Perfect knowledge Price discrimination Selling cost Selling costs
Demand curve
parallel to X-axis
Demand curve
slopes downward
Demand curve slopes
downward
AR, MR curves
downward
sloping
No control over
price
Great control of
price
Some control over price Price rigidity
Perfect mobility
Important points to Remember
๏ƒ˜ Patent Rights โ€“ Patent rights entitle the owner an exclusive right to a production
process. New products may secure patent rights which prohibit others from using
the shape, design or other characteristics of the product, thus creating monopoly.
๏ƒ˜ Cartels โ€“ It is a large number of firms which have explicitly agreed to work
together. This is done to avoid competition and secure monopoly control of the
market.
Question
Multiple Choice Questions
1. No selling costs are required in -
(a) monopoly (b) monopolistic
competition (c) perfect competition (d)
oligopoly
2. AR & MR curves are downward sloping in -
(a) monopoly (b) monopolistic competition
(c) both (d) none
3. AR curve coincides with MR curve in -
(a) monopoly (b) monopolistic competition
(c) perfect competition (d) oligopoly
4. Examples of goods produced in a monopolistic form of market
(a) samsang T.V. (b) Tata tea
(c) LG refrigerator (d) all of these
pg. 65
5. In Middle East, a group of oil companies by forming a cartel jointly decide output
and prices of oil. This is an example of โ€“
(a) collusive oligopoly (b) monopolistic
competition (c) duopoly (d) imperfect
oligopoly
Very short answer questions of one mark each
1. Name the market structure in which firm is itself an industry.
2. What is meant by monopolistic competition?
3. What is a cartel?
4. Draw AR and MR curves of a firm in a single diagram under monopolisticcompetition.
5. Define patent rights.
6. What is imperfect oligopoly?
7. Draw the demand curve of a firm under monopoly.
8. Name the market structure in which firm is itself an industry.
Higher Order Thinking Skills
1. Explain product differentiation.
2. Draw the AR curve of a firm under (i) monopoly and (ii) perfect competition. Explain
the differences in these curves, if any.
3. Explain selling cost under monopolisticcompetition.
4. Explain the demand curve facing a firm under monopolistic competition is negatively
sloped?
Value Based Questions
1. The government has granted license of production of a particular commodity to one
production unit leading to emergence of monopoly. Though monopoly leads to
concentration of power in few hands as per conventionalbelief, how in your opinion
monopoly is good for us?
2. Firms under monopolistic competition spend huge amount on advertisement. It is felt
desirable by the firms to make people aware of the new products available and also to
create brand image in the mind of consumers. Is it justified?
Conceptual Questions โ€“
1. Define market.
2. What are the basis for classifying a market?
3. What are the features of perfect competition?
pg. 66
4. Explain product differentiation.
5. Explain the feature โ€˜large number of buyers and sellersโ€™ of a perfectly competitive
market.
6. Explain the concept of selling cost under monopolistic competition.
7. Explain why the demand curve facing a firm under monopolistic competition is
negatively sloped?
8. List the different ways in which oligopoly firms may behave.
9. When a firm is called โ€˜price takerโ€™?
10. Differentiate between pure competition and perfect competition.
Value Based Questions
1. The government has granted license of production of a particular commodity to
one production unit leading to emergence of monopoly. Though monopoly leads to
concentration of power in few hands as per conventionalbelief, how in your opinion
monopoly is good for us?
2. Firms under monopolistic competition spend huge amount on advertisement. It is felt
desirable by the firms to make people aware of the new products available and also to
create brand image in the mind of consumers. Is it justified?
pg. 67
Market Equilibriumunder Perfect Competition
Introduction
Prices of goods express their exchange value. These are also used for expressing the value
of various services rendered by different factors of production such as land, labour,
capital and organization. These values respectively are rent, wage, interest and profit.
Therefore the concept of price, especially the process of price determination, is the vital
importance in economics. Generally price is the interaction between demand and supply
that determines the price but sometimes Government intervenes and determine the price
either fully or partially.
Meaning of Equilibrium
Equilibrium, in general terms implies (a) a balance between the opposite forces and (b) a
state of rest or a situation that has a tendency topersist. Let us take examples to show
the application of these meanings in microeconomics.
Let us take a market situation in which buyers and sellers are negotiating to buy and sell a
good. Both have different prices to offer. But the good will be sold only when both agree
to a common price and a common quantity at htat price. If both agree, a market
equilibrium is said to emerge. As we know that buyers and sellers have opposite interests.
The buyers will like to pay as low a price as possible. The sellers will like to charge as high
a price as possible. Agreement on a common price and quantity creates a balance
between the two opposite interests. This equilibrium price and quantity has a tendency to
persist.
Equilibrium Price
Equilibrium price is the price at which the sellers of a good are willing to sell the same
quantity which buyers of that good are willing to buy. We can explain with help of market
demand and supply schedule of a good, which are given below โ€“
Determination of Prices
pg. 68
Market equilibrium is a situation of the market in which demand for a commodity is
exactly equal to its supply, corresponding toa particular price.
๐‘ซ๐’™ = ๐‘บ๐’™
Equilibrium price which corresponds to the equality between market demand and
market supply of a commodity. Equilibrium quantity which corresponds to the equilibrium
price in the market.
Prices of
Commodity
Demand Supply
10 60 20 Excess Demand
20 50 30
30 40 40 Equilibrium
40 30 50 Excess supply
50 20 60
Excess demand - Excess demand means more of commodity demanded and less supply of
that commodity.
Excess supply โ€“ Excess supply means more of a commodity supplied and less demand for
that commodity in the market.
Assumptions of Equilibrium
(i) Demand curve should always have negative slope.
(ii) Supply curve should always have positive slope.
(iii) If the demand increases more than the supply, the price will increase and if the
supply increases more than the demand, the price will fall.
pg. 69
Effect of shift in Demand and Supply on Market Equilibrium
Market equilibrium struck when free play of demand and supply set up. There are two
effect on shift in demand and supply โ€“
Effect of Shift in Demand
Shift in demand refers to increase in demand or decrease in demand. It occurs owing to
change in determinants of demand, other than own price of the commodity.
Observations increase in demand Observations in Decrease in demand
(a) DD is the initial demand curve,
crossing supply curve at point E,
point of initial equilibrium.
(b) Owing to increase in demand,
demand curve shifts to the right from
DD TO D1D1. At the existing price,
quantity demanded rises from point
E to point E1.
(a) DD is the initial demand curve,
crossing supply curve at point E,
point of equilibrium.
(b) Owing to decrease in demand curve
shift to the left from DD to D2D2. And
at the existing price quantity
demanded falls from point E to point
E2.
Effect of shift in supply
Shift in supply means to increase or decrease in supply due to change in other determinants
than price of own commodity. Increase in supply shown in figure 2A. In the diagram, DD is
demand curve and SS is the supply curve. At equilibrium price OP the quantity sold and
purchased OQ. Now suppose, for some reason, the supply increases. The supply curve will
shift S1S1. Thus at new equilibrium price, the demand and supply become equal to OQ1.
pg. 70
Conclusion โ€“ Shift in the supply curve to the right brings down the equilibrium price, the
amount sold and purchased increases.
Decrease in supply, SS is the supply curve and DD is the demand curve. The equilibrium price
is set up at point E, demand and supply are OQ. Now suppose, the recessionary business
conditions, the supply decreases. The supply curve shifts leftward to S1S1. Demand curve
remains unchanged at DD, new equilibrium is attained at point F. new equilibrium price OP1
equates demand and supply at OQ1.
Conclusion โ€“ Decrease in supply results in an increase in the equilibrium price, the quantity
demanded and supplied falls.
Change in Supply and Equilibrium Price: some Exceptional situations
๏ต When Demand is Perfectly Elastic โ€“ Perfectly elastic demand curve is parallel to X-axis
implying that demand of a commodity is infinite at the prevailing price.
pg. 71
(1) When supply rises and supply curve shifts from SS to S1S1(rightwards)
o Equilibrium price remains same as OP, as demand is perfectly elastic.
o Equilibrium quantity rises from OM to OM1 as there is increase in supply.
(2) When supply falls and the supply curve shifts from SS to S2S2 (leftwards)
(a) Equilibrium price remains same as OP, as demand is perfectly elastic.
(b) Equilibrium quantity falls from OM to OM2 as there is decrease in supply.
๏ต When Demand is Perfectly Inelastic โ€“ Perfectly inelastic demand curve is parallel to Y-
axis implying that a change in price of the commodity causes no change in its quantity
demanded.
(1) When supply rises and the supply curve shifts rightwards (SS to S1S1)
(a) Equilibrium price falls from OP to OP1 as there is increase in supply.
(b) Equilibrium quantity remains same as OM, as demand is perfectly inelastic.
(2) When supply falls and the supply curve shifts leftwards (SS to S2S2)
(a) Equilibrium price rises from OP to OP2 as there is decrease in supply.
(b) Equilibrium quantity remains same as OM, as demand is perfectly inelastic.
๏ต When supply is Perfectly Elastic โ€“ Perfectly elastic supply is parallel to X-axis implying
that any amount of product can be supplied at the prevailing price.
pg. 72
(1) When demand curve shifts right DD to D1D1
(a) Equilibrium price does not change, remains OP because supply is perfectly elastic.
(b) Equilibrium quantity rises from OM to OM1.
(2) When demand falls and the demand shifts left from DD to D2D2
(a) Equilibrium price does not change, because supply is perfectly elatic.
(b) Equilibrium quantity falls from OM to OM2.
๏ต When Supply is Perfectly Inelastic โ€“ Perfectly inelastic supply curve is parallel to Y-axis
implying that the quantity supplied remains unaffected due to change in price.
(1) When demand rises and the demand curve shift to the right (DD to D1D1)
(a) Equilibrium price rises from OP to OP1 as there is rise in demand.
(b) Equilibrium quantity remains same as OM as supply is perfectly inelastic.
(2) When demand falls and the demand curve shifts to left (DD to D2D2)
(a) Equilibrium price falls from OP to OP2 as there is fall in demand.
(b) Equilibrium quantity remains same as OM as supply is perfectly inelastic.
pg. 73
Simultaneous change in demand and supply
(i) In fig โ€“ 3A, shows a simultaneous increase or decrease in both demand and supply.
Demand and supply increase in the same proportion. Consequently the
equilibrium point shifts from E to F. equilibrium price remains same.
(ii) Fig โ€“ 3B shows a simultaneous increase or decrease but demand increase or
decrease in a larger proportion. Consequently equilibrium point shifts from E to F.
equilibrium price rises from OP to OP1.
(iii) Fig โ€“ 3C shows a simultaneous increase or decrease but supply increase or
decrease in a larger proportion. Consequently equilibrium point shifts from E to F.
equilibrium price falls from OP to OP1.
Important Points โ€“
๏ƒผ Price Ceiling โ€“ It means maximum price the producers are allowed to charge. In
other words, price ceiling is fixing the price of a commodity at a lower than the
equilibrium price.
๏ƒผ Price Floor โ€“ It means the minimum price the producers are allowed to charge. In
other words, price floor is fixing the price of a commodity at a higher level the
equilibrium price.
๏ƒผ Black Market โ€“ It is a market in which the goods are sold at a price higher than the
maximum price fixed by the government.
๏ƒผ Rationing โ€“To ensure availability of good at a minimum price fixed by government,
an upper limit on the quantity that can be purchased through fair price shops is
fixed. This maximum quantity fixed by government is called rationing.
pg. 74
๏ƒผ
Assignment for Determination of Price
Objective Type Questions
1. Define price ceiling.
2. What is floor price?
3. What is black market?
4. What is rationing?
Conceptualized Questions
1. Why does government intervene toaffect market equilibrium?
2. Why do black markets exist?
3. How surplus created as a result of price floor imposed by government is utilized?
Value Based Questions
1. In the market, there exist excess demand for LPG cylinders. To do away with this
excess demand government has tried to restrict its usage by providing only 9 LPG
cylinders at subsidized rates in a year. What policy implication does this move by
government have?
2. Equilibrium price is the market determined price where demand is equal to supply.
However, equilibrium price may not be the best price. Why does government
intervention become necessary in a welfare state like India?

More Related Content

What's hot

Positive vs normative
Positive vs normativePositive vs normative
Positive vs normative
Pandidurai P
ย 
Economics: Chapter 2
Economics: Chapter 2Economics: Chapter 2
Economics: Chapter 2
krobinette
ย 
Introduction to macroeconomics
Introduction to macroeconomicsIntroduction to macroeconomics
Introduction to macroeconomics
Shivam Bindra
ย 
Economics: Chapter 1
Economics: Chapter 1Economics: Chapter 1
Economics: Chapter 1
krobinette
ย 

What's hot (20)

Positive vs normative
Positive vs normativePositive vs normative
Positive vs normative
ย 
Economics: Chapter 2
Economics: Chapter 2Economics: Chapter 2
Economics: Chapter 2
ย 
Positive and Normative Economics.docx
Positive and Normative Economics.docxPositive and Normative Economics.docx
Positive and Normative Economics.docx
ย 
Ch 1 intro
Ch 1 introCh 1 intro
Ch 1 intro
ย 
Basic economic problem
Basic economic problemBasic economic problem
Basic economic problem
ย 
The Nature and Importance of Economics
The Nature and Importance of EconomicsThe Nature and Importance of Economics
The Nature and Importance of Economics
ย 
Introduction to Economics
Introduction to EconomicsIntroduction to Economics
Introduction to Economics
ย 
Nani intro to macroeconomics
Nani intro to macroeconomics Nani intro to macroeconomics
Nani intro to macroeconomics
ย 
Concept of economics
Concept of economicsConcept of economics
Concept of economics
ย 
The utility function
The utility functionThe utility function
The utility function
ย 
Introduction to economics
Introduction to economicsIntroduction to economics
Introduction to economics
ย 
Theory of income and employment chap 1
Theory of income and employment chap 1Theory of income and employment chap 1
Theory of income and employment chap 1
ย 
Scarcity, choice, and opportunity cost
Scarcity, choice, and opportunity costScarcity, choice, and opportunity cost
Scarcity, choice, and opportunity cost
ย 
Introduction to macroeconomics
Introduction to macroeconomicsIntroduction to macroeconomics
Introduction to macroeconomics
ย 
General equilibrium : Neo-classical analysis
General equilibrium : Neo-classical analysisGeneral equilibrium : Neo-classical analysis
General equilibrium : Neo-classical analysis
ย 
Economic concepts presentation
Economic concepts presentationEconomic concepts presentation
Economic concepts presentation
ย 
1. introduction to microeconomics
1. introduction to microeconomics1. introduction to microeconomics
1. introduction to microeconomics
ย 
Economics: Chapter 1
Economics: Chapter 1Economics: Chapter 1
Economics: Chapter 1
ย 
Economic theories
Economic theoriesEconomic theories
Economic theories
ย 
Economics, Scarcity and Choices
Economics, Scarcity and ChoicesEconomics, Scarcity and Choices
Economics, Scarcity and Choices
ย 

Viewers also liked (7)

Demand part one
Demand part oneDemand part one
Demand part one
ย 
CAPE Economics, June 2004, Unit 1, Paper 2 suggested answer by Edward Bahaw
CAPE Economics, June 2004, Unit 1, Paper 2 suggested answer by Edward BahawCAPE Economics, June 2004, Unit 1, Paper 2 suggested answer by Edward Bahaw
CAPE Economics, June 2004, Unit 1, Paper 2 suggested answer by Edward Bahaw
ย 
Shifts In Demand And Supply And Market Equilibrium
Shifts In Demand And Supply And Market EquilibriumShifts In Demand And Supply And Market Equilibrium
Shifts In Demand And Supply And Market Equilibrium
ย 
Business economics b com part i
Business economics b com  part iBusiness economics b com  part i
Business economics b com part i
ย 
Demand in health care
Demand in health careDemand in health care
Demand in health care
ย 
Factors Affecting Demand
Factors Affecting DemandFactors Affecting Demand
Factors Affecting Demand
ย 
Ec0 401
Ec0 401Ec0 401
Ec0 401
ย 

Similar to Introduction to Micro Economics (11)

EAB UNIT-I.pptx
EAB UNIT-I.pptxEAB UNIT-I.pptx
EAB UNIT-I.pptx
ย 
Engineering Economics.docx
Engineering Economics.docxEngineering Economics.docx
Engineering Economics.docx
ย 
lux segmentation
lux segmentationlux segmentation
lux segmentation
ย 
Economics problems and the PPC
Economics problems and the PPC Economics problems and the PPC
Economics problems and the PPC
ย 
Economics for ssc in english medium
Economics for ssc in english mediumEconomics for ssc in english medium
Economics for ssc in english medium
ย 
Assignment of engineering economics by Bishnu Bhandari
Assignment of engineering economics by Bishnu BhandariAssignment of engineering economics by Bishnu Bhandari
Assignment of engineering economics by Bishnu Bhandari
ย 
Introduction to business 1
Introduction to business 1Introduction to business 1
Introduction to business 1
ย 
Raj PPt
Raj PPtRaj PPt
Raj PPt
ย 
Ch 02
Ch 02Ch 02
Ch 02
ย 
The Economic Problem: Scarcity and Choice
The Economic Problem: Scarcity and ChoiceThe Economic Problem: Scarcity and Choice
The Economic Problem: Scarcity and Choice
ย 
TUTORS CIRCLE - Cpt Super Circle Summary Economics december 2013
TUTORS CIRCLE - Cpt Super Circle Summary Economics december 2013 TUTORS CIRCLE - Cpt Super Circle Summary Economics december 2013
TUTORS CIRCLE - Cpt Super Circle Summary Economics december 2013
ย 

Introduction to Micro Economics

  • 1. RAJA RAM SHARMA PGT ECONOMICS SURAJKUND INTERNATIONAL SCHOOL DAYAL BAGH, FARIDABAD, HARYANA INTRODUCTORY MICROECONOMICS
  • 2. pg. 1 Introduction to Micro Economics What is Economics about? Take an example, Ram has Rs.1000. He is free to spend to spend the money as he like. What will he do? He has many options before him, (i) He can purchase a dress for him. (ii) He may go to watch a movie and eat in a restaurant. (iii) He can give tuition fees for his children. What do you notice about this above example? He has many options before him. He is not enough money to fulfil his all wants. This arises due to means are limited and human wants are unlimited. The two main facts for this โ€“ a. Human beings have unlimited wants, and b. The means of satisfying these wants are relatively scarce, Term economics is derived from Greek wordOikonomia meaning household. Definitions of Economics There are four main definition of Economics which are as follows: A. Science of wealth โ€“ The classical economist defined economics in terms of the science of wealth. Adam Smith is known as father of Modern Economics published his book entitled โ€œ An Enquiry intothe Nature and Causes of Wealth of Nationโ€ in in 1776.โ€œ Science which deals with wealthโ€. โ€“ J.B. Say.
  • 3. pg. 2 B. Science of material well-beingโ€“ Alfred Marshall was in favor of welfare of human beings. According to him,โ€ Economics is the study of mankind in the ordinary business of life. It examines that part of individual and social action which is most closely connected with the attainment and with the use of the material requisites of well beings. C. Science of choice making โ€“ Lionel Robbins of the London School of Economics gave a new definition to Economics in his famous bookโ€ nature and significance of Economicsโ€ in 1931. According to him,โ€™โ€ Economics is the science which studies human behavior as a relationship between ends and scarce means which have alternative usesโ€. D. Science of dynamic growth and developmentโ€“ Innovative and scientific definition was given by Paul Anderson Samuelson. According to him,โ€ Economics is the study of men and society choose, with or without the use of money, to employ scarce productive resources which could have alternative uses, to produce various commodities over time and distribute them for consumption now and in the future amongst various people and groups of societyโ€. Microeconomics and Macroeconomics The subject matter of economics has been divided into twoparts โ€“ microeconomics and macroeconomics. In Microeconomics we study the economic behavior of an individual units like firm. It is basically concerned with the mechanism of allocation of resources. It is show partial equilibrium analysis as it seeks to determine price and output in an industry independent of those in other industries. Following are studied under this branch- (a) Product pricing (Theory of Demand and Theory of Production & Cost) (b) Consumer behavior (c) Factor pricing (Theory of Distribution) (d) Economic conditions of a section of the people (e) Study of firms and location of a industry The term Macroeconomics derived from Greek wordMakros which means large. In macroeconomics we study the economic behavior of the large aggregates such as the overall economic conditions of the economy such as total production, totalconsumption etc.Following are come under macroeconomics- (a) National income and output (b) General price level (c) Balance of trade and payments (d) External value of money (e) Savings and investment; and
  • 4. pg. 3 (f) Employment and economicgrowth Economy and its Central Problems Economy refers to the nature and level of economic activities in an area, which may be a village, a city, a country as a whole. Economic activities include production, consumption, investment and exchange. There are three types of the economy which are as follows- A. Capitalist Economy โ€“ Capitalism is an economic system in which all the means of production are owned and controlled by private individuals for making profits. In brief, private property is the mainstay of capitalism and main motive to earn maximum profits. Price is determined with the free interplay of forces of demand and supply. There are many features of capitalism: (i) The right of private property (ii) Freedom of enterprise (iii) Freedom to choice by the consumers (iv) Profit maximization (v) Competition among firms (vi) Inequalities of income B. Socialist Economy โ€“ The material means of production i.e. factories, capital, mines etc. are owned by the whole community represented by the state is known as socialist economy or centrally planned economy. Its main objective to attain maximum welfare for the whole society. (i) There is collective ownership of all means of production except small farms, workshops and trading firms which may remain in private hands. (ii) There is a central authority to set and accomplish socio-economicgoals. (iii) Freedom from hunger is guaranteed. (iv) A relative equality is an important feature. (v) Price mechanism exists in a socialist economy. C. Mixed Economy โ€“ In a mixed economy, the aim is to develop a system which tries to include the best features of both the controlled economy and the market economy while excluding the demerits of both. Features of the mixed economy: (i) Private sector (ii) Public sector
  • 5. pg. 4 (iii) Combined sector Market Economy Planned Economy Mixed Economy There is a market mechanism that connects buyers and sellers. There is a lack of market mechanism Market mechanism operates that connects buyers and sellers but checks and balances by the government. The main objective of this economy is to earn maximum profit. The main objective of this economy is to social welfare. One way to get profit and other way to provide social welfare. Means of resources are owned and controlled by individual. Means of production are owned by govt. or govt. agency. There are co-existence of public and private sectors on allocation of resources. Consumer are sovereign by in sense of taste and preference of consumer. There is no consumer sovereignty in this type of economy. There is some extent of consumer sovereignty. Central problems of an Economy Resources are scarce, every economy faces the problems of choice. It is the problem related to the allocation of resources to alternative uses, is called the prob;ems of resource allocation. There are four basic problems: What to produce? Every society has to decide which goods and services are to be produced and in what quantities. Food or cloth? Much food and less cloth or vice versa? Wheat or sugarcane? More butter or more tanks? In case of more tanks, some resources will have to be diverted from butter, but the economy cannot have more tanks and more butters with available resources at the same time. Similarly, society has to decide between consumer goods and producer goods, between necessary goods and luxury goods. Since resources are limited, all goods and services desired cannot be produced. So the society has to decide which goods to be produced and the quantities in which selected commodities are to be produced. How to produce?
  • 6. pg. 5 There are various alternative techniques of producing a good. For example sugar is produced with either employing more labour or machine. As we know that resources are scarce, a decision has to be taken about which technique should be used. The guiding principle is to adopt those techniques which involve least possible cost to produce per unit of commodity. For whom to produce? This problem relates to the problem of distribution of goods and services among the society. As we know that the society cannot satisfy all wants of all the people. Therefore, it has to decide who should get how much of the total output of goods and services. Another aspect of this problem is how should output of the economy be distributed among different persons and families so that all persons get minimum level of consumption. This problem of distribution arises due to output produced in the economy is limited while wants of the people are unlimited. What provisions are to be made for the economic growth? A society would not like to use all its scarce resources for current consumption only. This is because if it uses all the resources for current consumption and no provision is made for future production, the societyโ€™s production capacity would not increase. Production Possibility Curve(PPC) A production possibility is a curve which shows various combination of two goods which are producing in an economy with the given level of resources and technology. Thus PPC is a curve that shows the different rates of production of two goods that an individual or group can efficiently produce with given resources and state of technology. Assumption of PPC (a) Two goods are taken (b) A given amount of productive resources (c) Resources are neither unemployed nor underemployed (d) Technology remains same Table No. 1. For PPC Production Possibilities Wheat (kg) Cloth (meter) Opportunity Cost A 15 0 - B 14 1 1 C 12 2 2 D 9 3 3 E 5 4 4
  • 7. pg. 6 F 0 5 5 Shifting/ Rotation of Production Possibility Curve 1. Change in resources โ€“ Due to change in resources, PPC shift right ward or leftward. If resources are increased in the economy, production of both goods are increased or decreased in resources means less of both goods in the economy. 2. Change in technology โ€“ Improved technology used in production of good โ€“ Y, more of good โ€“ Y is to be produced in the economy.
  • 8. pg. 7 (a) Efficient technology used in production of good โ€“ Y , we get more of good โ€“Y which is shown in figure 1A. (b) Efficient technology used in production of good โ€“ X, we get more of good โ€“ X, which is shown in figure 1B. (c) Efficient technology used in production of both goods โ€“ X and Y, we get both goods more which is shown in figure 1C. Properties of Production Possibility Curve Production possibility curve has two basic properties- (i) Production possibility curve slopes downward โ€“ PPC is downward sloping because more of one good can be obtained only by giving the production of another good given the resources of the economy. Increasing the production of one good, sacrificing other good. (ii) Production possibility curve is concave to the point of origin โ€“ Increasing MRT implies that for producing an additional unit of a good, sacrifice of units of other goods goes on increasing. MRT increases because it is assumed that no resource is equally efficient in production of all goods. So it becomes difficult tosubstitute resources specialized in one good to production of othergood. As the increasing MRT, shape of PPC concave to the origin. Opportunity Cost Suppose a student completing his medical degree, he/she has two option open to him. One to join a hospital which gives him/her Rs.15 lakh annum and second to start his/her clinics and earn Rs.12 lakh annum. Now if he/she join the hospital, he/she earn Rs.15 lakh annum but he/she will not get Rs.12 lakh. This Rs.12 lakh is his/her opportunity cost for serving in
  • 9. pg. 8 the hospital and not setting up his/her clinics. Thus, opportunity cost of a given activity is defined as the value of the next best activity. Marginal Opportunity Cost (MOC) MOC refers to additional opportunity cost when a unit more of good-X is produced by withdrawing some resources from the production of good-Y. It is also known as marginal rate of transformation (MRT). ๐‘ด๐‘ถ๐‘ช = โˆ†๐’€ โˆ†๐‘ฟ Where โˆ†Y = loss in output in Good โ€“ Y โˆ†X = gain in output in Good โ€“ X Assignment for Introduction of Microeconomics One marks questions - 1. The law of scarcity โ€“ (i) does not apply to rich/ developed countries (ii) applies only to less developed countries (iii) implies that consumerโ€™s want be satisfied in a socialistic system (iv) implies that consumersโ€™ want will never be completely satisfied 2. Define opportunity cost. 3. What are the vital functions of the economy? Ans. Production, exchange, investment and consumption are vital component of an economy. 4. Define marginal rate of transformation. (CBSE 2008) 5. Why does an economic problem arise?
  • 10. pg. 9 Ans. Scarcity of resources having alternative uses in relation to unlimited wants give s rise to economic problem. 6. Give two examples of microeconomic study.(CBSE 2011) 7. What is the meaning of economics? 3 or 4 marks questions โ€“ 1. Production in an economy is below its potential due to unemployment. Government starts income generation schemes. Explain its effect using production possibilities schedules. (CBSE 2013) 2. State factors which cause rightward shift of PPC. (CBSE 2007) 3. Why is a PPC concave to the point of origin? (CBSE 2014) 4. Explain central problem โ€˜what to produceโ€™. 5. Explain central problem โ€˜for whom to produceโ€™. 6. What does increasing MOC along a PPC mean? 7. Explain how scarcity and choice go together. 8. Give two examples of underutilizations of resources. 9. Differentiate between centrally planned economy and market economy. 10. Differentiate between microeconomics and macroeconomics. 11. Find Marginal Rate of Transformation from the following table- Good โ€“ X 0 1 2 3 4 5 Good โ€“ Y 20 19 17 14 10 0 12. Explain PPC with help of schedule and diagram. 13. Which technique of production โ€“ labourintensive technique or capital intensive โ€“ should be adopted when Indian economy is labourabundance and capital scarcity economy? (value based) 14. As water resources are limited in our economy, suggest two measures of economizing water resources so that it would not become a future problem for us. (value based) 15. An economy always produces on, but not inside a PPC. Defend or refute. (NCERT)
  • 11. pg. 10 Consumerโ€™sEquilibrium โ€“ Utility Analysis Utility In economics, the term utility refers to the quantity of a commodity tosatisfy human wants. In other words, want satisfying power of a commodity termed as utility. The good has quality to satisfy human desires by consuming of it. Total Utility โ€“ Sum total of utility derived from the consumption of all the units of a commodity is called total utility (TU). ๐‘ป๐‘ผ = โˆ‘๐‘ด๐‘ผ Marginal Utility โ€“ An additional utility derived from consumption of one extra unit of a commodity is called marginal utility (MU). ๐‘ด๐‘ผ๐’ = ๐‘ป๐‘ผ๐’ โ€“ ๐‘ป๐‘ผ๐’ โˆ’1 Law of Diminishing Marginal Utility (LDMU) One of the important law under MU analysis is the LDMU. It states that as more and more units of a commodity are consumed, MU derived from every additional unit must decline. It happens in all goods and services. It is, therefore called Fundamental Law of Satisfaction or Fundamental Psychological Law. Suppose a consumer has to consume apples. He may get utility from different units of apples as follows Units of Apples MU Graphic Presention 1 2 3 4 5 6 7 25 20 15 10 5 0 -5
  • 12. pg. 11 Assumption of the LDMU i. Only standard units of the commodity are consumed. ii. Consumption of the commodity is continuous. iii. There is no change in taste and preferences of the consumer. iv. There is no change in income of the consumer. Table No. 2 Utility Analysis Units of commodity Marginal Utility Total Utility 1 50 50 2 40 90 3 30 120 4 20 140 5 10 150 6 0 150 7 -10 140 Relation between TU and MU (i) TU= โˆ‘๐‘ด๐‘ผ (ii) TU increases so long as MU is positive. (iii) When MU is zero, TU is maximum. (iv) When MU is negative, TU starts diminishing.
  • 13. pg. 12 (v) Decreasing MU implies that TU is increasing at a diminishing rate. Concept of Consumerโ€™s Equilibrium Consumerโ€™s equilibrium is a situation when a consumer spends his entire income in such a way, he gets maximum satisfaction. There are two situations for consumerโ€™s equilibrium: A. One commodity case B. Two commodities case Consumers Equilibrium in one commodity case: Buying of a commodity by a consumer depends on three factors: a. Price of the commodity b. Marginal utility of the commodity c. Marginal utility of money ๐‘ด๐‘ผ๐’Ž = ๐‘ด๐‘ผ๐’™ ๐‘ท๐’™ Units of commodity MUx MUm 1 2 3 4 5 6 20 18 16 10 0 -5 20/4=5 18/4=4.5 16/4=4 10/4=2.5 0/4=0 -5/4=- 1.25
  • 14. pg. 13 Consumerโ€™s Equilibrium in two commodities case: In X-commodity, A consumer strikes his equilibrium when: ๐‘ด๐‘ผ๐’Ž = ๐‘ด๐‘ผ๐’™ ๐‘ท๐’™ -------- (i) In Y-commodity, A consumer strikes his equilibrium when: ๐‘ด๐‘ผ๐’Ž = ๐‘ด๐‘ผ๐’š ๐‘ท๐’š --------- (ii) Relating equation (i) and (ii), we get ๐‘ด๐‘ผ๐’™ ๐‘ท๐’™ = ๐‘ด๐‘ผ๐’š ๐‘ท๐’š = ๐‘ด๐‘ผ๐’Ž Utility Schedule in case of Two Commodities Units of Goods MUX ๐‘ด๐‘ผ๐’Ž = ๐‘ด๐‘ผ๐’™ ๐‘ท๐’™ MUY ๐‘ด๐‘ผ๐’Ž = ๐‘ด๐‘ผ๐’š ๐‘ท๐’š 1 2 3 4 5 6 7 8 9 35 30 25 24 20 16 12 8 4 7 6 5 4.8 4 3.2 2.4 1.6 0.8 72 64 56 48 40 32 24 16 12 9 8 7 6 5 4 3 2 1.5
  • 15. pg. 14 10 0 0 8 1 Suppose a consumer who has โ‚น55 with him to spend on two goods X and Y and price of goods are โ‚น5 and โ‚น8 respectively. How will a consumer attain his equilibrium? For obtaining maximum satisfaction from spending his given income of โ‚น55, the consumer will buy 3 units of good X and 5 units of good Y. In this way, he will get maximum satisfaction. ๐’€ = ๐‘ท๐’™ . ๐‘ธ๐’™ + ๐‘ท๐’š. ๐‘ธ๐’š 55 = 5 X 3 + 8 X 5 Condition of Consumerโ€™s Equilibrium i. Rupee worth of marginal utility should be equal tomarginal utility of money. ii. Marginal utility of money remains constant. iii. Law of diminishing marginal utility must hold good. Questions for 1 mark โ€“ 1. What do you mean by utility?(CBSE 2006) Ans. Utility is the quality or power to satisfy human wants. 2. What is meant by marginal utility of money? 3. What is total utility? 4. State law of diminishing marginal utility. 5. What do you mean by marginal utility? 6. What is consumerโ€™s equilibrium? Questions for 3 or 4 marks โ€“ 1. A consumer consumes only two commodities x and y and is in equilibrium. Show that when the price of x rises, consumer buys less of good x. use utility analysis. (CBSE 2014) 2. A consumer consumes only two goods X & Y. state and explain the conditions of consumerโ€™s equilibrium with help of utility analysis. 3. Explain the relation between total utility and marginal utility. Ans. Followings are the relations between TU and MU โ€“ (i) Both TU and MU are equal in the beginning. (ii) When Mu is positive, TU is increasing. (iii) When MU is zero, TU is maximum.
  • 16. pg. 15 (iv) When MU is negative, TU is decreasing. 4. Define marginal utility. State the law of diminishing marginal utility. 5. State consumerโ€™s equilibrium in one commodity case. 6. When onion price hits hard, the poor man simply stops buying it. Explain of it, using utility analysis. Application and Value Based Questions 1. As a consumer, would you equate price of a commodity with total utility or marginal utility? Give reason in support of your answer. 2. When onion price hits hard, the poor man simply stops buying it. Explain the economics of it, using utility analysis. Consumerโ€™sEquilibrium โ€“ Indifference Curve Analysis Comparison of utility in terms higher or lower level of satisfaction refers to Ordinal concept of utility. It differs from the Cardinal concept where utility is measured in terms like 1,2,3,4, etc. Prof. Hicks has developed a theory of consumerโ€™s equilibrium based on ordinal concept of utility. This theory is popularly known as Indifference Curve Analysis. Concept of Indifference Set and Indifference Curve Can indifference curve is a curve which represents all those combinations of goods which give same satisfaction to the consumer. Table No.3 Indifference Schedule combination Rice cloth MRS A 1 12 B 2 6 6 C 3 4 2 D 4 3 1
  • 17. pg. 16 Indifference set is a set of those combinations of two goods which offer the consumer the same level of satisfaction. So that, the consumer is indifferent across any number of combinations in his indifference set. Monotonic Preferences of the Consumer Consumerโ€™s preferences are called monotonicwhen between twobundles [say (10,9) and (9,9), one bundle has more of at least one of the goods and no less of the other, the consumer prefers bundles (10,9) to bundles (9,9). Monotonic preferences of the consumer is an underlying assumption of IC analysis. It means, the consumer preferences are such that greater consumption of a commodity always offers him a higher level of satisfaction. Marginal Rate of Substitution (MRS) MRS is the rate at which the consumer is exchange goods X and Y. ๐‘ด๐‘น๐‘บ = ๐’…๐’€ ๐’…๐‘ฟ Slope of IC is known as MRS. Properties of indifference curve (I) Indifference curves slope downward to the right โ€“ it is happened that when the amount of one good in combination is increased, the amount of the other good is reduced. This is essential if the level of satisfaction is to remain the same on an indifference curve.
  • 18. pg. 17 (II) Indifference curve are always convex to the origin โ€“ It has beenobserved that as more and more of one commodity (X) is substituted for another (Y), the consumer is willing to part with less and less of the commodity being substituted(Y). This is called diminishing marginal rate of substitution. (III) Indifference curves can never intersect each other. (IV) A higher indifference curves represent a higher level of satisfaction than the lower indifference curves. (V) Indifference curve will not touch the axis. Budget Line A budget line shows all those combinations of two goods which the consumer can buy spending his given money income on the two goods at theirprices. All those combinations which are within the reach of the consumer will lie on the budget line. Illustration โ€“ A consumer has is Rs.80. He is purchasing Good โ€“ 1 and Good โ€“ 2. Price of Good โ€“ 1 is Rs.16 and price of Good โ€“ 2 is Rs.20. Draw a budget line. ๐‘ท๐Ÿ๐‘ฟ๐Ÿ + ๐‘ท๐Ÿ๐‘ฟ๐Ÿ = ๐’€ 16X1 + 20X2 = 80
  • 19. pg. 18 A consumer can only afford to buy combinations that fall along his budget line, is called feasible or attainable combinations. A consumer cannot afford to buy combinations that are beyond his budget line , is called non-feasible or non-attainable combination. Consumerโ€™s Equilibrium A consumer is in equilibrium when he is deriving maximum possible satisfaction from the goods and is in no position to rearrange his purchases of goods. We assume that: (i) The consumer has a given indifference map which shows his scale of preferences for various combinations of two goods X and Y. (ii) He has a fixed money income which he has to spend wholly on goods X and Y. (iii) Prices of goods X and Y are given and are fixed for him. (iv) All goods are homogeneous and divisible. (v) The consumers act rationally and maximizes his satisfaction. Conditions of Consumerโ€™s Equilibrium through Indifference Curve (i) MRSxy = ๐’‘๐’™ ๐’‘๐’š i.e., marginal rate of substitution must be equal to ratio of prices of two goods. Digrammatically, it means a consumer attains equilibrium at the point where budget line is tangent to indifference curve. (ii) MRSxymust be decreasing i.e., indifference curve should be convex to the origin. Let two goods be x any Y. MRSxy means the number of units of Y the consumer is willing to sacrifice for getting one extra unit of X. ๐‘ท๐’™ ๐‘ท๐’š is the ratio of prices in the market which is equal to the ratio of units of Y required to be sacrificed for getting one extra unit of X. For consumerโ€™s equilibrium graphically, two basic tools โ€“ indifference map and budget line โ€“ are required. In figure, we superimpose budget line or price line M on consumerโ€™s indifference map touching indifference curve IC2 at point E. As we know that indifference to the right represent higher satisfaction. The aim of the consumer is to obtain the highest combination on his indifference map and therefore he tries to go to the highest indifference curve with his given budget line. He would be in equilibrium only on such point which is
  • 20. pg. 19 common to both the budget line and the highest attainable indifference curve. Here that point is E where budget line M is tangent to indifference curve IC2. In the figure, E is the equilibrium point where both the conditions are fulfilled simultaneously. Bundles on the higher indifference curve IC3 are not affordable because his income does not permit to move above the budget line whereas bundles on the lower indifference curve IC1 give lower satisfaction than at IC2. Hence the equilibrium choice is only point E which is point of tengency of budget line with indifference curve IC2. At this point, slope of indifference curve is equal to slope of budget line or MRSxy= ๐‘ท๐’™ ๐‘ท๐’š . Thus at the point E the consumer achieves state of equilibrium. The equilibrium purchase is OX of good X and OY of good Y on indifference curve IC2. Why MRS must be equal to the Ratio of prices of two goods? Let two goods be X and Y. MRSxy is the number of units of Y the consumer is willing to sacrifice to get extra unit of X. the ratio of prices ๐‘ท๐’™ ๐‘ท๐’š which is also equal to ratio of units of Y required to be sacrificed to get one extra unit of X. Suppose MRS is greater than ratio of prices of two goods (MRSโ€บ ๐‘ท๐’™ ๐‘ท๐’š ). Then consumer gains and increases consumption of X. but as he gets more and more units of X, marginal utility of X goes on falling. So the consumeris willing to sacrifice less and less of Y each time he gets one extra unit of X. As a result, MRS falls and ultimately becomes equal to ๐‘ท๐’™ ๐‘ท๐’š . At this point, consumer is in equilibrium. Suppose MRSxyโ€น ๐‘ท๐’™ ๐‘ท๐’š . It means the consumer is willing to sacrifice less units of Y for getting one extra unit of X. The consumer losses and reduces consumption of good X. The process continues till MRSxy= ๐‘ท๐’™ ๐‘ท๐’š . Hence MRS must be equal to ratio of prices of two goods, i.e., ๐‘ท๐’™ ๐‘ท๐’š .
  • 21. pg. 20 Questions for 1 mark โ€“ 1. What is the meaning of indifference Curve? 2. What is indifference set? 3. Define a budget line or price line. Ans. A budget line is the locus of all those points where each point shows various combinations of two goods which a consumer can actually buy given his money income and the prices in the market. Questions for 3 or 4 marks โ€“ 1. What do you mean by the budget set of a consumer? (NCERT) Ans. The budget set is the collection of all the bundles of goods that a consumer can buy with his income at the prevailing market prices. 2. A consumer budget is โ‚น160. He is buying Good โ€“ X and Good โ€“ Y. Price of good - x and good- y are โ‚น8 per unit and โ‚น10 per unit respectively. Draw a budget line. 3. Define monotonic preference of the consumer. 4. Define price line. 5. State features of indifference curve. 6. Explain the consumerโ€™s equilibrium with the help of indifference curve. 7. Explain why is indifference curve convex to the point of origin? 8. Explain the meaning of meaning of diminishing marginal rate of substitution. Theory of Demand
  • 22. pg. 21 The concept of demand refers to the quantity of a good orservice that consumers are willing and able to purchase at of various prices during a period time. In other words, demand for a commodity refers to the desire to buy a commodity backed with sufficient purchasing power and the willingness to spend. Demand for a commodity is always expressed with reference to price. There is inverse relationship between price and demand. Quantity demanded refers to specific quantity tobe purchased against a specific price of the commodity. Demand Schedule Demand schedule is a tabular presentation of showing the relation between different quantities of a commodity to be bought at different price of that commodity. There are two types of demand schedule: A. Individual Demand Schedule (IDS) โ€“ It refers to demand schedule of an individual buyer in the market. It shows quantities of a commodity which an individual will purchase at different possible prices of that commodity, at a point of time. B. Market Demand Schedule (MDS) โ€“ It is a table showing different quantities of a commodity that all the buyers in the market are ready to buy at different possible prices of the commodity at a point of time. In simple words, when we add up the various quantities demanded by the number of consumers in the market we can obtain the market demand schedule. Table No. โ€“ 5 Demand Schedule Price of Apple A B C D 5 10 25 15 50 4 15 30 20 65 3 20 35 25 80 2 25 40 30 95 1 30 45 35 110
  • 23. pg. 22 Demand Curve Demand curve is a graphic representation of demand schedule showing how quantity demanded of a commodity is related to its own price. There is two types of demand curve: a. Individual Demand Curve โ€“ It is a curve showing different quantities of a commodity that one particular buyer is ready to buy at different possible prices of the commodity at a point of time. b. Market Demand Curve โ€“ It shows various quantities of a commodity that all the buyers in the market are ready to buy at different possible prices of the commodity at a point of time. Determinants of Demand or Demand Function Demand function shows the relationship between demand for a commodity and its various determinants. Dx = f(Px,Pr,Y,T,E,N,Yd) Where Dx = demand for a commodity-X Px = price of the commodity Pr = price of related commodity Y = income of the consumer T = taste and preference of the consumers
  • 24. pg. 23 E = expectations of consumers N = size of population Yd = distribution of income (i) Price of the commodity โ€“ Other things remaining constant, with a rise in own price of tโ†‘he commodity, its demand diminish and with a fall in price, its demand extends. This inverse relationship between own price of the commodity and its demand is called law of demand. (ii) Price of related goods โ€“ There are two types of related goods (a) Substitute goods โ€“ these are those goods which are used in place one another like tea and coffee. Increase in price of coffee will increase in demand of tea. There is direct or positive relation between price and quantity demanded for the commodity. Increase in price of coffee will increase the demand of tea and vice- versa. Good (Tea) Substitute (coffee) Price โ†‘ Demand โ†“ Price โ€“ no change Demand โ†‘ Price โ†“ Demand Price โ€“ no change Demand โ†“ (b) Complementary goods โ€“ These are those goods which used jointly like car and petrol. Increase price of car will fall in demand of petrol. There is inverse relation between price and quantity demanded in complementary goods. Good (car) Complimentary (petrol) Price โ†‘ Demand โ†“ Price โ€“ no change Demand โ†“ Price โ†“ Demand โ†‘ Price โ€“ no change Demand โ†‘ (iii) Income of the consumer โ€“ Change in income of the consumer also effects his demandfor different goods. Increase in income of the consumer will increase the demand of normal goods and decrease the demand of inferiorgoods. (iv) Tastes and preferences โ€“ Demand for goods and services also depends on individualโ€™s tastes and preferences. Tastes and preferences of the consumers are influenced by advertisement, change in fashion, climate, new inventions etc. Favourable taste and preference attracts more demand of that goods and unfavourable taste and preference lose its demand in the market. (v) Expectation โ€“ If the consumer expects a significant change in the availability of the concerned commodity in the near future, he may decide to change his present demand for the commodity.
  • 25. pg. 24 (vi) Population size โ€“ Demand increases with increase in the number of buyers for a commodity. Suppose size of population increases, demand also increases. There is also positive relation between population and demand. (vii) Distribution of income โ€“ It is also influenced by the distribution of income in the society. If redistribution of income increases inequality ( rich becoming richer and poor becoming poorer), the demand for luxury goods is expected to rise and poorer section go for inferior goods. Law of Demand The law of demand is one of the most important laws of economic theory. According to law of demand, other things being equal, if the price of a commodity falls, the quantity demanded of it will rise and if the price of a commodity rises, its quantity demanded will decline. Demand Schedule Price (โ‚น) Quantity Demanded (kg) 100 100 80 150 60 200 40 250 20 300 Assumptions of the Law of Demand (i) Tastes and preferences of the consumers remains same. (ii) There is no change in the income of the buyers. (iii) Prices of the related goods do not change. (iv) There is no change in the price of the commodity.
  • 26. pg. 25 Why does Demand Curve slope Downward from left to right? (a) Law of Diminishing Marginal Utility- According to law of diminishing marginal utility, as a consumer uses more and more units of a commodity, marginal utility of that commodity goes on decreasing. A consumer will try to extend his consumption to the point where the marginal utility of the commodity is equal to the price of the commodity. So it is only at a low price at that a consumer would like to purchase more quantities of a commodity. (b) Income effect โ€“ When price of a commodity falls, the purchasing powerof the consumer increases and vice-versa. For example, a consumerโ€™s income is โ‚น150. He buys 15 kg of potatoes at a price of โ‚น10 per kg. But now price increases to โ‚น15 per kg, he will purchase only 10 kg of potatoes. In this sense, consumerโ€™s real income falls and vice-versa. (c) Substitution effect โ€“ When price of a commodity falls, it becomes relatively cheaper than its substitutes. For example: tea and coffee are substitutes, if price of coffee falls, it will become relatively cheaper than tea. So people, who were purchasing tea before may now purchase coffee. This will increase the demand for coffee. (d) Size of consumer group โ€“ When price of a commodity falls, it comes within the purchasing power of some households, who could not afford to purchase it earlier. Thus a fall in price increase the number of consumers and a rise in price decreases the number of consumers. (e) Different uses Exceptions to the Law of Demand Followings are the important exceptions to the law of demand (i) Conspicuous Goods โ€“ Articles of prestige value are demanded only by the rich people and these articles become more attractive if their prices go up. Such articles will not conform to the usual law of demand. This was found out by Veblen Effect or prestige goods effect. (ii) Giffen Goods โ€“ Sir Robert Giffen, an British Economist, was surprised to find out that as the price of bread increased, the British workers purchased more bread and not less of it. This was something against the law of demand. Why did this happen? Because when the price of bread went up, it caused such a large decline in the purchasing power of the poorpeople that they were forced to cut down the consumption of meat and othermore expensive foods. Since bread even when its price was higher than before was still the cheapest food article, people consumed more of it and not less when its price went up. Such goods which exhibit direct relation between price and demand are called โ€˜Giffen Goodsโ€™.
  • 27. pg. 26 (iii) Conspicuous Necessities โ€“ The demand for certain goods is affected by the demonstration effect of the consumption pattern of a social group to which an individual belongs. These goods, due to theirconstant usage, have become necessities of life. For example, cooking gas, prices of television sets, refrigerators, coolers etc. Movements along a Demand Curve A movement along the demand curve indicates changes in the quantity demanded because of price changes, other factors remaining constant. Due to this movement extension of demand and contraction of demand happens. a. Extension of demand โ€“ It occurs when quantity demanded increases in response to a fall in own price of the commodity. b. Contraction of demand โ€“ It occurs when quantity demanded decreases in response to a rise in own price of the commodity. Shifts in Demand Curve A shift of the demand curve indicates that there is a change in demand at each possible price because one or more other factors, such as incomes, tastes or the price of some other goods, have changed. In short, change in demand represents shifts of the demand curve to right or left resulting from changes in factors such as income, tastes, prices of other goods etc. there is two ways of shifting like increase in demand and decrease in demand.
  • 28. pg. 27 a. Increase in demand โ€“ It refers to a situation when quantity demanded of a commodity increases, even when own price of the commodity is same. b. Decrease in demand โ€“ It refers to a situation when quantity demanded of a commodity decrease, even when own price of the commodity is same. Price (โ‚น) Quantity Demanded 20 40 20 60 20 80 Causes of Change in Demand a. When income of the consumer changes. b. When price of substitute good change. c. When price of the complementary good change. d. When taste of the consumer shifts against the commodity due to change in fashion or climate.
  • 29. pg. 28 e. When availability of the commodity is expected to change in the near future. Cross Price Effect: How Price of Related Goods affects Demand for a Commodity Effectof change in price of related good on the demand for a commodity is called cross price effect. We know related goods are two types โ€“ (a) substitute goods and (b) complimentary goods (a) Demand for a commodity in relation to price of the substitute good โ€“ Let us consider tea and coffee as the substitute goods. If tea and coffee are substitute and price of Tea remains constant โ€“ (a) demand curve for Tea would shift to the right if price of Coffee increases And (b) demand curve for Tea would shift to the left if price of Coffee decreases. (b) Demand for a commodity in relation to price of the complimentary goods โ€“ If car and petrol are complimentary goods and price of car remains constant โ€“ (a) demand curve for car shift forward if price of petrol reduces and (b) demand curve for car shift backward if price of petrol increases. Relationship between Income and Demand If our income rises, we generally tend to buy more of goods. More income would mean more things like stationery, clothes or medicines. There are two types of goods โ€“ normal goods and inferior goods. (i) Normal goods โ€“ These are the goods the demand for which increases as income of the buyer rises. There is positive relationship between income and demand. (ii) Inferior goods โ€“ These are the goods the demand for which decreases as income of buyer rises. There is negative or inverse relation between income and demand. Impact of taste and preference of demand for a commodity
  • 30. pg. 29 Favourable and Unfavourable change in Tastes and Preferences Favourable change in taste and preferences attracts buyers to purchase more of the commodity on the same price, while unfavourable change in taste and preferences does not attract more purchase for the commodity. Questions for 1 marks โ€“ 1. What do you mean by demand? 2. What is market demand schedule? 3. What is meant by demand curve? Questions for 3 or 4 Marks 1. Explain law of demand with graph and schedule. 2. Distinguish between contraction of demand and extension of demand. 3. Difference between decrease in demand and increase of demand. 4. Distinguish between normal goods and inferior goods. 5. Difference between substitute good and complimentary good. 6. Why demand curve slopes downward from left to right? 7. State the exceptional of law of demand. 8. How does change in substitute good affect the demand of the given good? Explain with the help of an example. 9. Give one reason for a shift in demand curve. 10. Distinguish between movement along demand curve and shift in demand curve. Movement along demand curve Shift in demand Curve A demand curve which shows change in demand caused by change in price alone is called movement along demand curve. Shift in demand curve which is caused by factors other than price denotes shifting of original demand curve to the right or to the left.
  • 31. pg. 30 In this, we can see extension or contraction of demand. In this, we can see increase or decrease of demand. Application and Value Based Questions 1. Explain how the demand for a good is affected by the prices of its related goods. Give examples. 2. Certain goods are demanded even when their price is zero. Does it mean that we are demanding even those goods which are scarce? 3. Why should diamonds be priced so high and water be priced so low even when water is essential to sustain life while diamonds are not? 4. What is the relation between good โ€“ x and good โ€“ y, if with rise in the price of good โ€“ x, demand for good โ€“ y rises? Give an example. 5. Fall in price of a commodity always leads to expansion of its demand. Comments.
  • 32. pg. 31 Price Elasticity of Demand Till now we were concerned with the direction of the changes in prices and quantities demanded. We learnt that increase or decrease in own price of the commodity causes contraction or extension of demand. While discussing the concepts of contraction or extension of demand. We do not talk degree of change in quantity of a commodity; we only talk of the direction of change. Degree of change ( the degree of extension and contraction) in response to change in own price of the commodity is the subject matter of elasticity of demand. Price Elasticity of Demand Price elasticity of demand expresses the response of quantity demanded of a good to a change in its price. ๐‘ท๐’“๐’Š๐’„๐’† ๐‘ฌ๐’๐’‚๐’”๐’•๐’Š๐’„๐’Š๐’•๐’š = % ๐’„๐’‰๐’‚๐’๐’ˆ๐’† ๐’Š๐’ ๐’’๐’–๐’‚๐’๐’•๐’Š๐’•๐’š ๐’…๐’†๐’Ž๐’‚๐’๐’…๐’†๐’… / % ๐’„๐’‰๐’‚๐’๐’ˆ๐’† ๐’Š๐’ ๐’‘๐’“๐’Š๐’„๐’† ๐‘ฌ๐’‘ = ๐’…๐’’/๐’…๐’‘ ๐’™ ๐’‘/๐’’ Geometric Method It measures price elasticity of demand at different points on the demand curve. It is also called point method of measuring elasticity of demand. ๐‘ฌ๐’‘ = ๐’๐’๐’˜๐’†๐’“ ๐’”๐’†๐’ˆ๐’Ž๐’†๐’๐’• / ๐’–๐’‘๐’‘๐’†๐’“ ๐’”๐’†๐’ˆ๐’Ž๐’†๐’๐’• Relationship between Price Elasticity of Demand and Total Expenditure 1. If rise or fall in own price of a commodity causes no change in total expenditure on the commodity, the elasticity of demand is unitary. 2. If a fall in own price of a commodity causes a rise in total expenditure and a rise in price causes a fall in total expenditure on the commodity, then elasticity of demand is greater than one. 3. If a fall in own price of a commodity causes a fall in total expenditure and a rise in price causes a rise in total expenditure on the commodity, then elasticity of demand is less than one. Total Expenditure in response to a fall in price of the good Elasticity of Demand Constant Unitary Increases Greater than one Decreases Less than one Price (โ‚น) Demand (kg) Total Expenditure(โ‚น) Nature of Elastic
  • 33. pg. 32 10 12 12 9 120 108 Edโ€บ1 10 12 12 10 120 120 Ed=1 10 12 10 9 100 108 Edโ€น1 Degrees of Price Elasticity of Demand 1. Perfectly Elastic (Ed=โˆž) โ€“ It refers to the situation when demand is infinite at the prevailing price. 2. Perfectly Inelastic (Ed=0) โ€“ It refers to a situation when change in price causes no change in the quantity demanded. 3. Unitary Elastic (Ed=1)โ€“ It is a situation when change in quantity demanded in response to change in own price of the commodity is such that total expenditure on the commodity remains same. ๐‘ป๐’๐’•๐’‚๐’ ๐‘ฌ๐’™๐’‘๐’†๐’๐’…๐’Š๐’•๐’–๐’“๐’† = ๐‘ธ๐’–๐’‚๐’๐’•๐’Š๐’•๐’š ๐‘ฉ๐’๐’–๐’ˆ๐’‰๐’• ๐‘ฟ ๐‘ท๐’“๐’Š๐’„e 4. Greater than Unitary Elastic โ€“ Demand is greater than unitary elastic when change in quantity demanded in response to change in price of the commodity is such that total expenditure on the commodity increases when price decreases and total expenditure decreases when price increases. 5. Less than Unitary Elastic โ€“ Demand is less than unitary elastic when change in quantity demanded in response to change in price of the commodity is such that total expenditure on the commodity decreases when price falls and totalexpenditure increases when price rises. Five Degrees of Elasticity of Demand (i) Perfectly Elastic Demand (Ed = โˆž) (ii) Perfectly Inelastic Demand (Ed = 0) (iii) Unitary Elastic Demand (Ed =1) (iv) More Elastic Demand (Ed >1) (v) Less Elastic Demand (Ed <1)
  • 34. pg. 33 Factors Affecting Price Elasticity of Demand 1. Nature of commodity โ€“ Necessities goods like salt, kerosene oil, matchboxes, textbooks, seasonal vegetable, have inelastic demand. Luxurious goods like air- conditioner, fashionable garments have elastic demand. Luxurious Goods Necessities Goods Comfortable goods Elastic Inelastic Moderate elastic 2. Availability of Substitutes โ€“ Demand for goods which have close substitute is more elastic demand. Those have no substitute have inelastic demand (cigarettes and liquor). 3. Diversity of Usesโ€“ Goods that can be put to a variety of uses have elastic demand (milk, electricity). A commodity has only few uses, its demand will be inelastic. Multiple use of goods More elastic Single use Inelastic 4. Price Range โ€“ Goods which are in very range or in very low price range have inelastic demand. But those in the middle range have elastic demand. 5. Consumerโ€™s habits โ€“ If a consumer is a habitual consumption of commodity will have inelastic demand. 6. Time Period
  • 35. pg. 34 Long time Elastic demand Short period goods Inelastic Questions for 1 mark โ€“ 1. What is meant by price elasticity of demand? 2. When is elasticity of demand called unitary? 3. Why is perfectly elastic demand curve parallel toX-axis? 4. Give the formula of price elasticity of demand by percentage method. 5. What is meant by perfectly elastic demand? Questions for 3 or 4 marks โ€“ 1. How is price elasticity of demand effected by โ€“ (i) Number of substitute available for the goods (ii) Nature of the good 2. Define price elasticity of demand. Explain any one method of measuring it. Practical Exercises 1. Suppose the price of milk falls from โ‚น50 per litre to โ‚น45 per litre, what will be the consumerโ€™s price elasticity of demand, if its demand for milk goes up from 4 litres to 6 litres. 2. Price of a goods falls from โ‚น40 to โ‚น32. As a result, its demand rises from 80 units to 100 units. Calculate price elasticity of demand by expenditure method. 3. When price of a commodity falls by โ‚น2 per unit, its quantity demanded increases by 10 units. Its price elasticity is (-)1. Calculate its quantity demanded at the price before change which was โ‚น10 per unit. 4. A consumer buys 80 units of a good at a price of โ‚น10 per unit. Suppose price elasticity of demand is (-)2. At what price will he buy 64 units? Assignment 1. What do you understand by elasticity of demand? 2. Write the formula of price elasticity of demand. 3. What is meant by perfectly elastic demand? 4. Explain geometric method of measuring price elasticity of demand. 5. Give the formula to measure elasticity of demand on a straight line demand curve. 6. When price of a good rises from Rs.40 per unit to Rs.46 per unit, its demand falls by 30 percent. Calculate price elasticity of demand.
  • 36. pg. 35 7. The government in India keeps raising taxes on liquor and cigarettes to rise in price of these goods. But the fall in demand is insignificant. How do you explain this phenomenon? 8. A consumer buys 10 units of a good at a price of Rs.6 per unit. Price elasticity of demand is 1. At what price will he buy 12 units? Use expenditure method. 9. โ€˜Flatter the demand curve, greater the price elasticity of demand. Explain. 10. Explain factors determining price elasticity of demand. 11. Show the different degrees of elasticity of demand with help of a diagram. Work Sheets 1. If two demand curves intersect, which one has higher price elasticity at the point of intersection? Or If two negatively sloped straight line demand curves cross each other, will price elasticity of demand be equal at the point of intersection. Explain. Ans. We know that different demand curves have different elasticities. When two negatively sloped demand curves intersect each other, the flatter demand curve has higher price elasticity at the point of intersection. 2. Whatis the relationship between elasticity of demand and change in expenditure on a good?
  • 37. pg. 36 3. Draw demand curves showing price elasticity of demand equal to (i) zero (ii) infinity and (iii) unity. 4. Why is coefficient of price elasticity of demand negative? Ans โ€“ The coefficient of price elasticity of demand is always negative because there is an inverse relationship between demand and price. Production Function and Returns to a Factor Concept of Production Function Production is a very important economicactivity. The standard of living in the ultimate analysis depends on the volume and variety of goods and services produced in a country. In fact, the performance of an economy is judged by the level of production. In simple, the term production is used for an activity of making something material. The growing of wheat or any other agricultural crop by farmers and manufacturing of cloth, radio- sets, or any other industrial product is often referred to as production. In Economics, by production we mean the process by which man utilizes or converts the resources of nature, working upon them so as to make them satisfy human wants. In other words, production is any economic activity which is directed towards the satisfaction of the wants of the people by converting physical inputs into the physical output. Production function studies the functional relationship between physical inputs and physical output of a commodity. ๐‘ธ๐’™ = ๐’‡(๐‘ณ, ๐‘ฒ) Factors of Production
  • 38. pg. 37 The process of producing goods in the modern economy is very complex. A good has to pass through many stages and many hands until it reaches the consumerโ€™s hands in a finished form. Land, labour, capital, entrepreneurial ability are all the factors or resources which make it possible to produce goods and services. Total Product (TP) It is the sum total of output produced by all the units of a variable factor along with some constant amount of the fixed factors used in the process of production. ๐‘ป๐‘ท = ๐‘ด๐‘ท๐Ÿ + ๐‘ด๐‘ท๐Ÿ + ๐‘ด๐‘ท๐Ÿ‘ + โ€ฆ โ€ฆ . + ๐‘ด๐‘ท๐’ Marginal Product (MP) It is the change in total product per unit change in the quantity of variable factor. In other words, it is the addition made to the totalproduction by an additional unit of output. ๐‘ด๐‘ท๐’ = ๐‘ป๐‘ท๐’ โ€“ ๐‘ป๐‘ท๐’ โˆ’ ๐Ÿ Average Product (AP) It is the total product per unit of the variable factor. ๐‘จ๐‘ท = ๐‘ป๐‘ท ๐‘ณ Table No. 7 Units of Labour Total Product Marginal Product Average Product Result 1 10 10 10 2 40 30 20 3 90 50 30 4 120 30 30 5 130 10 26 6 130 0 21.67 7 120 -10 17.14 -20 0 20 40 60 80 100 120 140 0 2 4 6 8
  • 39. pg. 38 Relationship between AP and MP (i) When AP rises as a result of an increase in the quantity of variable input, MP > AP. (ii) When AP is maximum, MP = AP. (iii) When average product falls as a result of a decrease in the quantity of variable input, MP < AP. Relationship between TP and MP (i) So long as MP is increasing, TP is increasing at increasing rate. (ii) When MP starts diminishing, TP increases only at a diminishing rate. (iii) When MP = 0, there is no addition to TP. (TP is maximum). (iv) When MP is negative, TP starts declining. Law of Variable of Production It states that as more and more of the variable factor is combined with fixed factor (capital), a stage must ultimately come when marginal product of the variable factor starts declining. Three stages of Production (i) Stage 1, when MP is increasing, called the stage of increasing returns โ€“ TPP increases at an increasing rate. (ii) Stage 2, when MP is diminishing, called the stage of diminishing returns (iii) Stage 3, when MP is negative, called the stage of negative returns.
  • 40. pg. 39 Causes of Increasing Return to a Factor (i) Fuller utilization of resources โ€“ When we go towards this optimum, we get increasing returns because with increase in labour, the under-utilized fixed factors like machinery and building are better and more efficiently used. (ii) Increased efficiency of the variable factor โ€“ Specialization resulting from division of labour increases efficiency which helps in getting increasing returns, i.e., MPP goes on rising till it achieves maximum production with given inputs. (iii) Better coordination between the factorsโ€“Among different combination of factors of production, there is one optimum combination which gives maximum production with given resources. Moreover, better coordination among factors results in increasing returns. Causes of Diminishing Return to a Factor (i) Fixity of the factor โ€“ As more and more units of the variable factor are combined with the fixed factor, the latter gets excessively utilized. It suffers greater wear and tear and losses its efficiency. (ii) Imperfect factor substitutability โ€“ Factors of production are imperfect substitutes of each other. More and more of labour cannot be continuously used in place of capital. (iii) Poor coordination between the factors โ€“ Increasing application of the variable factor. Assignment 1. What is meant by inputs? 2. What is meant by output? 3. What is the general shape of MP? 4. Can there be fixed cost of a firm in the long run? 5. What is production function? 6. Explain relationship between AP and MP. 7. Distinguish between fixed factors and variable factors. 8. Explain the concepts of total product, average product and marginalproduct. 9. Explain law of variable factors in detail. Application based questions 1. Calculate AP and MP from the following schedule -
  • 41. pg. 40 Units of Labour 1 2 3 4 5 6 Total Product 20 30 36 38 38 36 2. Calculate TP and MP from the following schedule - Units 1 2 3 4 5 6 AP 50 55 50 45 36 25 3. Explain three stages of production when one factorinput is variable. Use diagram and schedule. 4. Explain reasons for increasing returns to a factor. 5. The following table gives APP of a factor. It is also known that the TPP at zero level of employment is zero. Determine TPP and MPP schedules - Level of employment 1 2 3 4 5 6 APP 50 48 45 42 39 35 6. Output of food grain in India at one stage was less than its domestic demand. Now it is not. Does it mean that the law of diminishing returns has failed in Indian agriculture?
  • 42. pg. 41 Concept of Cost Cost analysis refers to the study of the behavior of cost in relation toone or more production criteria, namely, size of output, scale of operations, prices of factors of production and other relevant economic variables. Thus, cost refers to the expenditure incurred by a producer on the factor as well as non-factor inputs for a given amount of output of a commodity. Explicit Cost Implicit Cost Expenditure incurred by the producer on the purchase of inputs from the market is called Explicit Cost while estimated expenditure on the use of self-owned inputs is called Implicit Cost. Accounting Cost โ€“ When an entrepreneur undertakes an act of production he has to pay prices of the factors which he employs for production. He thus pays, wages to workers employed, prices for the raw materials, fuel and power used, rent for building he hires and interest on the money borrowed for doing business. All these are included in his cost of production are termed as accounting costs. Thus accounting costs take care of all the payments and charges made by the entrepreneur tothe suppliers of various productive factors. Economic Costs โ€“ Economic cost include (i) the normal return on money capital invested by the entrepreneur himself in his own business, (ii) the wages or salary not paid to the entrepreneur but could not have been earned if the services had been sold somewhere else. Likewise the monetary reward for all factors owned by the entrepreneurhimself and employed by him in his own business are also considered a part of economic cost.
  • 43. pg. 42 Outlay Costs โ€“ They involve actual expenditure of funds on wages, material, rent, interest etc. Cost Function The cost function refers to the mathematical relation between cost of product and the various determinants of cost. ShortRun Costs There are some factors which can be easily adjusted with changes in the level of output. Thus a firm readily employ more workers if it has to increase output. There is two types of cost. 1. Fixed Costs โ€“ These are sum total of expenditure incurred by the producer on the purchase or hiring of fixed factors of production. These are also called supplementary costs, overhead costs or indirect costs. These costs do not change with change in output. For example, rent, wages of permanent employees, license fees etc. 2. Variable Costs โ€“ These costs are the expenditure incurred by the producer on the use of variable factors of production. These are also called Prime Costs or Direct Costs. These costs change on with change in output. For example, purchase of raw material, wages of causal labour, expense electricity, wear and tear expenses etc. Total Cost = Fixed Cost + Variable Cost Total Cost โ€“ It is sum total of total fixed costs and total variable costs. ๐‘ป๐‘ช = ๐‘ป๐‘ญ๐‘ช + ๐‘ป๐‘ฝ๐‘ช Average Fixed Cost โ€“ AFC is the total fixed cost is divided by the number of units of output produced.The shape of AFC is rectangular hyperbola. ๐‘จ๐‘ญ๐‘ช = ๐‘ป๐‘ญ๐‘ช/๐‘ธ Average Variable Cost โ€“ AVC is the total variable cost is divided by the number of units of output produced.AVC = ๐‘ป๐‘ฝ๐‘ช/๐‘ธ Average Total Cost โ€“ ATC is the total cost is divided by the numberof units of output produced. ๐‘จ๐‘ป๐‘ช = ๐‘จ๐‘ญ๐‘ช + ๐‘จ๐‘ฝ๐‘ช Marginal Cost โ€“ It the addition to total cost due to addition of one unit of output. ๐‘ด๐‘ช๐’ = ๐‘ป๐‘ช๐’ โˆ’ ๐‘ป๐‘ช๐’ โˆ’ ๐Ÿ ๐‘ด๐‘ช๐’ = ๐‘ป๐‘ฝ๐‘ช๐’ โˆ’ ๐‘ป๐‘ฝ๐’„๐’ โˆ’ ๐Ÿ
  • 44. pg. 43 Output (Units) TFC TVC TC AFC AVC ATC MC 0 10 0 10 - - - - 1 10 10 20 10 10 20 10 2 10 18 28 5 9 14 8 3 10 24 34 3.33 8 11.33 6 4 10 28 38 2.50 7 9.50 4 5 10 32 42 2 6.40 8.40 4 6 10 38 48 1.66 6.33 7.99 6 7 10 46 56 1.42 6.57 7.99 8 8 10 56 66 1.25 7 8.25 10 MC is U- shaped MC is U-shaped in accordance with the law of variable proportions. Falling MC is in accordance with rising MP when there are increasing returns to a factor. Rising MC is in accordance with falling MP when there are diminishing returns to a factor. Relation between AC and MC (i) When AC falls, MC<AC. (ii) When AC rises, MC >AC. (iii) When AC does not change, MC = AC. (iv) MC cuts AC at its lowest point. 0 10 20 30 40 50 60 70 0 1 2 3 4 5 6 7 8 9 cost output
  • 45. pg. 44 Relation between TC and MC (i) MC is estimated as the difference between total costof two successive units of output. (ii) When MC is diminishing TC increases at a diminishing rate. (iii) When MC is rising, TC increases at an increasing rate. (iv) When MC reaches its lowest point, TC stops increasing at a decreasing rate. Rising Portion of MC Curve is the Supply Curve ๏ต In the figure, MC is U-shaped and P1 is the price line under perfect competition. At price P1 , the price line cuts MC curve at two points โ€“ at Q1 aand Q1 b , i.e., it satisfies profit maximizing condition P =MC at two places. But total profit at output level of Q1 b is higher. Therefore, at price P1, the firm produces the amount Q1 b. It means that if price is OP1 , the firm will supply Q1 b level of output. Similarly if price is OP2, the firm would supply OQ2 level of output and at price OP3, it would supply OQ3 level of output and so on. We see clearly that all price-output combinations are simply the points on the rising portion of MC curve. Hence, it is concluded that the rising portion of MC curve is the supply curve.
  • 46. pg. 45 Assignment for Concept of Cost 1. What is variable cost? 2. What is meant by average cost? 3. What are selling cost? 4. What is the general shape of MC? 5. Explain the relationship between MC and AC. 6. Draw total variable cost, total cost and total fixed cost curves in a single diagram. 7. Complete the following table- Outputs (Units) Average Cost (โ‚น) Marginal Cost (โ‚น) 1 12 ----- 2 10 ------ 3 ----- 10 4 10.5 ----- 5 11 ------ 6 ----- 17 8. Give two example of fixed cost. 9. What are the difference between variable costs and fixed costs? 10. A firmโ€™s fixed cost is โ‚น2000. Compare TVC, AVC, TC, and ATC โ€“ Output (units) 1 2 3 4 5 6 7 Marginal Cost 2000 1500 1200 1500 2000 2700 3500 11. Classify the following into fixed and variable cost โ€“ (i) Rent for a shed (ii) Minimum telephone bill (iii) Cost of raw materials
  • 47. pg. 46 (iv) Wages of permanent staff (v) Interest on capital Concept of Revenue By selling a commodity whatever money a firm receives is called its revenue. For example, a firm produces 500 shirts daily and sells these shirts at the price โ‚น200 per shirt, then revenue of the firm is โ‚น100,000. ๐‘น๐’†๐’๐’†๐’๐’–๐’† = ๐‘ช๐’๐’”๐’•๐’” + ๐‘ท๐’“๐’๐’‡๐’Š๐’•๐’” Total Revenue (TR) โ€“ total receipts of a firm from the sale of a given output is called total revenue. ๐‘ป๐’๐’•๐’‚๐’ ๐‘น๐’†๐’—๐’†๐’๐’–๐’† = ๐‘ถ๐’–๐’•๐’‘๐’–๐’• ๐‘ฟ ๐‘ท๐’“๐’Š๐’„๐’† Marginal Revenue โ€“ It is the change in total revenue which results from the sale of one more unit of a commodity. ๐‘ด๐‘น = ๐‘ป๐‘น๐’ โˆ’ ๐‘ป๐‘น๐’ โˆ’ ๐Ÿ ๐‘ด๐‘น = โˆ†๐‘ป๐‘น/โˆ†๐‘ธ Average Revenue โ€“ It refers to revenue per unit of output sold. ๐‘จ๐‘น = ๐‘ป๐‘น ๐‘ธ
  • 48. pg. 47 Output (units) AR TR MR 1 10 10 10 2 9 18 8 3 8 24 6 4 7 28 4 5 6 30 2 6 5 30 0 7 4 28 -2 8 3 24 -4 Relation between MR and TR (i) MR can be zero or even negative, but only when price is declining as under monopoly or monopolistic competition. (ii) TR stops increasing when MR = 0, so that TR is maximum when MR = 0. (iii) TR starts declining when MR is negative. (iv) When MR is declining, less and less is added to TR for every additional unit sold. Accordingly TR increases only at a diminishing rate. Relationship between TR and MR under Perfect Competition In perfect competition, a firm is a price taker. It can sell as many units of its product at the price given by the industry. Here price (AR) is constant and therefore, MR is also constant because when an additional unit is sold, the addition made to total revenue, i.e., MR will be equal to price (AR). ๐‘ท๐’“๐’Š๐’„๐’† = ๐‘จ๐‘น = ๐‘ด๐‘น Units sold TR MR AR 1 20 20 20 2 40 20 20 -10 -5 0 5 10 15 20 25 30 35 0 1 2 3 4 5 6 7 8 9
  • 49. pg. 48 3 60 20 20 4 80 20 20 Relationship between TR & MR 1. TR increases at a constant rate since price is constant and MR is also constant. This implies that TR increases at constant rate. 2. AR = Price = MR, therefore AR, MR curves take the shape of straight line parallel to x- axis. 3. Since TR increases at a constant rate, MR is also constant throughout. What happen when AR Changes Units sold TR MR AR 1 20 20 20 2 36 16 18 3 48 12 16 4 56 8 14 5 60 4 12 6 60 0 10 7 56 -4 8 0 10 20 30 40 50 60 70 80 90 0 0.5 1 1.5 2 2.5 3 3.5 4 4.5 AR/MR/TR OUTPUT
  • 50. pg. 49 Firms Revenue Curve in Different Markets 1. Revenue curve under Perfectly Competitive Markets โ€“ Under perfect competition, a firm is a price taker. It cannot influence the market price. It can sell any number of units of output at the prevailing price. Firmโ€™s price line or revenue curve under perfect competition is a horizontal straight line. AR and MR coincidence with each other. 2. Revenue Curve under Monopoly โ€“ Under monopoly, AR and MR curve slope downward from left to right. It m eans that if a monopolist desires to sell more, he has to reduce price of the product. -10 0 10 20 30 40 50 60 70 0 1 2 3 4 5 6 7 8
  • 51. pg. 50 3. Revenue Curves under Monopolistic Marketsโ€“Under monopolistic competition, there is inverse relationship between AR and output. Accordingly, AR and MR curves slope download. The difference between monopoly and monopolistic is that under monopolistic competition, AR and MR curves are more elastic. Assignment for Concept of Revenue 1. What do you mean by revenue? 2. Define marginal revenue. 3. Explain relationship between average revenue and marginalrevenue under perfect competition. 4. How do change in marginal revenue affect total revenue? 5. Describe relationship between TR and MR under perfect completion. Use diagram. Or What is behavior of MR in a market in which a firm can sell any quantity of output at a given price? 6. What is the shape of TR curve under monopoly? 7. Why is AR always equal to MR for a competitive firm? 8. Complete the following table when each unit of commodity can be sold at โ‚น12. Quantity sold 1 2 3 4 5 6 7 8 TR MR AR 9. Complete the following table โ€“ Output AR MR TR 1 ____ 10 ___ 2 9 ____ ____ 3 ____ ____ 24 4 _____ 4 ____
  • 52. pg. 51 Producerโ€™s Equilibrium Producerโ€™s Equilibrium โ€“ It refers to a situation of profit maximization. ๐… = ๐‘ป๐‘น โˆ’ ๐‘ป๐‘ช Producerโ€™s equilibrium is struck as that level of output where profit is maximized. We know, ๐‘ป๐‘ช = ๐‘ป๐‘ฝ๐‘ช + ๐‘ป๐‘ญ๐‘ช Gross Profit = TR โ€“ TVC Net Profit = TR - (TVC +TFC) Concept of Profit (i) Abnormal profit or extra-normal profits, when TR > TC Or, AR > AC (ii) Normal profit, when TR = TC Or, AR = AC (iii) Sub-normal profits, when TR < TC Or, AR < AC Conditions of Producerโ€™s Equilibrium (i) MR = MC and (ii) MC is rising Output MR TR MC TC ฯ€ 1 20 20 15 15 5 2 20 40 20 35 5 3 20 60 18 53 7 4 20 80 16 69 11 5 20 100 14 83 17 6 20 120 12 95 25 7 20 140 15 110 30 8 20 160 19 129 31 9 20 180 20 149 31 10 20 200 22 171 29
  • 53. pg. 52 Firmโ€™s Equilibrium when AR is not constant When price is not constant, a firm can generally sell more of a commodity by lowering its price. AR & MR slopes downward and MR slopes at a faster than AR. In such a situation, equilibrium of a firm is struck when two conditions are satisfied โ€“ (i) MR = MC (ii) MC is rising. Assignment for Producerโ€™s Equilibrium 1. What is meant by producerโ€™s equilibrium? 2. Explain conditions of producerโ€™s equilibrium under MR and MC approach? 3. Explain producerโ€™s equilibrium in terms of TC and TR. Use diagram. 4. What are net profits? 5. Define sub-normal profit? 0 5 10 15 20 25 30 0 2 4 6 8 10
  • 54. pg. 53 6. What are extra-normal profits? 7. Define normal profit. 8. Explain what happens to the profits if output level is beyond the equilibrium level. Application and Value Based Questions 1. Normal profit is a part of total cost. Is it true? 2. Why equilibrium is not struck when MRโ€บ MC? 3. Should production be discontinued when AR = AVC? 4. Do you think it is a rational for a producer to strike equilibrium when MC is rising, not when it is falling? 5. Find the equilibrium of a producer from the following table showing AR and AC of a competitive firm โ€“ Output 1 2 3 4 5 AR 13 12 10 9 8 AC 7 8 10 11 12 6. Given below is a cost and revenue schedule of a producer. At what level of output the producer is in equilibrium? Give reasons for your answer. Output 1 2 3 4 5 6 7 Price 10 10 10 10 10 10 10 TC 10 22 30 38 47 57 71
  • 55. pg. 54 Theory of Supply The term supply refers the amount of a good or service that the producers are willing and able to offer to the market at the various prices during a period of time. Quantity supplied refers to specific amount offered for sale at a specific price of the commodity. Supply Schedule Supply schedule is a schedule showing various quantities of a commodity offered for sale corresponding todifferent possible prices of the commodity. It has two aspects โ€“ a. Individual Supply Schedule (ISS) โ€“ It shows different quantities supplied by affirm at different prices of a commodity. b. Market Supply Schedule (MSS) โ€“It refers to supply of all the firms in the market producing a particularcommodity. Table No. - Supply Schedule Price Supply by firm A Supply by firm B Market Supply A + B 10 10 20 30 20 20 30 50 30 30 40 70 40 40 50 90 Supply Curve It is the graphic presentation of supply schedule, showing various quantities of a commodity offered for sale at different possible prices of that commodity. a. Individual Supply Curveโ€“Individual supply schedule states the quantities of a commodity that a producerwould offer for sale at various prices. 0 20 40 60 80 100 0 10 20 30 40 50
  • 56. pg. 55 b. Market Supply Curve โ€“ A market supply schedule for a given commodity is the sum of individual supply schedules of all those firms which are engaged in the production of a given commodity during a given time. Determinants of Supply or Supply Function It studies the functional relationship between supply of a commodity and its various determinants. ๐‘บ๐’™ = ๐’‡ (๐‘ท๐’™, ๐‘ท๐’“, ๐‘ต๐’‡, ๐‘ฎ, ๐‘ท๐’‡, ๐‘ป, ๐‘ฌ๐’™, ๐‘ฎ๐’‘) Where Sx = supply of the commodity 1. Px = price of the commodity-Xโ€“The most important determinant of supply of a commodity is its price. Higher the price of a commodity, the producers will produce more quantities for sale in the market. There is direct relationship between price and quantity supplied. This is also known as law of supply. 2. Pr = price of the related goods โ€“ Supply of a commodity also depends upon the prices of the related goods especially substitute goods. If the price of substitute goods goes up, producers will be tempted to produce the substitute goods. For example, if the price of wheat goes up the land be put under cultivation of wheat. 3. Nf = number of the firms - 4. G = goal of the firm โ€“ Generally every firm tries to get maximum profit. But at times, individual producers may be induced to increase the supply of a commodity not because it brings in more profits for them, but because its supply in the market is a source of status and prestige in the market. 5. Pf = price of factors of production โ€“ Prices of the factors of production used in the production of a commodity constitute the cost of production of this commodity. If the prices of these factors go up, its total cost of production may rise. In such a situation , the producers may divert theirresources to the production of some other commodity, which can be produced at a lower cost. As a result, the supply of this commodity will decrease. 6. T = state of technology โ€“ Over time, technical knowledge changes. Discoveries and innovations help raise the productivity of the factors and thus contribute to the raising of the supply upwards. 7. Ex = business confidence 8. Gp = government policy โ‚นโ‚นโ‚น Law of Supply
  • 57. pg. 56 The law of supply states that other things remaining same, the quantity of a good produced and offered for sale will increase as the price of the good rises and decreases as the price falls. Prices (โ‚น) Quantity Supplied 50 40 30 20 10 50 40 30 20 10 Assumption of Law of Supply (i) There is no change in the price in the price of the factors of production. (ii) There is no change in the technique of production. (iii) There is no change in the goal of the firm. (iv) There is no change in the price of the related goods. (v) There is no change in business confidence. Exception to the Law of Supply (i) It does not apply on agricultural products whose supply is governed by natural factors. (ii) Supply of goods having social distinction will remain limited even if their price tends to rise. (iii) At a given point of time, sellers may be willing to sell more of a perishable commodity even at a lower price.
  • 58. pg. 57 Movements along a Supply Curve Due to movement of supply curve, there is extension and contraction of supply curve. When the supply of a good rises due to rise in the price of the good alone, it is termed as extension of supply. When supply of a good falls due to fall in its price, it is called contraction of supply. Shift in Supply Curve Shifts in supply curve refers to situations of increase or decrease in supply when own price of the commodity remains constant. When at the given price, the supply of a good increases, it is termed as increase in supply. When at the given price, the supply of a good decreases, it is termed as decrease in supply. Causes of Shifts in Supply Curve (i) Improvement in technology/outdated technology causes shifts in supply curve. (ii) Changes in factor prices (iii) Changes in the price of a competing product (iv) Change in the number of firms (v) Changes in taxation policy. Price Elasticity of Supply The price elasticity of supply is the measure of change in quantity supplied of a commodity due to change in its price. i.e. ๐‘ฌ๐’‘ = ๐’‘๐’†๐’“๐’„๐’†๐’๐’•๐’‚๐’ˆ๐’† ๐’„๐’‰๐’‚๐’๐’ˆ๐’† ๐’Š๐’ ๐’’๐’–๐’‚๐’๐’•๐’Š๐’•๐’š ๐’”๐’–๐’‘๐’‘๐’๐’Š๐’†๐’…/ ๐’‘๐’†๐’“๐’„๐’†๐’๐’•๐’‚๐’ˆ๐’† ๐’„๐’‰๐’‚๐’๐’ˆ๐’† ๐’Š๐’ ๐’‘๐’“๐’Š๐’„๐’† ๐‘ฌ๐’‘ = ๐’…๐’’/๐’…๐’‘ ๐‘ฟ ๐’‘/๐’’ Types of Price Elasticity of Supply A. Perfectly Inelastic Supply โ€“ If as a result of change in price, the quantity supplied of a good remains unchanged, we say that the elasticity of supply is zero or the good has perfectly inelastic supply. The vertical supply curve shows that irrespective of the price change, the quantity supplied remains unchanged. B. Relatively less-elastic Supply โ€“ If as a result of a change in the price of a good its supply changes less proportionately, we say that the good is relatively less elastic. C. Relatively greater-elastic Supply โ€“ If elasticity of supply is greater than one i.e., when the quantity supplied of a good changes substantially in response to a small change in the price of the good. D. Unit-elastic โ€“ If the relative change in the quantity supplied is exactly equal to the relative change in price, the supply is said to be unitary elastic.
  • 59. pg. 58 E. Perfectly Elastic Supply โ€“ The supply elasticity is infinite when nothing is supplied at a lower price but a small increase in price causes supply to rise from zero to an indefinitely large amount indicating that producers will supply any quantity demanded at that price. Factors affecting Price Elasticity of Supply Following factors affect the elasticity of supply of a commodity โ€“ (i) Nature of inputs used โ€“ The elasticity of supply depends on the nature of inputs used for the production of a commodity. Easily available inputs will be elastic, and scarcely available will be inelastic. (ii) Nature of the commodity โ€“ Perishable goods are relatively less elastic in supply than durable goods. (iii) Time factor โ€“ Longer the time period, greater will be the elasticity of supply. (iv) Technique of production โ€“ Less elastic in case of a commodity involves the use of complex and expensive technology. Assignment for Supply 1. Define supply. 2. What is supply function? 3. What will be the shape of a perfectly inelastic supply curve? 4. What will be the shape of a perfectly elastic supply curve? 5. Write formula price elasticity of supply. 6. State law of supply. 7. Explain effect of the change in technology on the supply of a good. 8. Explain the effect of rise in input prices on the supply of a good. 9. Government imposes a tax on production of a good. Explain its effect on supply of that good. 10. What is elasticity of supply? How is it measured? 11. Use diagram and schedule to distinguish increase in supply and decrease in supply. 12. Distinguish between movement of supply curve and shift in supply curve. 13. At a price of โ‚น12 per unit, the quantity supplied of a commodity is 200 units. Its price elasticity of supply is 1.5. If its price rises to โ‚น16 per unit, calculate its quantity supplied at new price. 14. The supply of a commodity at a price of โ‚น20 is 50 units. A 10% rise in its price results in a 15% rise in its supply. Calculate its price elasticity of supply. 15. The quantity supplied of a commodity at a price of โ‚น8 per unit is 400 units. Its price elasticity of supply is 2. Calculate the price at which price its quantity supplied will be 600 units.
  • 60. pg. 59 Forms of Market Market is the life-line of modern economic life. It is the medium to bring together the sellers and buyers. Market may be defined as the entire area in which buyers and sellers are in contact with each other for the purchase and sale of the commodity. In other words, market is a mechanism that facilitates contact the buyers and sellers for the sale and purchase of goods and services. Forms of markets A. Perfect Competition B. Monopoly C. Monopolistic Competition D. Oligopoly Perfect Competition It is a form of the market where there is a large number of buyers and sellers of a commodity. Homogeneous product is sold with no control overprice by an individual firm. Features of Perfect Competition i. Large number of buyers and sellers โ€“Thereare a large number of buyers and sellers who compete among themselves and their number is so large that no buyer or seller is in a position to influence the demand orsupply in the market. ii. Homogeneous Product โ€“ All the firms sell identical product. The commodity is dealt in homogeneous product i.e., identical product in colour, size, shape or quality. iii. Free Entry and Exit of the firm โ€“ Everyfirm is free to enter the market or to go out of it. In long run, any firm will enter if there are extra normal profit or exit the industry if there are sub normal profit (loss). iv. Perfect Knowledge of the Market โ€“There is a perfect knowledge of the market.Both of buyers and sellers know that the uniform price prevails for a homogeneous product. v. Perfect Mobility โ€“ There is perfect mobility of the factors of production within the market, which ensures uniform cost of production in whole economy. They can move to the industry which offers them maximum. vi. No Transportation Cost โ€“ There is no transportation cost, as there is uniform price which prevails in the economy and thus producers prefer to sell in nearby areas and buyers prefer to buy from nearest places.
  • 61. pg. 60 Vital Component of Perfect Competition (1) Demand Curve under Perfect Competition โ€“ Under this market, the numberof the firms producing homogeneous product is so large that a single firm cannot influence the price as market supply remains unaffected, even if a few firms change the supply of the product. (2) A Firm is a Price Taker โ€“ A firm is price taker and not a price maker. Price in perfect competition is determined by the industry and all the firms in the industry sell their output at the given price, determined by the industry. Monopoly โ€˜Monoโ€™ means single and โ€˜polyโ€™ means to control. Thus, monopoly is a situation in which there is single seller of a product which has no close substitute. Pure monopoly is never found in practice. However, in public utilities such as transport, water and electricity, we generally find monopoly form of market. Features of Monopoly Market (i) Single Seller in the Market โ€“ There is only one firm producing/ supplying a product. This single firm constitutes the industry and as such there is no distinction between the firm and the industry in a monopolistic market. (ii) There is restriction to entry of the new firm. The restriction to entry could be economic, institutional, legal or artificial. (iii) No Close Substitute โ€“ It sells a product which has no close substitutes. As there are no close substitutes, a monopolist does not face any competition. (iv) Price Discrimination โ€“ As monopolist is a price maker, he sometimes charges different prices from different consumers in different market areas. This is known as Price Discrimination. For example, electricity tariff is different for commercial use as compared to domestic use. (v) Full control over Price โ€“ Monopolist is price maker and can fix whatever price he wishes to fix for his product. (vi) Slopes of AR and MR Curves โ€“ Although monopolist has full control over price and supply of the product, yet he faces negative market demand curve, which
  • 62. pg. 61 is a constraint for him. Market demand gives inverse relation between price and demand of the commodity. So, in orderto sell more units of the commodity, he has to reduce the price of the product. Table No. โ€“ Average Revenue, Total Revenue and Marginal Revenue in Monopoly Quantity sold AR TR MR 0 10 0 0 1 9 9 9 2 8 16 7 3 7 21 5 4 6 24 3 5 5 25 1 6 4 24 -1 7 3 21 -3 Monopolistic Competition Consider the market of soaps. Well-known brands on sale are lux, Dettol, liril, pears, lifebuoy plus, dove and so many others. Is this market an example of perfect competition? Since all soaps are almost similar, this appears to be an example of perfect competition. But on close inspection we find that each seller has at least some variation between his product and those of its competitors.This type of market shows monopolisticcompetition. Thus monopolistic market is a form of the market there are many sellers of the product, but the product is little be different from that of the other. Features of Monopolistic Competition (i) A Large of firms - There are a large number of sellers who individually have a small share in the market. As a result, firms are in a position to influence marginally the -10 0 10 20 30 40 0 2 4 6 8 10 revenue quantity sold
  • 63. pg. 62 price of their product due to their names. For instance, among soaps of different brands, Dettol, Liril, Godrej No. 1 etc. (ii) Product Differentiation โ€“ The products of different sellers are differentiated on the basis of brands. They can be differentiated from each other on the basis of brand name, shape, colour, quality, type of service and workmanship etc. (iii) Free Entry and Exit of Firms โ€“ New firms are free to enter into the market and existing firms are free to quit it. (iv) Selling Costs โ€“ Sellers try to compete on the basis other than price, as for example aggressive advertising, product development, better distribution arrangements, efficient after-sale service and so on. Causes of Emergence of Monopoly A monopoly structure arise in any of the following ways โ€“ (i) Government Licensing/Government Control โ€“ The government may grant license for production of particular commodity only to one another leading to monopoly. Licensing is used to ensure minimum standards of competency. For example โ€“ Indian Railway. (ii) Patent Rights โ€“ Patent rights entitle the owner an exclusive right to a production process. New products may secure patent rights which prohibit others from using the shape, design or other features of the product, thus creating a monopoly. (iii) Cartels โ€“ It is a large number of firms which have explicitly agreed to work together. This is done to avoid competition and secure monopoly control of the market. For example โ€“ OPEC ( Organization of Petroleum Exporting Countries) (iv) Control of Resources โ€“ Monopoly sometimes occurs due to substantial control over certain resources required in the production. For example DeBeercompany of South Africa controls about 80% of the worldโ€™s production of diamond. Oligopoly The word โ€œOligopolyโ€ derived from two Greek โ€œOligosโ€ which means few and โ€œPollenโ€™ which means to sell. Thus, oligopoly is a form of market in which there are a few big sellers of a commodity and a large number of buyers. Each seller has a significant share of the market. For example, Tata, Ford etc. In oligopoly, sellers produce homogeneous goods or the close substitute but not perfect substitutes of one another. Features of Oligopoly (i) A few Firms โ€“ There are a few sellers of the commodity and each produces a substantial portion of total output of the industry. The numberof the firms is so small that each seller knows that he can influence the output and profit of rival
  • 64. pg. 63 firms whose reaction may prove counterproductive. This makes the firms mutually dependent on each otherin case of decisions about price and output. For example, there is interdependence of decision about price between Pepsi and Coca Cola. If Pepsi reduces price, Coca Cola may do the same substantially. (ii) Importance of advertising and selling costs โ€“ Heavy selling and advertisement costs are incurred to attract customers. (iii) Group behavior โ€“ Interdependence of firms compels them to act in mutual cooperation. Thus, group behavior in the form of collective decisions and mutual cooperation by the firm is very common. (iv) Barriers to entry of new firms โ€“ The barriers are โ€“ ๏ƒผ Patents โ€“ the patent holder may give license to only a few firms. ๏ƒผ Requirement of Huge Capital โ€“ Since huge investment is required , it may not be very easy to arrange funds for new firms on the basis of their worthiness. ๏ƒผ Control over Resources โ€“ Ability and availability of strategic raw materials and other inputs may be restricted tofew firms. (v) Indeterminate demand Curve โ€“ Under oligopoly, there is no certainty in the behavior pattern of the producer. So demand curve faced by an oligopolistic market is undetermined. Any change in price by one producer may or may not lead to change in prices by the rival firms. Therefore, the demand curve is not definite i.e., it is undetermined. (vi) Selling Costs โ€“ Due to cut throat competition and interdependence among the firms, various sales promotion are used. Firms in oligopoly spend on persuasive advertisement and other promotion schemes in order to increase the volume of sales. Types of Oligopoly A. Collusive or Cooperative Oligopoly โ€“ It is a form of the market in which there are few firms in the market and all agree to avoid competition through a formal agreement. They cooperate with each other, in determining price or output or both. B. Non-Collusive or Non-Cooperative Oligopoly โ€“ It is a form of the market in which there are few firms in the market and each firm follows its price and output policy independent of the rival firms. The firms compete with each other and there is cut throat competition. Each firm tries to increase its market share through competition. Comparative Study of All Markets Perfect Competition Monopoly Monopolistic Oligopoly
  • 65. pg. 64 Competition Very large number of buyers and sellers Single seller Large number of firms A few firms Homogeneous product Product without substitute Differentiated product Homogeneous and differentiated product Free entry and exit of the firm Very difficult entry of new firm Free entry and exit of the firm Difficult entry of new firms Perfect knowledge Price discrimination Selling cost Selling costs Demand curve parallel to X-axis Demand curve slopes downward Demand curve slopes downward AR, MR curves downward sloping No control over price Great control of price Some control over price Price rigidity Perfect mobility Important points to Remember ๏ƒ˜ Patent Rights โ€“ Patent rights entitle the owner an exclusive right to a production process. New products may secure patent rights which prohibit others from using the shape, design or other characteristics of the product, thus creating monopoly. ๏ƒ˜ Cartels โ€“ It is a large number of firms which have explicitly agreed to work together. This is done to avoid competition and secure monopoly control of the market. Question Multiple Choice Questions 1. No selling costs are required in - (a) monopoly (b) monopolistic competition (c) perfect competition (d) oligopoly 2. AR & MR curves are downward sloping in - (a) monopoly (b) monopolistic competition (c) both (d) none 3. AR curve coincides with MR curve in - (a) monopoly (b) monopolistic competition (c) perfect competition (d) oligopoly 4. Examples of goods produced in a monopolistic form of market (a) samsang T.V. (b) Tata tea (c) LG refrigerator (d) all of these
  • 66. pg. 65 5. In Middle East, a group of oil companies by forming a cartel jointly decide output and prices of oil. This is an example of โ€“ (a) collusive oligopoly (b) monopolistic competition (c) duopoly (d) imperfect oligopoly Very short answer questions of one mark each 1. Name the market structure in which firm is itself an industry. 2. What is meant by monopolistic competition? 3. What is a cartel? 4. Draw AR and MR curves of a firm in a single diagram under monopolisticcompetition. 5. Define patent rights. 6. What is imperfect oligopoly? 7. Draw the demand curve of a firm under monopoly. 8. Name the market structure in which firm is itself an industry. Higher Order Thinking Skills 1. Explain product differentiation. 2. Draw the AR curve of a firm under (i) monopoly and (ii) perfect competition. Explain the differences in these curves, if any. 3. Explain selling cost under monopolisticcompetition. 4. Explain the demand curve facing a firm under monopolistic competition is negatively sloped? Value Based Questions 1. The government has granted license of production of a particular commodity to one production unit leading to emergence of monopoly. Though monopoly leads to concentration of power in few hands as per conventionalbelief, how in your opinion monopoly is good for us? 2. Firms under monopolistic competition spend huge amount on advertisement. It is felt desirable by the firms to make people aware of the new products available and also to create brand image in the mind of consumers. Is it justified? Conceptual Questions โ€“ 1. Define market. 2. What are the basis for classifying a market? 3. What are the features of perfect competition?
  • 67. pg. 66 4. Explain product differentiation. 5. Explain the feature โ€˜large number of buyers and sellersโ€™ of a perfectly competitive market. 6. Explain the concept of selling cost under monopolistic competition. 7. Explain why the demand curve facing a firm under monopolistic competition is negatively sloped? 8. List the different ways in which oligopoly firms may behave. 9. When a firm is called โ€˜price takerโ€™? 10. Differentiate between pure competition and perfect competition. Value Based Questions 1. The government has granted license of production of a particular commodity to one production unit leading to emergence of monopoly. Though monopoly leads to concentration of power in few hands as per conventionalbelief, how in your opinion monopoly is good for us? 2. Firms under monopolistic competition spend huge amount on advertisement. It is felt desirable by the firms to make people aware of the new products available and also to create brand image in the mind of consumers. Is it justified?
  • 68. pg. 67 Market Equilibriumunder Perfect Competition Introduction Prices of goods express their exchange value. These are also used for expressing the value of various services rendered by different factors of production such as land, labour, capital and organization. These values respectively are rent, wage, interest and profit. Therefore the concept of price, especially the process of price determination, is the vital importance in economics. Generally price is the interaction between demand and supply that determines the price but sometimes Government intervenes and determine the price either fully or partially. Meaning of Equilibrium Equilibrium, in general terms implies (a) a balance between the opposite forces and (b) a state of rest or a situation that has a tendency topersist. Let us take examples to show the application of these meanings in microeconomics. Let us take a market situation in which buyers and sellers are negotiating to buy and sell a good. Both have different prices to offer. But the good will be sold only when both agree to a common price and a common quantity at htat price. If both agree, a market equilibrium is said to emerge. As we know that buyers and sellers have opposite interests. The buyers will like to pay as low a price as possible. The sellers will like to charge as high a price as possible. Agreement on a common price and quantity creates a balance between the two opposite interests. This equilibrium price and quantity has a tendency to persist. Equilibrium Price Equilibrium price is the price at which the sellers of a good are willing to sell the same quantity which buyers of that good are willing to buy. We can explain with help of market demand and supply schedule of a good, which are given below โ€“ Determination of Prices
  • 69. pg. 68 Market equilibrium is a situation of the market in which demand for a commodity is exactly equal to its supply, corresponding toa particular price. ๐‘ซ๐’™ = ๐‘บ๐’™ Equilibrium price which corresponds to the equality between market demand and market supply of a commodity. Equilibrium quantity which corresponds to the equilibrium price in the market. Prices of Commodity Demand Supply 10 60 20 Excess Demand 20 50 30 30 40 40 Equilibrium 40 30 50 Excess supply 50 20 60 Excess demand - Excess demand means more of commodity demanded and less supply of that commodity. Excess supply โ€“ Excess supply means more of a commodity supplied and less demand for that commodity in the market. Assumptions of Equilibrium (i) Demand curve should always have negative slope. (ii) Supply curve should always have positive slope. (iii) If the demand increases more than the supply, the price will increase and if the supply increases more than the demand, the price will fall.
  • 70. pg. 69 Effect of shift in Demand and Supply on Market Equilibrium Market equilibrium struck when free play of demand and supply set up. There are two effect on shift in demand and supply โ€“ Effect of Shift in Demand Shift in demand refers to increase in demand or decrease in demand. It occurs owing to change in determinants of demand, other than own price of the commodity. Observations increase in demand Observations in Decrease in demand (a) DD is the initial demand curve, crossing supply curve at point E, point of initial equilibrium. (b) Owing to increase in demand, demand curve shifts to the right from DD TO D1D1. At the existing price, quantity demanded rises from point E to point E1. (a) DD is the initial demand curve, crossing supply curve at point E, point of equilibrium. (b) Owing to decrease in demand curve shift to the left from DD to D2D2. And at the existing price quantity demanded falls from point E to point E2. Effect of shift in supply Shift in supply means to increase or decrease in supply due to change in other determinants than price of own commodity. Increase in supply shown in figure 2A. In the diagram, DD is demand curve and SS is the supply curve. At equilibrium price OP the quantity sold and purchased OQ. Now suppose, for some reason, the supply increases. The supply curve will shift S1S1. Thus at new equilibrium price, the demand and supply become equal to OQ1.
  • 71. pg. 70 Conclusion โ€“ Shift in the supply curve to the right brings down the equilibrium price, the amount sold and purchased increases. Decrease in supply, SS is the supply curve and DD is the demand curve. The equilibrium price is set up at point E, demand and supply are OQ. Now suppose, the recessionary business conditions, the supply decreases. The supply curve shifts leftward to S1S1. Demand curve remains unchanged at DD, new equilibrium is attained at point F. new equilibrium price OP1 equates demand and supply at OQ1. Conclusion โ€“ Decrease in supply results in an increase in the equilibrium price, the quantity demanded and supplied falls. Change in Supply and Equilibrium Price: some Exceptional situations ๏ต When Demand is Perfectly Elastic โ€“ Perfectly elastic demand curve is parallel to X-axis implying that demand of a commodity is infinite at the prevailing price.
  • 72. pg. 71 (1) When supply rises and supply curve shifts from SS to S1S1(rightwards) o Equilibrium price remains same as OP, as demand is perfectly elastic. o Equilibrium quantity rises from OM to OM1 as there is increase in supply. (2) When supply falls and the supply curve shifts from SS to S2S2 (leftwards) (a) Equilibrium price remains same as OP, as demand is perfectly elastic. (b) Equilibrium quantity falls from OM to OM2 as there is decrease in supply. ๏ต When Demand is Perfectly Inelastic โ€“ Perfectly inelastic demand curve is parallel to Y- axis implying that a change in price of the commodity causes no change in its quantity demanded. (1) When supply rises and the supply curve shifts rightwards (SS to S1S1) (a) Equilibrium price falls from OP to OP1 as there is increase in supply. (b) Equilibrium quantity remains same as OM, as demand is perfectly inelastic. (2) When supply falls and the supply curve shifts leftwards (SS to S2S2) (a) Equilibrium price rises from OP to OP2 as there is decrease in supply. (b) Equilibrium quantity remains same as OM, as demand is perfectly inelastic. ๏ต When supply is Perfectly Elastic โ€“ Perfectly elastic supply is parallel to X-axis implying that any amount of product can be supplied at the prevailing price.
  • 73. pg. 72 (1) When demand curve shifts right DD to D1D1 (a) Equilibrium price does not change, remains OP because supply is perfectly elastic. (b) Equilibrium quantity rises from OM to OM1. (2) When demand falls and the demand shifts left from DD to D2D2 (a) Equilibrium price does not change, because supply is perfectly elatic. (b) Equilibrium quantity falls from OM to OM2. ๏ต When Supply is Perfectly Inelastic โ€“ Perfectly inelastic supply curve is parallel to Y-axis implying that the quantity supplied remains unaffected due to change in price. (1) When demand rises and the demand curve shift to the right (DD to D1D1) (a) Equilibrium price rises from OP to OP1 as there is rise in demand. (b) Equilibrium quantity remains same as OM as supply is perfectly inelastic. (2) When demand falls and the demand curve shifts to left (DD to D2D2) (a) Equilibrium price falls from OP to OP2 as there is fall in demand. (b) Equilibrium quantity remains same as OM as supply is perfectly inelastic.
  • 74. pg. 73 Simultaneous change in demand and supply (i) In fig โ€“ 3A, shows a simultaneous increase or decrease in both demand and supply. Demand and supply increase in the same proportion. Consequently the equilibrium point shifts from E to F. equilibrium price remains same. (ii) Fig โ€“ 3B shows a simultaneous increase or decrease but demand increase or decrease in a larger proportion. Consequently equilibrium point shifts from E to F. equilibrium price rises from OP to OP1. (iii) Fig โ€“ 3C shows a simultaneous increase or decrease but supply increase or decrease in a larger proportion. Consequently equilibrium point shifts from E to F. equilibrium price falls from OP to OP1. Important Points โ€“ ๏ƒผ Price Ceiling โ€“ It means maximum price the producers are allowed to charge. In other words, price ceiling is fixing the price of a commodity at a lower than the equilibrium price. ๏ƒผ Price Floor โ€“ It means the minimum price the producers are allowed to charge. In other words, price floor is fixing the price of a commodity at a higher level the equilibrium price. ๏ƒผ Black Market โ€“ It is a market in which the goods are sold at a price higher than the maximum price fixed by the government. ๏ƒผ Rationing โ€“To ensure availability of good at a minimum price fixed by government, an upper limit on the quantity that can be purchased through fair price shops is fixed. This maximum quantity fixed by government is called rationing.
  • 75. pg. 74 ๏ƒผ Assignment for Determination of Price Objective Type Questions 1. Define price ceiling. 2. What is floor price? 3. What is black market? 4. What is rationing? Conceptualized Questions 1. Why does government intervene toaffect market equilibrium? 2. Why do black markets exist? 3. How surplus created as a result of price floor imposed by government is utilized? Value Based Questions 1. In the market, there exist excess demand for LPG cylinders. To do away with this excess demand government has tried to restrict its usage by providing only 9 LPG cylinders at subsidized rates in a year. What policy implication does this move by government have? 2. Equilibrium price is the market determined price where demand is equal to supply. However, equilibrium price may not be the best price. Why does government intervention become necessary in a welfare state like India?