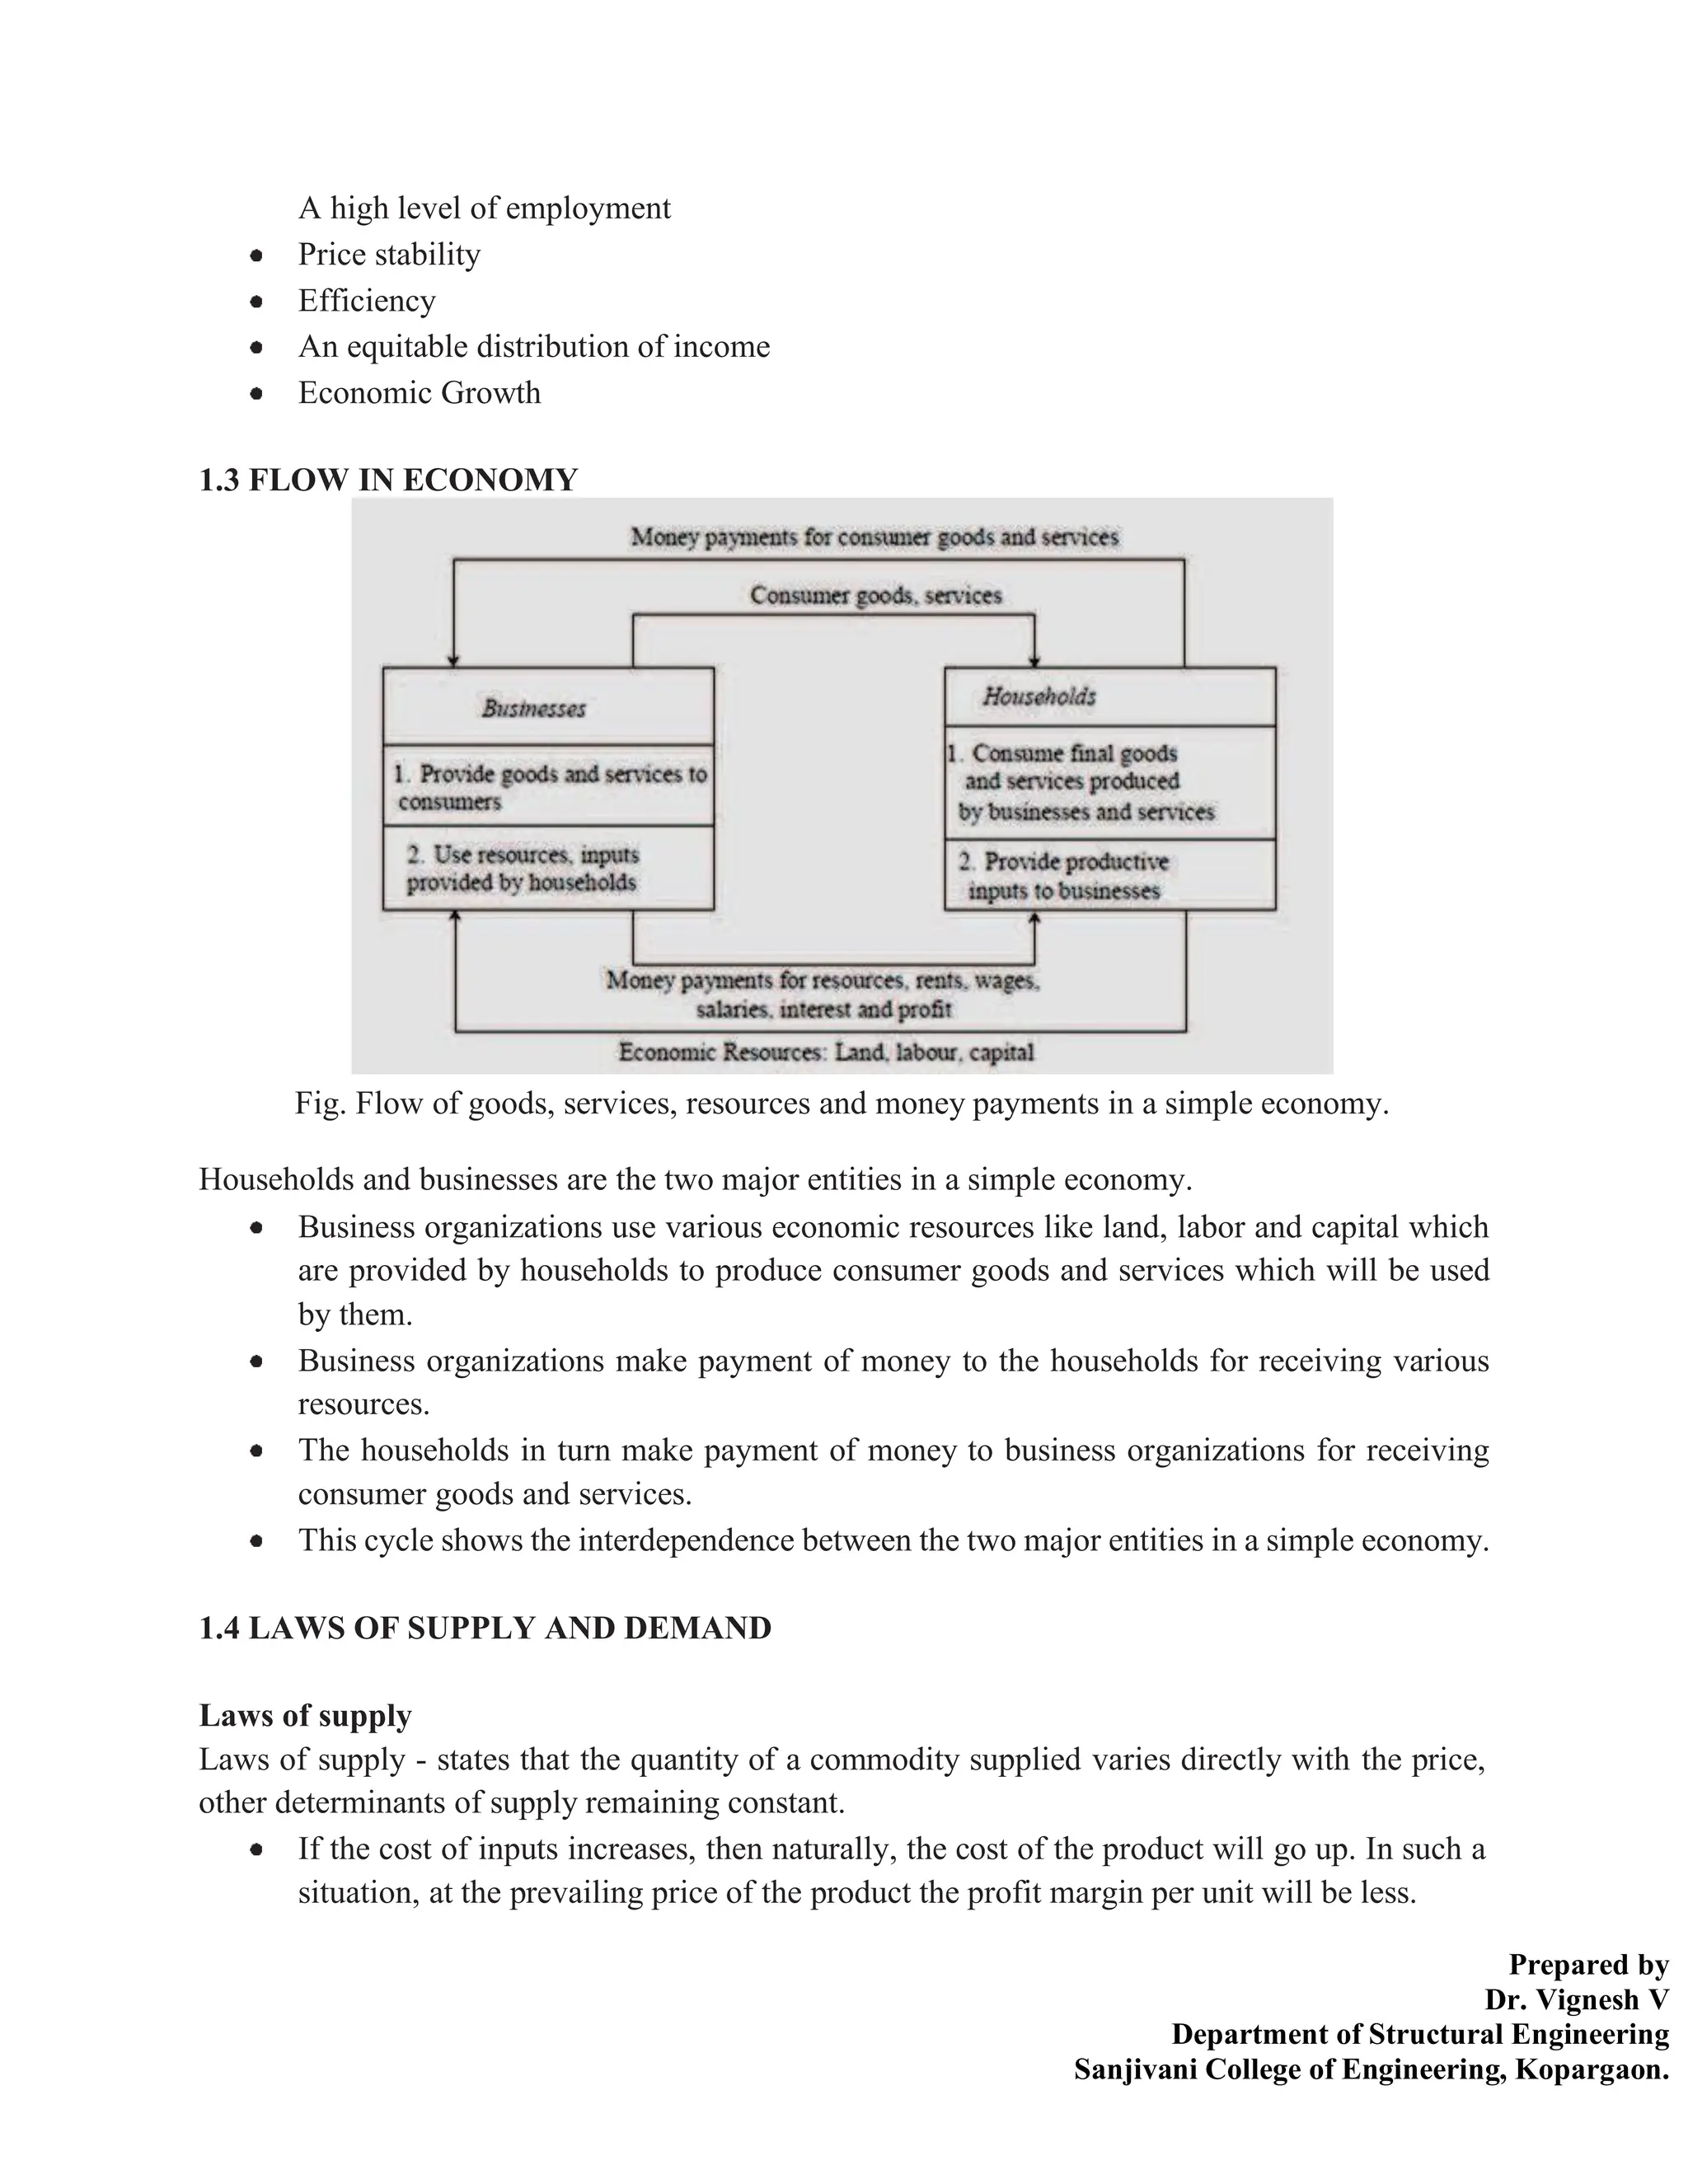
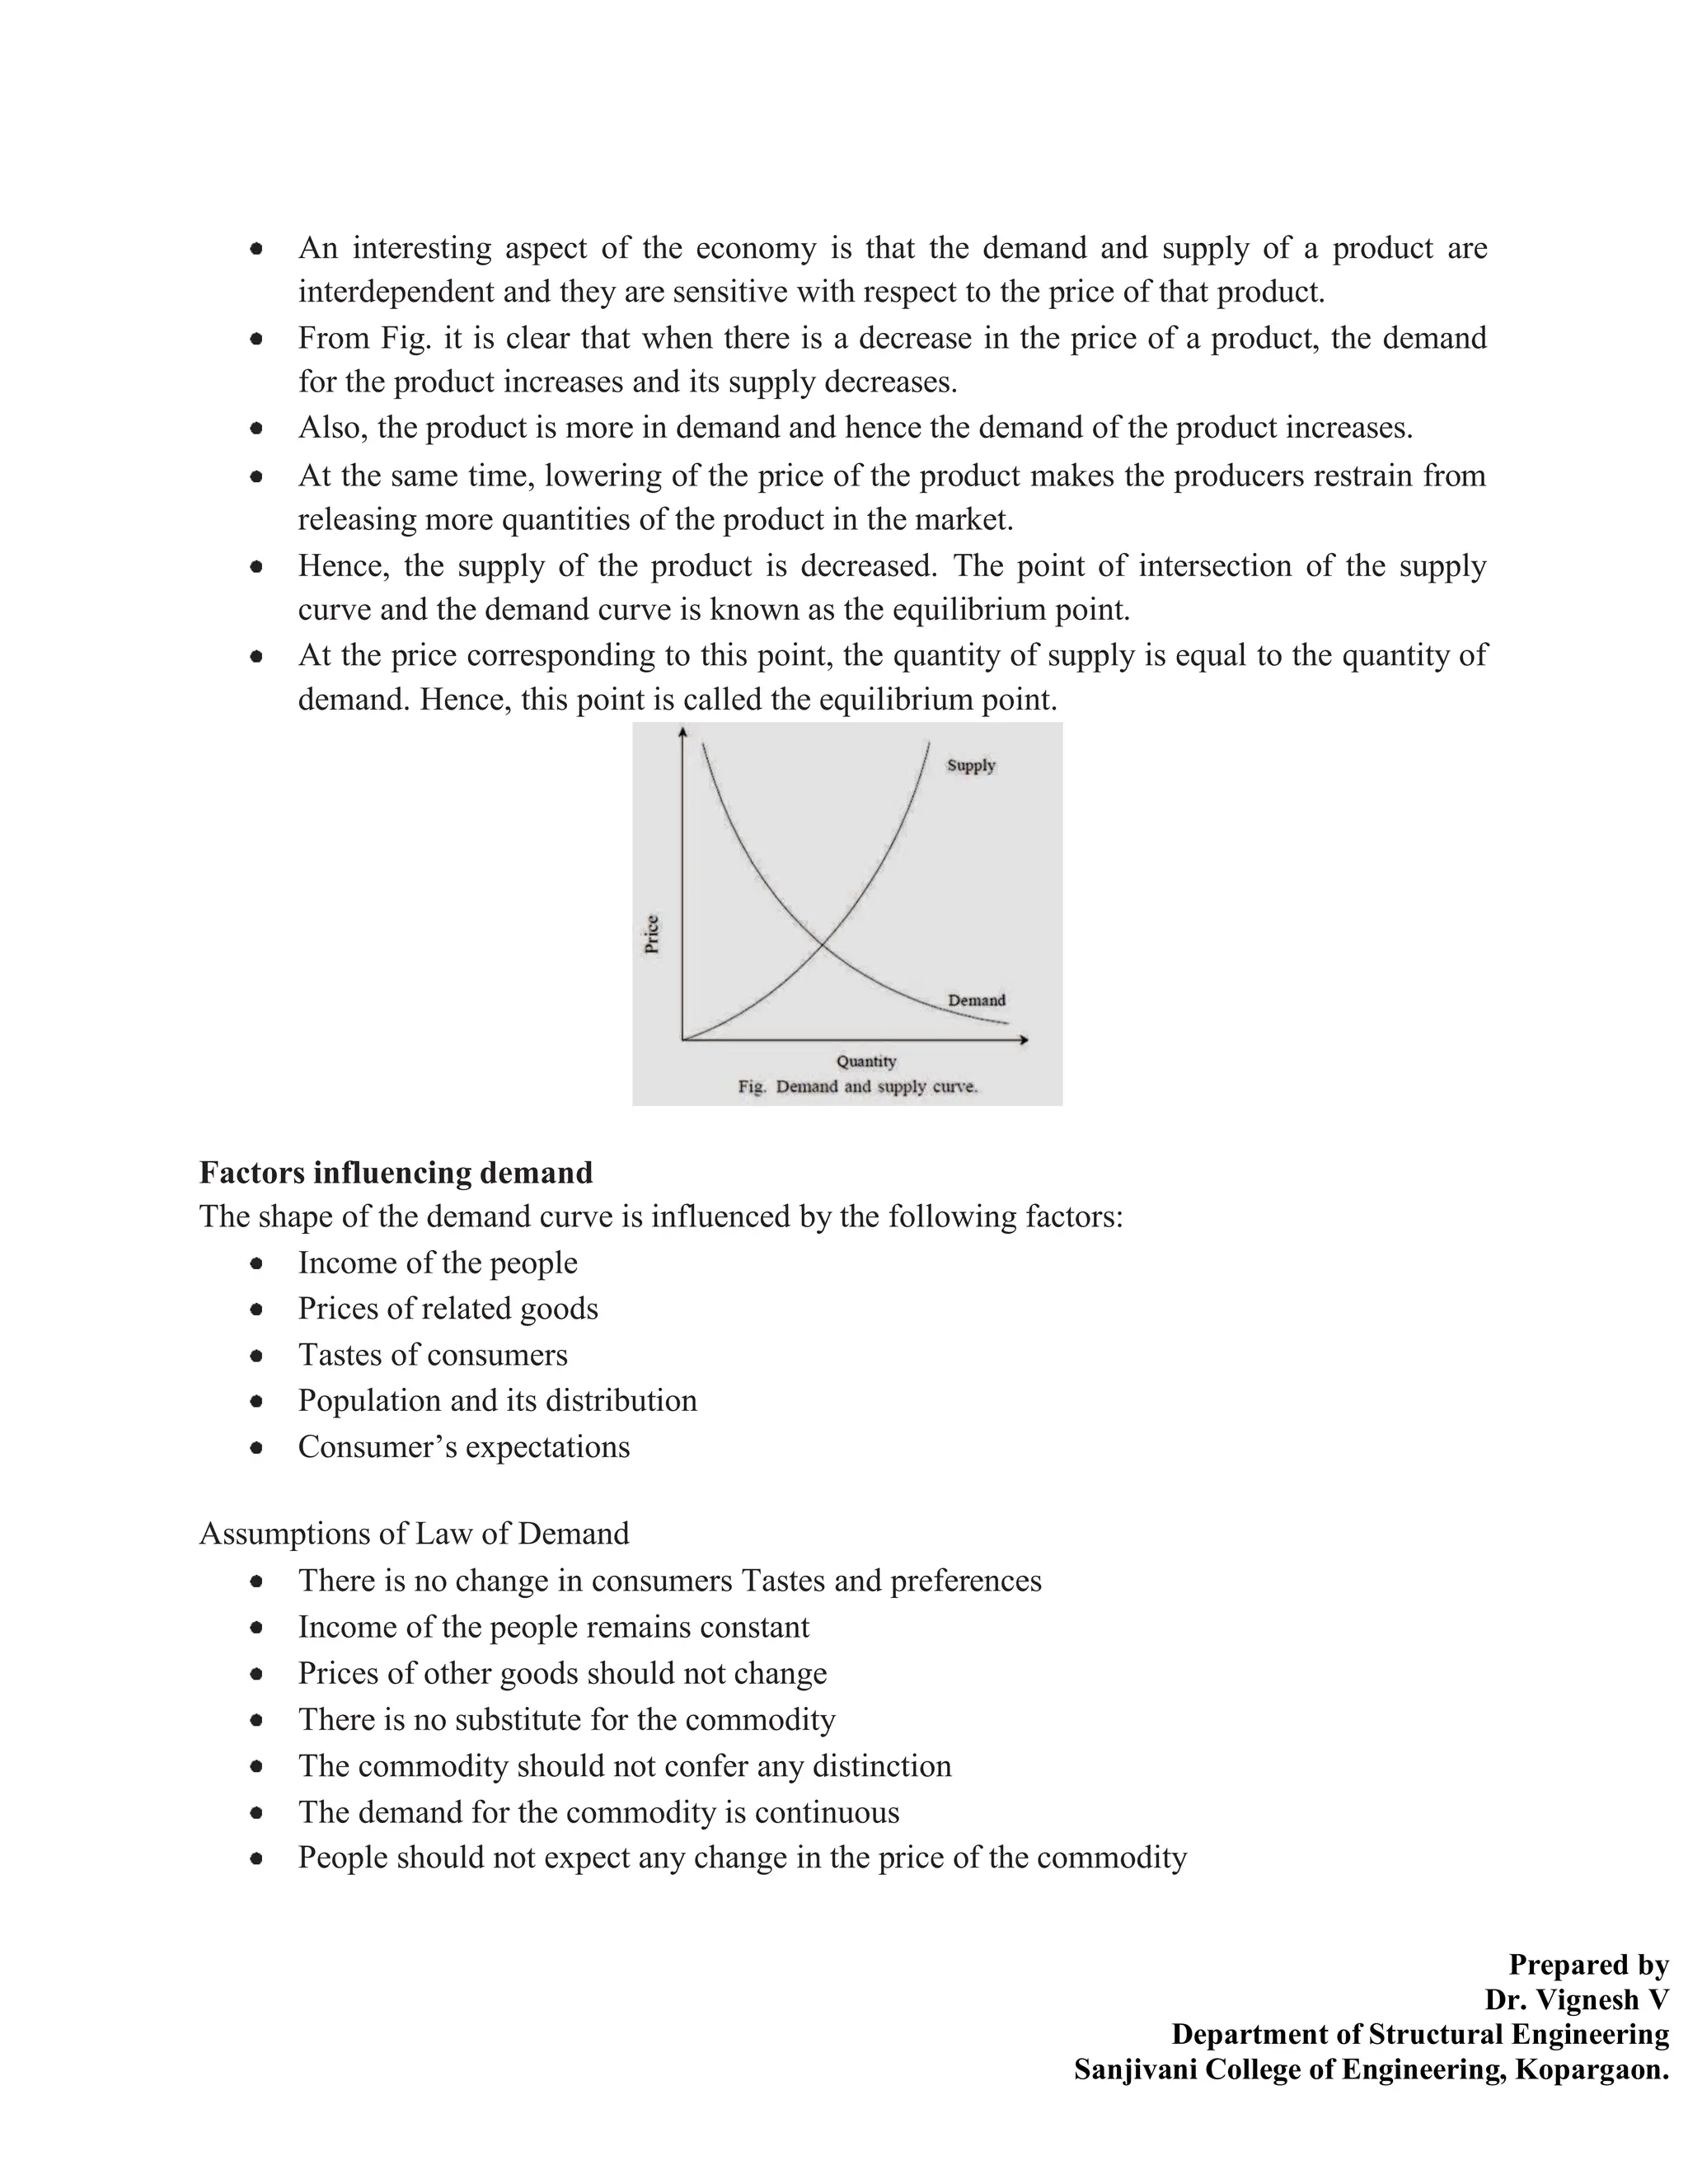
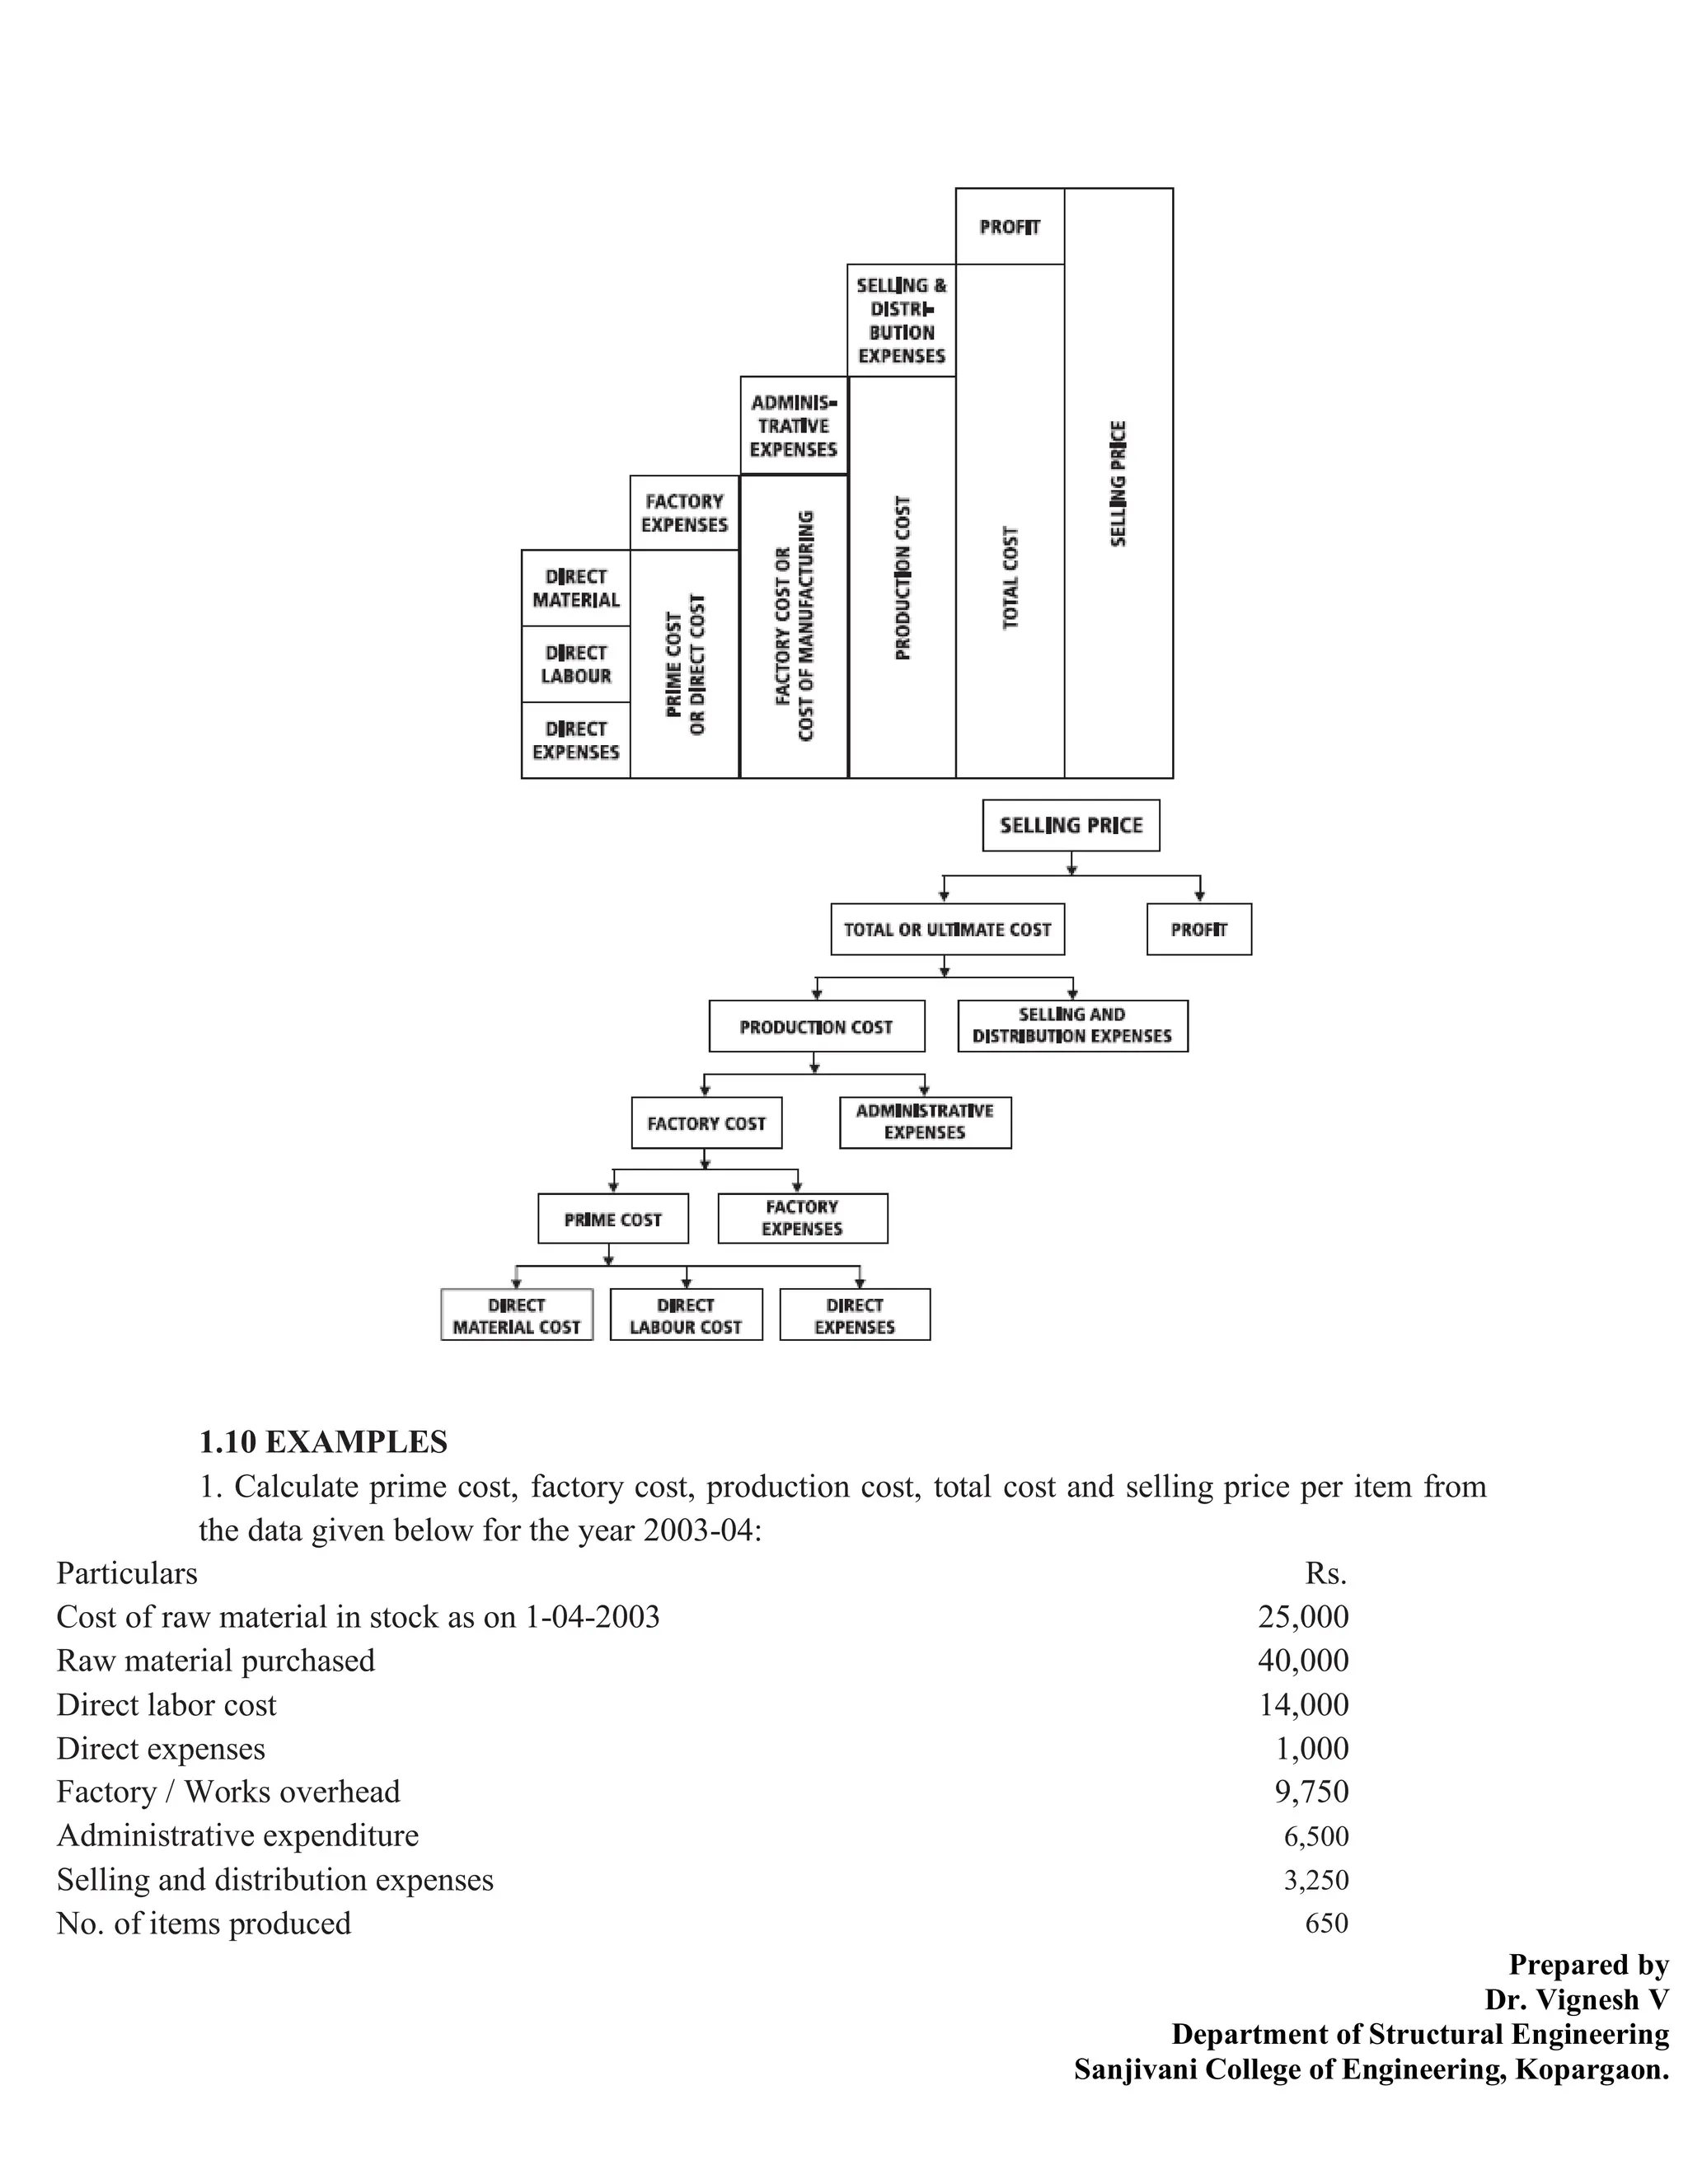
Prepared by
Dr. Vignesh V
Department of Structural Engineering
Sanjivani College of Engineering, Kopargaon.
EEST241-ENGINEERING ECONOMICS
UNIT I
INTRODUCTION TO ECONOMICS
Introduction to Economics- Flow in an economy, Law of supply and demand, Concept of
Engineering Economics – Engineering efficiency, Economic efficiency, Scope of engineering
economics- Element of costs, Marginal cost, Marginal Revenue, Sunk cost, Opportunity cost,
Break-even analysis- V ratio, Elementary economic Analysis – Material selection for product
Design selection for a product, Process planning.
1.1 INTRODUCTION
Efficient functioning of any business organization would enable it to provide goods/services at a
lower price. In the process of managing organizations, the managers at different levels should take
appropriate economic decisions which will help in minimizing investment, operating and
maintenance expenditures besides increasing the revenue, savings and such other gains of the
organization.
These can be achieved through Engineering Economics which deals with the methods that enable
one to make economic decisions towards minimizing costs and/or maximizing benefits to business
organizations.
This chapter discusses the elements of economics and the interaction between its various
components.
This is followed by an analysis of the need and scope of engineering economics. Later, elements
of cost and break-even analysis are presented.
1.2 ECONOMICS
It is a study of economic problems of the people concerning production, consumption, exchange
and distribution of wealth.
Economics is the science that deals with the production and consumption of goods and services
and the distribution and rendering of these for human welfare.
The following are the economic goals / objectives of economy:
Prepared by
Dr. Vignesh V
Department of Structural Engineering
Sanjivani College of Engineering, Kopargaon.
A high level of employment
Price stability
Efficiency
An equitable distribution of income
Economic Growth
1.3 FLOW IN ECONOMY
Fig. Flow of goods, services, resources and money payments in a simple economy.
Households and businesses are the two major entities in a simple economy.
Business organizations use various economic resources like land, labor and capital which
are provided by households to produce consumer goods and services which will be used
by them.
Business organizations make payment of money to the households for receiving various
resources.
The households in turn make payment of money to business organizations for receiving
consumer goods and services.
This cycle shows the interdependence between the two major entities in a simple economy.
1.4 LAWS OF SUPPLY AND DEMAND
Laws of supply
Laws of supply - states that the quantity of a commodity supplied varies directly with the price,
other determinants of supply remaining constant.
If the cost of inputs increases, then naturally, the cost of the product will go up. In such a
situation, at the prevailing price of the product the profit margin per unit will be less.
Prepared by
Dr. Vignesh V
Department of Structural Engineering
Sanjivani College of Engineering, Kopargaon.
The producers will then reduce the production quantity, which in turn will affect the
supply of the product.
For instance, if the prices of fertilizers and cost of labor are increased significantly, in
agriculture, the profit margin per bag of paddy will be reduced.
So, the farmers will reduce the area of cultivation, and hence the quantity of supply of
paddy will be reduced at the prevailing prices of the paddy.
If there is advancement in technology used in the manufacture of the product in the long
run, there will be a reduction in the production cost per unit.
This will enable the manufacturer to have a greater profit margin per unit at the prevailing
price of the product. Hence, the producer will be tempted to supply more quantity to the
market.
Weather also has a direct bearing on the supply of products. For example, demand for
woolen products will increase during winter. This means the prices of woolen goods will
be increased in winter.
So, naturally, manufacturers will supply more volume of woolen goods during winter.
Factors influencing supply
The shape of the supply curve is affected by the following factors:
Selling price: As the price increases, sellers like to sell more and vice-versa.
Cost of production: As cost of production rise due to increase in the variable factors,
supply decreases.
Cost of the inputs:
The change in technology affects the supply function.
If the objective of firm is sales maximization, the supply would be larger.
If the number of producers producing the same product increases, the market supply
increases.
During inflationary period, if sellers expect a further rise in prices, supply will decrease
in the market.
Imposition of taxes by the government will reduce the supply.
Weather
Prices of related goods
Law of demand
Law of demand states that other things being equal demand increases when price falls and
contracts when price rises.
Market demand is the total quantity demanded by all the purchasers together.
Elasticity of Demand - Elasticity of demand may be defined as the degree of responsiveness of
quantity demanded to a Change in price.
Prepared by
Dr. Vignesh V
Department of Structural Engineering
Sanjivani College of Engineering, Kopargaon.
An interesting aspect of the economy is that the demand and supply of a product are
interdependent and they are sensitive with respect to the price of that product.
From Fig. it is clear that when there is a decrease in the price of a product, the demand
for the product increases and its supply decreases.
Also, the product is more in demand and hence the demand of the product increases.
At the same time, lowering of the price of the product makes the producers restrain from
releasing more quantities of the product in the market.
Hence, the supply of the product is decreased. The point of intersection of the supply
curve and the demand curve is known as the equilibrium point.
At the price corresponding to this point, the quantity of supply is equal to the quantity of
demand. Hence, this point is called the equilibrium point.
Factors influencing demand
The shape of the demand curve is influenced by the following factors:
Income of the people
Prices of related goods
Tastes of consumers
Population and its distribution
Consumer’s expectations
Assumptions of Law of Demand
There is no change in consumers Tastes and preferences
Income of the people remains constant
Prices of other goods should not change
There is no substitute for the commodity
The commodity should not confer any distinction
The demand for the commodity is continuous
People should not expect any change in the price of the commodity
Prepared by
Dr. Vignesh V
Department of Structural Engineering
Sanjivani College of Engineering, Kopargaon.
1.5 CONCEPT OF ENGINEERING ECONOMICS
Science is a field of study where the basic principles of different physical systems are
formulated and tested.
Engineering is the application of science. It establishes varied application systems based
on different scientific principles.
From the discussions in the previous section, it is clear that price has a major role in
deciding the demand and supply of a product.
Hence, from the organization’s point of view, efficient and effective functioning of the
organization would certainly help it to provide goods/services at a lower cost which in turn
will enable it to fix a lower price for its goods or services.
The following section discusses the different types of efficiency and their impact on the
operation of businesses and the definition and scope of engineering economics.
.
1.6 TYPES OF EFFICIENCY
Efficiency of a system is generally defined as the ratio of its output to input. The efficiency can be
classified into technical efficiency and economic efficiency.
Technical efficiency
It is the ratio of the output to input of a physical system. The physical system may be a diesel
engine, a machine working in a shop floor, a furnace, etc.
The technical efficiency of a diesel engine is as follows:
In practice, technical efficiency can never be more than 100%.
This is mainly due to frictional loss and incomplete combustion of fuel, which are considered to
be unavoidable phenomena in the working of a diesel engine.
Economic efficiency
Economic efficiency is the ratio of output to input of a business system.
Prepared by
Dr. Vignesh V
Department of Structural Engineering
Sanjivani College of Engineering, Kopargaon.
‘Worth’ is the annual revenue generated by way of operating the business and ‘cost’ is the total
annual expenses incurred in carrying out the business. For the survival and growth of any business,
the economic efficiency should be more than 100%.
Economic efficiency is also called ‘productivity’. There are several ways of improving
productivity.
Increased output for the same input
Decreased input for the same output
By a proportionate increase in the output which is more than the proportionate increase in
the input
By a proportionate decrease in the input which is more than the proportionate decrease in
the output
Through simultaneous increase in the output with decrease in the input.
1.7 DEFINITION AND SCOPE OF ENGINEERING ECONOMICS
As stated earlier, efficient functioning of any business organization would enable it to provide
goods/services at a lower price.
In the process of managing organizations, the managers at different levels should take appropriate
economic decisions which will help in minimizing investment, operating and maintenance
expenditures besides increasing the revenue, savings and other related gains of the organization.
Definition
Engineering economics deals with the methods that enable one to take economic decisions
towards minimizing costs and/or maximizing benefits to business organizations.
Scope
The issues that are covered are elementary economic analysis, interest formulae, bases for
comparing alternatives, present worth method, future worth method, annual equivalent method,
rate of return method, replacement analysis, depreciation, evaluation of public alternatives,
inflation adjusted investment decisions, make or buy decisions, inventory control, project
management, value engineering, and linear programming.
1.8 ELEMENTS OF COSTS
Costing or cost accounting means classifying, recording and allocating the appropriate expenditure
for determining the cost of production and achieved by keeping a continuous record of all the costs
Prepared by
Dr. Vignesh V
Department of Structural Engineering
Sanjivani College of Engineering, Kopargaon.
involved in manufacturing.
Costing or cost accounting gives the actual expenditure incurred on the production of the
component based on the records of expenditure on various activities involved.
Fixed Costs and Variable Costs:
The Fixed Costs are the items of expenditure which remain more or less constant irrespective of
the quantity or volume of production. Examples of fixed costs are: Supervisory charges, cost of
lighting, cost of cleaning the works, operator charges, rent of building, interest on capital,
depreciation of plant and building.
The Variable Costs are those items of expenditure which vary with quantity or volume of
production. Examples are: direct material cost, cost of energy or fuel consumed, cost of tools used,
cost of consumables, repair and maintenance charges and storage charges.
The total cost of the product can be divided into following two major groups:
Direct costs are costs of those factors which directly contribute to the final product and hencecan
be directly charged or allocated to the manufacture of a specific product. Examples: cost of raw
materials, cost of labor processing the materials, cost of equipment and special tooling, jigs and
fixtures used in the manufacturing of the product.
Indirect costs are costs which cannot be directly allocated to the manufacture of a particular
product. Examples: Wages of inspection and supervisory staff, selling and distribution expenses,
administrative expenses, overhead charges, and cost of indirect materials like lubricants, coolants,
grease, repair and maintenance cost.
Elements of Cost: For the purpose of calculations, the total cost of the product is divided into
the following:
(A) Material cost, (B) Labor cost, (C) Other expenses.
(A) Material Cost
Material cost consists of the cost of materials which are used in the manufacture of product. It is
divided into the following:
Direct material cost: It is the cost of those materials which are directly used for the manufacture
of the product and become a part of the finished product. This expenditure can be directly allocated
and charged to the manufacture of a specific product or job and includes the scrap and waste that
has been cut away from original bar or casting.
Indirect material cost: In addition to direct materials a number of other materials are necessary
to help in the conversion of direct materials into final shape. Though these materials are consumed
Prepared by
Dr. Vignesh V
Department of Structural Engineering
Sanjivani College of Engineering, Kopargaon.
in the production, they don’t become a part of the finished product and their cost cannot be directly
booked to the manufacture of a specific product. Such materials are called indirect materials. The
indirect materials include oils, general tools, grease, sand papers, coolants, cotton waste etc. The
cost associated with indirect materials is called indirect material cost.
In some cases certain direct materials like nails, screws, glue, putty etc., are used in such small
quantity that it is not considered worthwhile to identify and charge them as direct materials. In
such cases these materials are also charged as indirect materials.
(B) Labor Cost
It is the expenditure made on the salaries, wages, overtime, bonuses, etc. of the employees of the
enterprise. It can be classified as:
Direct labor cost: Direct laborer is one who actually works and processes the materials to convert
it into the final shape. The cost associated with direct labor is called direct labor cost. The direct
labor cost can be identified and allocated to the manufacture of a specific product. Examples of
the direct labor are the workers operating lathes, milling machines or welders, or assemblers in
assembly shop. The direct labor cost may be allocated to a product or job on the basis of time spent
by a worker on a job.
Indirect labor cost: Indirect laborer is one who is not directly employed in the manufacturing of
the product but his services are used in some indirect manner. The indirect labor includes
supervisors, inspectors, foreman, storekeeper, gatekeeper, maintenance staff, crane driver etc.The
cost associated with indirect labor is called indirect labor cost. The indirect labor costscannot be
identified with a particular job or product but are charged on the total number of products made
during a particular period in a plant.
To make the concept of direct and indirect labor cost clear, consider an operator working on a
drilling machine. The operator in this case is direct labor whereas the man supervising the job,
inspector and storeman supplying the material are indirect labor.
(C) Other Expenses
In addition to the material cost and labor cost, several other expenses such as rent of building,
depreciation of plant and machinery, cost of packing materials, transport and distribution expenses,
wages and salaries of administrative staff and executives are also incurred by the manufacturer.
All this expenditure including the indirect material cost and indirect labor cost is called other
expenses.
Simply, we can say that except direct material and direct labor costs all other expenditure incurred
by the manufacturer is known as “Other Expenses”. Expenses are further classified as:
(a) Direct expenses: Direct expenses include all that expenditure which can be directly allocated
Prepared by
Dr. Vignesh V
Department of Structural Engineering
Sanjivani College of Engineering, Kopargaon.
and charged to a particular job. The direct expenses include cost of special jigs or fixtures, patterns,
tooling made for job, or cost of research and development work done for that specific job.
(b) Indirect expenses: Except direct expenses, all other indirect expenditure incurred by the
manufacturer is called indirect expenses. The indirect expenses are also called overhead expenses
or on-cost.
The indirect expenses are further classified as:
(i) Factory expenses.
(ii) Administrative expenses.
(iii) Selling and distribution expenses.
(i) Factory expenses: Factory expenses comprise of the indirect expenses incurred from the
receipt of the order to the completion of production. In addition to indirect material and indirect
labor cost it includes rent of factory building, license fee, electricity and telephone bills of factory,
insurance charges etc.
Factory expenses are also called “Works expenses”, or “Factory or Works overhead”.
(ii) Administrative expenses: Administrative expenses or office expenses include the
expenditure incurred on control and administration of the factory. It includes the salaries of office
and administrative staff, rent of office building, postage and telephone charges, water and
electricity charges for office, Director’s fee, legal and audit charges etc. Administrative expenses
are also known as ‘Administrative overheads’.
(c) Selling and distribution expenses: This is the expenditure incurred on Sales Department for
selling the product, i.e., wages, salaries, commission and travelling allowances of salesmen and
officers in Sales Department, cost of advertisement, packing, delivery and distribution expenses,
rent of warehouses etc.
1.9 COST OF PRODUCT (LADDER OF COSTS)
The components of cost discussed above can be grouped as follows:
1. Prime cost = Direct material cost + Direct labour cost + Direct expenses
2. Factory cost = Prime cost + Factory expenses
3. Production cost = Factory cost + Administrative expenses
4. Total or Ultimate cost = Production cost + Selling and distribution expenses.
5. Selling price = Ultimate cost + Profit
The above relations can be illustrated on a chart (Ladder of costs)
Prepared by
Dr. Vignesh V
Department of Structural Engineering
Sanjivani College of Engineering, Kopargaon.
1.10 EXAMPLES
1. Calculate prime cost, factory cost, production cost, total cost and selling price per item from
the data given below for the year 2003-04:
Particulars Rs.
Cost of raw material in stock as on 1-04-2003 25,000
Raw material purchased 40,000
Direct labor cost 14,000
Direct expenses 1,000
Factory / Works overhead 9,750
Administrative expenditure 6,500
Selling and distribution expenses 3,250
No. of items produced 650
Prepared by
Dr. Vignesh V
Department of Structural Engineering
Sanjivani College of Engineering, Kopargaon.
Net profit/item is 10 percent of total cost of the product.
Solution:
For 650 units produced during 2003-04
(i) Direct material used = Stock of raw material on 1-04-2003 + raw material purchased
– Stock of raw material on 31-03-2004 = 25,000 + 40,000 – 15,000 = Rs. 50,000
(ii) Direct labor = Rs. 14,000
(iii) Direct expenses = Rs. 1,000
Prime cost = 50,000 + 14,000 + 1,000 = Rs. 65,000
Factory cost = Prime cost + Factory expenses = 65,000 + 9,750 = Rs. 74,750
Production cost = Factory cost + Administrative expenses = 74,750 + 6,500 = Rs. 81,250
Total cost = Production cost + Selling expenses = 81,250 + 3,250 = Rs. 84,500
Selling price = 84,500 + 10 percent of 84,500 = 84,500 × 1.10 = Rs. 92,950
Prime cost/item = 65,000 / 650 = Rs. 100
Factory cost/item = 74,750 / 650 = Rs. 115
Production cost/item = 81,250 / 650 = Rs. 125
Total cost/item = 84,500 / 650 = Rs. 130
Selling price/item = 92,950 / 650 = Rs. 143
2. From the following data for a sewing machine manufacturer, prepare a statement showing
prime cost, Works/factory cost, production cost, total cost and profit.
Cost of raw material in stock as on 31-03-2004 15,000
Particulars Rs.
Value of stock of material as on 1-04-2003 26,000
Material purchased 2,74,000
Prepared by
Dr. Vignesh V
Department of Structural Engineering
Sanjivani College of Engineering, Kopargaon.
General administrative expenses 3,400
Water, power and telephone bills of factory 9,600
Water, lighting and telephone bills of office 2,500
Material transportation in factory 2,000
Insurance and rent of office building 2,000
Direct expenses 5,000
Commission and pay of salesman 10,500
Repair and maintenance of plant 1,000
Works Manager salary 30,000
Salary of office staff 60,000
Value of stock of material as on 31-03-2004 36,000
Sale of products 6,36,000
Solution:
(i) Material cost = Opening stock value + Material purchases – Closing balance
= 26,000 + 2,74,000 – 36,000 = Rs. 2,64,000
Prime cost = Direct material cost + Direct labor cost + Direct expenses
= 2,64,000 + 1,20,000 + 5,000 = Rs. 3,89,000
(ii) Factory overheads are:
Rent 16,000
Depreciation of plant and machinery 8,000
Water, power and telephone bills of factory 9,600
Material transportation in factory 2,000
Repair and maintenance of plant 1,000
Work Manager salary 30,000
Factory overheads 66,600
Factory cost = Prime cost + Factory expenses = 3,89,000 + 66,600 = Rs. 4,55,600
(iii) Administrative/office expenses are:
Depreciation of office equipment 2,000
General administrative expenses 3,400
Water, lighting and telephone bills of office 2,500
Rent, insurance and taxes on office building 2,000
Wages to labor 1,20,000
Depreciation of plant and machinery 8,000
Depreciation of office equipment 2,000
Rent, taxes and insurance of factory 16,000
Prepared by
Dr. Vignesh V
Department of Structural Engineering
Sanjivani College of Engineering, Kopargaon.
Salary of office staff 60,000
Office expenses 69,900
Production cost = Factory cost + Office expenses = Rs. 4,55,600 + Rs. 69,900 = Rs. 5,25,500
(iv)Selling overheads are:
Commission and pay to salesmen = Rs. 10,500
Total cost = Production cost + Selling expenses = 5,25,500 + 10,500 = Rs. 5,36,000
(v) Profit = Sales – Total cost = 6,36,000 – 5,36,000 = Rs. 1,00,000
1.11 OTHER COST
1. Marginal Cost
Marginal cost of a product is the cost of producing an additional unit of that product. Let the cost
of producing 20 units of a product be Rs. 10,000, and the cost of producing 21 units of the same
product be Rs. 10,045. Then the marginal cost of producing the 21st unit is Rs. 45.
2. Marginal Revenue
Marginal revenue of a product is the incremental revenue of selling an additional unit of that
product. Let, the revenue of selling 20 units of a product be Rs. 15,000 and the revenue of selling
21 units of the same product be Rs. 15,085. Then, the marginal revenue of selling the 21st unit is
Rs. 85.
3. Sunk Cost
This is known as the past cost of an equipment/asset. Let us assume that an equipment has been
purchased for Rs. 1,00,000 about three years back. If it is considered for replacement, then its
present value is not Rs. 1,00,000. Instead, its present market value should be taken as the present
value of the equipment for further analysis. So, the purchase value of the equipment in the past is
known as its sunk cost. The sunk cost should not be considered for any analysis done from now
onwards.
4. Opportunity Cost
In practice, if an alternative (X) is selected from a set of competing alternatives (X, Y), then the
corresponding investment in the selected alternative is not available for any other purpose. If the
same money is invested in some other alternative (Y), it may fetch some return. Since the money
is invested in the selected alternative (X), one has to forego the return from the other alternative
(Y). The amount that is foregone by not investing in the other alternative (Y) is known as the
opportunity cost of the selected alternative (X). So the opportunity cost of an alternative is the
return that will be foregone by not investing the same money in another alternative.
Consider that a person has invested a sum of Rs. 50,000 in shares. Let the expected annual return
by this alternative be Rs. 7,500. If the same amount is invested in a fixed deposit, a bank will pay
a return of 18%. Then, the corresponding total return per year for the investment in the bank is Rs.
9,000. This return is greater than the return from shares. The foregone excess return of Rs. 1,500
Prepared by
Dr. Vignesh V
Department of Structural Engineering
Sanjivani College of Engineering, Kopargaon.
by way of not investing in the bank is the opportunity cost of investing in shares.
1.12 TERMS USED IN BREAK-EVEN ANALYSIS
(i) Fixed cost: Fixed costs remain fixed in the short-run. Examples are rent, insurance,
depreciation, factory supervisor's salaries, directors' salaries, and so on.
(ii) Variable costs: The variable cost per unit varies with the volume of production. The variable
costs include cost of direct materials, direct labor, direct expenses and operating supplies such as
lubricating oil and so on.
(iii) Total cost: The total of fixed and variable costs.
(iv) Total revenue: The sales proceeds (selling price per unit x number of units sold).
(v) Contribution margin: The contribution margin is the difference between the selling price per
unit and the variable cost per unit. It is also determined as (fixed cost per unit +profit per unit).
(vi) Profit = Contribution - Fixed cost.
(vii) Contribution margin ratio: It is the ratio between contribution per unit and the selling price
per unit.
(viii) Margin of safety in units: The excess of actual sales (in units) minus the breakeven point
(in units).
(ix) Margin of safety in sales volume: The excess of actual sales (in rupees) minus the break- even
point (in rupees).
(x) Angle of incidence: The angle formed where total cost curve cuts the total revenue curve
(xi) PN ratio: The ratio between the contribution and sales.
1.13 ASSUMPTIONS IN THE BREAK-EVEN ANALYSIS
The following assumptions are made while plotting a break-even chart:
The total cost of production can be divided into two categories - (a) Fixed cost, (b)
Variable cost.
Fixed cost remains constant i.e., it is independent of the quantity produced and includes
executive’s salaries, rent of building, depreciation of plant and equipment etc.
The variable cost varies directly and proportionately with the volume of production. If
V = Variable cost per unit and Q is the quantity produced, variable cost = V x Q.
The selling price does not change with change in the volume of sales. If P is the selling
price per unit, the total sales income = P x Q.
Prepared by
Dr. Vignesh V
Department of Structural Engineering
Sanjivani College of Engineering, Kopargaon.
The firm deals with only one product, or the sales mix remains unchanged.
There is a perfect synchronization between production and sales. This assumes that
everything produced is sold and there is no change in the inventory of finished goods.
Productivity per worker and efficiency of plant, etc., remains mostly unchanged.
Any change in anyone of the above factors will affect the break-even point and the profits will be
affected by factors other than volume. Hence, the result of the break-even analysis should be
interpreted subject to the limitations of the above assumptions.
1.14 PLOTTING THE BREAK-EVENCHART
The cost and the sales income (revenue) in rupees are plotted along the vertical axis.
The quantity (volume of production) is plotted along the horizontal axis.
Fixed cost is represented by a straight line parallel to the horizontal axis.
The variable costs are superimposed upon the horizontal line representing the fixed cost.
This top line then represents the total cost line.
The sales income line passes through the origin.
The point of intersection of the sales income line and the total cost line represents the break-
even point.
The shaded area between the total cost line and the sales income line on the left hand side
of B.E.P. indicates loss; whereas the shaded area on the right hand side of B.E.P. shows
profit.
1.15 Break-Even Analysis
The main objective of break-even analysis is to find the cut-off production volume from where a
firm will make profit.
Prepared by
Dr. Vignesh V
Department of Structural Engineering
Sanjivani College of Engineering, Kopargaon.
Let s = selling price per unit
v = variable cost per unit
FC = fixed cost per period
Q = volume of production
The total sales revenue (S) of the firm is given by the following formula:
S = s Q
The total cost of the firm for a given production volume is given as
TC = Total variable cost + Fixed cost = v Q + FC
The linear plots of the above two equations are shown in Fig.
The intersection point of the total sales revenue line and the total cost line is called the
break-even point.
The corresponding volume of production on the X-axis is known as the break-even sales
quantity.
At the intersection point, the total cost is equal to the total revenue.
This point is also called the no-loss or no-gain situation.
For any production quantity which is less than the break-even quantity, the total cost is
more than the total revenue.
Hence, the firm will be making loss.
For any production quantity which is more than the break-even quantity, the total revenue will be
more than the total cost. Hence, the firm will be making profit.
Profit = Sales – (Fixed cost + Variable costs)
= s Q – (FC + v Q)
The formulae to find the break-even quantity and break-even sales quantity:
Prepared by
Dr. Vignesh V
Department of Structural Engineering
Sanjivani College of Engineering, Kopargaon.
The contribution is the difference between the sales and the variable costs. The margin of safety
(M.S.) is the sales over and above the break-even sales. The formulae to compute these values are
Contribution = Sales – Variable costs
Contribution/unit = Selling price/unit – Variable cost/unit
M.S. = Actual sales – Break-even sales
= Profit × sales / Contribution
M.S. as a per cent of sales = (M.S./Sales) 100
1.16 Break-even point
The point of intersection of the total cost line and the income line is called as the break-even point.
The break-even point is that junction here income and costs are exactly in balance. Thus there is
neither profit nor loss for that particular volume of production.
Break-even point indicates minimum operating level below which it is dangerous to fall. As the
performance reaches towards this non-profit point, corrective measures should be taken to cut
down the cost, (increase output or raise selling price.) The spread to the right of BEP shows the
profit potential while to the left represents the loss potential BEP is also called as the "no-profit-
no-loss point."
1.17 Margin of Safety
Margin of safety is the distance between the break-even point and the output being produced. A
large margin of safety indicates that the business can earn profit even if there is a great reduction
in output. If the margin of safety is relatively small then it indicates that the profit will be
considerably small even if there is a small drop in output. A low margin of safety level indicates
Prepared by
Dr. Vignesh V
Department of Structural Engineering
Sanjivani College of Engineering, Kopargaon.
high fixed costs and profits are not possible unless the output level is sufficient enough to absorb
fixed costs.
Margin of safety is generally expressed as:
Ratio of budgeted sales to sales at BEP.
Ratio of actual sales to sales at BEP.
Percentage of budget to BEP.
Percentage of budget to actual sales at BEP.
Percentage of the difference between actual sales and break-even sales to budgeted sales.
In case unsatisfactory margin of safety the following measures should be taken:
Increase in the sale price.
Reduction in fixed costs.
Reduction in variable costs.
Increase in output.
Stop production of non-profitable items and pay more attention towards profitable items.
Mathematically:
Margin of Safety = (Sales - Sales at BEP / Sales) x 100
= Profit x Sales / (Sales - Variable costs)
1.18 Angle of Incidence
The angle between the sales income line and the total cost line is called as angle of incidence. A
large angle of incidence indicates large profit and extremely favorable business position
management aims to widen the angle of incidence to improve the rate of profitability. A narrow
angle shows that even though fixed overheads are recovered, the profit accrued shows a low rate
of return. This indicates a large part of variable costs in total cost.
1.10 Profit/Volume Ratio (P/V Ratio)
P/V ratio is a valid ratio which is useful for further analysis. Profit volume ratio measures the
profitability in relation to sales. The contribution at given output is defined to be the difference
between total sales and total variable costs. The P/V ratio is the ratio of contribution to sales. It
represents the relationship between contribution and turn-over. So, it is a measure to compare
profitability of different products. Higher the P/V ratio, the high yielding is the product.
The different formulae for the P/V ratio are as follows:
P/V ratio = Contribution / Sales = Sales − Variable costs / Sales
The relationship between BEP and P/V ratio is as follows:
BEP =Fixed cost / P/V ratio
Prepared by
Dr. Vignesh V
Department of Structural Engineering
Sanjivani College of Engineering, Kopargaon.
Uses of P/V ratio
The P/V ratio can be used to study a variety of problems viz.:
Determination of B.E.P.
To know profit for given sales volume.
To now sales volume for achieving some desired profit.
P/V ratio can be increased by
Increasing the selling price.
Changing the mix of sales.
Reduction in variable costs.
1.19 ADVANTAGES OF BREAK-EVEN CHART
Management can employ break-even chart to project the cost and income picture under various
anticipated future conditions and for alternative business programme. Hence, the chart is useful
to the management.
To show the relative importance of different classes of costs, how they vary with volume
of production, and how they may be controlled.
To show the impact of changes in sales volume on profit.
To predict the effect of price and cost changes on the break-even point.
To show the gain needed in sales volume (or productivity) to maintain profits when
prices or costs change in a specific way e.g. when prices decline but wages and the cost
of material do not.
To select the proper size plant or to predict the effect of changes in plant size or
modernization of plant on the break-even point. Therefore, through break-even chart
management can estimate what amount of investment in plant capacity is economically
justified for the projected volume of sales.
To compare the profitability of two or more firms.
1.20 LIMITATIONS OF BREAK-EVEN ANALYSIS
In practice all the costs are not always either fixed costs or variable costs. There are some
semi-variable overhead costs.
In the long run all costs are variable, so the break-even analysis holds good only for short
run requirements.
Break even analysis assumes, that profits are a function of output ignoring the fact that they
are also affected by technological changes, improved management, improvement in
quality, versatility, etc.
Prepared by
Dr. Vignesh V
Department of Structural Engineering
Sanjivani College of Engineering, Kopargaon.
It is suitable only when the firm produces one type of product.
1.21 APPLICATION OF BREAK-EVEN ANALYSIS
Make or Buy Decision
Choosing a Product Mix when there is a Limiting Factor
Drop or add decision
Impact of changes in cost or selling price on BEP
Determining the BEP when there is an increase in the fixed cost
1.22 EXAMPLE:
Alpha Associates has the following details:
Fixed cost = Rs. 20,00,000
Variable cost per unit = Rs. 100
Selling price per unit = Rs. 200
Find
(a) The break-even sales quantity,
(b) The break-even sales
(c) If the actual production quantity is 60,000, find (i) contribution; and (ii) margin of
safety by all methods.
Solution
Fixed cost (FC) = Rs. 20,00,000
Variable cost per unit (v) = Rs. 100
Selling price per unit (s) = Rs. 200
(a) Break-even quantity = FC / s – v = 20,00,000 / 100 = 20,000 units
(b) Break-even sales = (FC / s – v) x s = 20,000 x 200 = Rs. 40,00,000
(c) (i) Contribution = Sales – Variable cost = s x Q – v x Q = 200 x 60000 – 100 x 60000
= 1,20,00,000 – 60,00,000
= Rs. 60,00,000
(ii) Margin of safety M.S. = Sales – Break-even sales = 60,000 x 200 – 40,00,000 =
= Rs. 80,00,000
M.S. as a per cent of sales = 80,00,000 / 1,20,00,000 x 100 = 67%
1.23 Elementary Economic Analysis
Whether it is a business situation or a day-to-day event in somebody’s personal life, there are a
Prepared by
Dr. Vignesh V
Department of Structural Engineering
Sanjivani College of Engineering, Kopargaon.
large number of economic decisions making involved. One can manage many of these decision
problems by using simple economic analysis.
For example, an industry can source its raw materials from a nearby place or from a far-off
place. In this problem, the following factors will affect the decision:
Price of the raw material
Transportation cost of the raw material
Availability of the raw material
Quality of the raw material
Consider the alternative of sourcing raw materials from a nearby place with the following
characteristics:
The raw material is more costly in the nearby area.
The availability of the raw material is not sufficient enough to support the operation of
the industry throughout the year.
The raw material requires pre-processing before it is used in the production process. This
would certainly add cost to the product.
The cost of transportation is minimal under this alternative.
On the other hand, consider another alternative of sourcing the raw materials from a far-off place
with the following characteristics:
The raw material is less costly at the far off place.
The cost of transportation is very high.
The availability of the raw material at this site is abundant and it can support the plant
throughout the year.
The raw material from this site does not require any preprocessing before using it for
production
1.24 EXAMPLES FOR SIMPLE ECONOMIC ANALYSIS
In this section, the concept of simple economic analysis is illustrated using suitable examples in
the following areas:
Material selection for a product
Design selection for a product
Design selection for a process industry
Building material selection for construction activities
Process planning/Process modification
1.24.1 Material Selection for a Product/Substitution Of Raw Material
Prepared by
Dr. Vignesh V
Department of Structural Engineering
Sanjivani College of Engineering, Kopargaon.
The cost of a product can be reduced greatly by substitution of the raw materials. Among various
elements of cost, raw material cost is most significant and it forms a major portion of the total cost
of any product.
So, any attempt to find a suitable raw material will bring a reduction in the total cost in any one
or combinations of the following ways:
Reduced machining/process time
Enhanced durability of the product
Cheaper raw material price
Therefore, the process of raw material selection/substitution will result in finding an alternate raw
material which will provide the necessary functions that are provided by the raw material that is
presently used.
In this process, if the new raw material provides any additional benefit, then it should be treated
as its welcoming feature.
EXAMPLE
In the design of a jet engine part, the designer has a choice of specifying either an aluminium alloy
casting or a steel casting. Either material will provide equal service, but the aluminium casting will
weigh 1.2 kg as compared with 1.35 kg for the steel casting.
The aluminium can be cast for Rs. 80.00 per kg and the steel one for Rs. 35.00 per kg. The cost
of machining per unit is Rs. 150.00 for aluminium and Rs. 170.00 for steel. Every kilogram of
excess weight is associated with a penalty of Rs. 1,300 due to increased fuel consumption. Which
material should be specified and what is the economic advantage of the selection perunit?
Solution:
(a) Cost of using aluminium metal for the jet engine part:
Weight of aluminium casting/unit = 1.2 kg
Cost of making aluminium casting = Rs. 80.00 per kg
Cost of machining aluminium casting per unit = Rs. 150.00
Total cost of jet engine part made of aluminium/unit
= Cost of making aluminium casting/unit + Cost of machining aluminium casting/unit
= 80 x1.2 + 150 = 96 + 150 = Rs. 246
(b) Cost of jet engine part made of steel/unit:
Weight of steel casting/unit = 1.35 kg
Cost of making steel casting = Rs. 35.00 per kg
Prepared by
Dr. Vignesh V
Department of Structural Engineering
Sanjivani College of Engineering, Kopargaon.
Cost of machining steel casting per unit = Rs. 170.00
Penalty of excess weight of steel casting = Rs. 1,300 per kg
Total cost of jet engine part made of steel/unit
= Cost of making steel casting/unit + Cost of machining steel casting/unit + Penalty for
excess weight of steel casting
= 35 x 1.35 + 170 + 1,300(1.35 – 1.2)
= Rs. 412.25
DECISION
The total cost/unit of a jet engine part made of aluminium is less than that for an engine made of
steel. Hence, aluminium is suggested for making the jet engine part. The economic advantage of
using aluminium over steel/unit is Rs. 412.25 – Rs. 246 = Rs. 166.25
1.24.2 Design Selection for a Product
The design modification of a product may result in reduced raw material requirements, increased
machinability of the materials and reduced labor.
Design is an important factor which decides the cost of the product for a specified level of
performance of that product.
The elementary economic analysis applied to the selection of design for a product is illustrated
with example problems.
EXAMPLE
Two alternatives are under consideration for a tapered fastening pin. Either design will serve the
purpose and will involve the same material and manufacturing cost except for the lathe and grinder
operations.
Design A will require 16 hours of lathe time and 4.5 hours of grinder time per 1,000 units. Design
B will require 7 hours of lathe time and 12 hours of grinder time per 1,000 units. The operating
cost of the lathe including labor is Rs. 200 per hour. The operating cost of the grinder including
labor is Rs. 150 per hour. Which design should be adopted if 1,00,000 units are required per year
and what is the economic advantage of the best alternative?
Solution
Operating cost of lathe including labor = Rs. 200 per hr
Operating cost of grinder including labor = Rs. 150 per hr
(a) Cost of design A
No. of hours of lathe time per 1,000 units = 16 hr
No. of hours of grinder time per 1,000 units = 4.5 hr
Total cost of design A/1,000 units = Cost of lathe operation per 1,000 units + Cost of
grinder operation per 1,000 units
= 16 x 200 + 4.5 x 150 = Rs. 3,875
Prepared by
Dr. Vignesh V
Department of Structural Engineering
Sanjivani College of Engineering, Kopargaon.
Total cost of design A/1,00,000 units = 3,875 x 1,00,000/1,000 = Rs. 3,87,500
(b) Cost of design B
No. of hours of lathe time per 1,000 units = 7 hr
No. of hours of grinder time per 1,000 units = 12 hr
Total cost of design B/1,000 units = Cost of lathe operation/1,000 units + Cost of grinder
operation/1,000 units
= 7 x 200 + 12 x 150 = Rs. 3,200
Total cost of design B/1,00,000 units = 3,200 x 1,00,000/1,000 = Rs. 3,20,000
DECISION
The total cost/1,00,000 units of design B is less than that of design A. Hence, design B is
recommended for making the tapered fastening pin. Economic advantage of the design B over
design A per 1,00,000 units = Rs. 3,87,500 – Rs. 3,20,000 = Rs. 67,500.
1.25 Process Planning
Process plan
It is the detailed instructions for making a part or a component. It includes such information as the
operations, their sequence, machines, tools, speeds and feeds, dimensions, tolerances, stock
removed, inspection procedures and time standards (i.e., cycle time).
Process planning
It may be defined as the determination of the processes and the sequence of operations required
for making the product. It consists of devising, selecting and specifying processes, machine tools
and other equipment to transform the raw material into finished product as per the specifications
called for by the drawings.
Process planning can be defined as an act of preparing a detailed processing documentation for the
manufacture of a piece part or assembly.
Process Planning Activities
Analysis of the finished part requirements as specified in the engineering design
Determining the sequence of operation required
Selecting the proper equipment to accomplish the required operations
Calculating the specific operation setup times and cycle times on each machine
Documenting the established process plans
Communicating the manufacturing knowledge to the shop floor
1. Analyze finished part requirements
Component drawing should be analyzed to identify its features, dimensions, and
Prepared by
Dr. Vignesh V
Department of Structural Engineering
Sanjivani College of Engineering, Kopargaon.
tolerance specifications
Part’s requirement defined by its features, dimensions, and tolerance specifications will
determine corresponding processing requirements
2. Determine operating sequence
Basic aim is to determine the type of processing operation that has the capability to generate
various types of features, given the tolerance requirements
There are two ways of viewing decision process
First view is to consider processing evaluation of part from rough state to finished final
state. In this view material is removed or modified on rough part in stages in order to
transform it into finished part
Second view is to consider part evaluation from finished state back to rough/ initial state.
In this view material is added back onto the part.
3. Select machines
Machine selection requires determining how the part would be processed on each of the
alternative machines so that best machine can be selected
At this phase, firm has to decide whether to make or buy the component part
Break even analysis is most convenient method for selecting optimum method of
manufacture or machine amongst the competing ones
Factures which influence the selection of machine are,
➢ Economic considerations
➢ Production rate and unit cost of production
➢ Durability and dependability
➢ Lower process rejection
➢ Minimum set-up and put away times
➢ Longer productive life of machines or equipment
➢ Functional versatility
4. Material selection parameters
Function
Appearance
Reliability
Service life
Environment
Compatibility
Productivity
Cost
Prepared by
Dr. Vignesh V
Department of Structural Engineering
Sanjivani College of Engineering, Kopargaon.
5. Calculate processing time
Determination of set-up times requires knowledge of available tooling and sequence of
steps necessary to prepare the machine for processing given work piece
For establishing accurate set-up times, detailed knowledge of equipment capacity, tooling,
and shop practice required
Calculation of part processing time requires determination of sequence of processing steps
on each machine. This is called as OUTPLANNING
After calculation of processing time, appropriate times for loading, part unloading,
machine indexing, and other factors involved in one complete cycle for processing a part
must be included to compute the expected machine cycle time
Allowances are added with machine cycle time to calculate standard cycle time for
processing one piece
Appropriate machine rates are added with calculated cycle time to calculate expected
standard cost for given operation
6. Document process planning
Process plan is documented as job routing or operation sheet
Operation sheet also called “route sheet”, “instruction sheet”, “traveler”, “planner”
Information provided by route sheet are,
➢ Part identification
➢ Description of processing steps in each operation
➢ Operation sequence and machines
➢ Standard set-up and cycle times
➢ Tooling requirements for each operation
➢ Production control information showing the planning lead time at each operation
Reasons for documentation
To have a record on hoe a part is processed in order to plan future parts with similar
design requirements in a consistent manner
To provide a record for future job quoting, cost estimating, and standard costing systems
To act as a vehicle for communication
7. Communicate process knowledge
Communication is essential to ensure that part will be processed according to most
economical way
Process documentation and communication provide basis for improved part consistency
and quality in manufacturing
Process Planning Sheet
Prepared by
Dr. Vignesh V
Department of Structural Engineering
Sanjivani College of Engineering, Kopargaon.
The whole information determined by the process planning is recorded in a tabular form in a
sheet called process planning sheet. This document is provided to the shop personnel for their
use. The character of this sheet will vary for different organizations depending upon the
production conditions and degree of details required.
In general the following data is listed for each component of the product in the process sheet.
Information regarding the main product, of which the component being manufactured is a
part i.e., name and part number of the main product.
Name, part number, drawing number of the component and number off i.e., no. of
components required per product.
Information concerning the blank i.e., raw material used, size and weight of stock.
Operations are listed in proper sequence along with the shops in which these operations
will be performed.
Information regarding machines used for each operation.
Data on jigs, fixtures and other special tools required.
Inspection devices needed for inspection.
Cutting data i.e., speeds, feeds & depth of cut for each machining operation.
Elements of standard time such as set-up time, handling time and machining time for the
job.
A typical process sheet is shown in Table.
Prepared by
Dr. Vignesh V
Department of Structural Engineering
Sanjivani College of Engineering, Kopargaon.
The process planning sheet is prepared by the process engineer in consultation with the
tool engineer, industrial engineer, or methods engineer.
Prepared by
Dr. Vignesh V
Department of Structural Engineering
Sanjivani College of Engineering, Kopargaon.
USES OF PROCESS SHEET
A process sheet is a very important document which forms a basis for all planning,
scheduling and dispatching functions.
Also it helps in advance planning and for purchase of raw materials design and
manufacture of special tools, jigs, fixtures and inspection devices.
It helps in estimating the cost of the product before it is an actually manufactured.
It also helps in planning for man power required for doing the job.

Introduction to Economics-Basic introduction to Economics and basic terms used in engineering economics

  • 1.
    Prepared by Dr. VigneshV Department of Structural Engineering Sanjivani College of Engineering, Kopargaon. EEST241-ENGINEERING ECONOMICS UNIT I INTRODUCTION TO ECONOMICS Introduction to Economics- Flow in an economy, Law of supply and demand, Concept of Engineering Economics – Engineering efficiency, Economic efficiency, Scope of engineering economics- Element of costs, Marginal cost, Marginal Revenue, Sunk cost, Opportunity cost, Break-even analysis- V ratio, Elementary economic Analysis – Material selection for product Design selection for a product, Process planning. 1.1 INTRODUCTION Efficient functioning of any business organization would enable it to provide goods/services at a lower price. In the process of managing organizations, the managers at different levels should take appropriate economic decisions which will help in minimizing investment, operating and maintenance expenditures besides increasing the revenue, savings and such other gains of the organization. These can be achieved through Engineering Economics which deals with the methods that enable one to make economic decisions towards minimizing costs and/or maximizing benefits to business organizations. This chapter discusses the elements of economics and the interaction between its various components. This is followed by an analysis of the need and scope of engineering economics. Later, elements of cost and break-even analysis are presented. 1.2 ECONOMICS It is a study of economic problems of the people concerning production, consumption, exchange and distribution of wealth. Economics is the science that deals with the production and consumption of goods and services and the distribution and rendering of these for human welfare. The following are the economic goals / objectives of economy:
  • 2.
    Prepared by Dr. VigneshV Department of Structural Engineering Sanjivani College of Engineering, Kopargaon. A high level of employment Price stability Efficiency An equitable distribution of income Economic Growth 1.3 FLOW IN ECONOMY Fig. Flow of goods, services, resources and money payments in a simple economy. Households and businesses are the two major entities in a simple economy. Business organizations use various economic resources like land, labor and capital which are provided by households to produce consumer goods and services which will be used by them. Business organizations make payment of money to the households for receiving various resources. The households in turn make payment of money to business organizations for receiving consumer goods and services. This cycle shows the interdependence between the two major entities in a simple economy. 1.4 LAWS OF SUPPLY AND DEMAND Laws of supply Laws of supply - states that the quantity of a commodity supplied varies directly with the price, other determinants of supply remaining constant. If the cost of inputs increases, then naturally, the cost of the product will go up. In such a situation, at the prevailing price of the product the profit margin per unit will be less.
  • 3.
    Prepared by Dr. VigneshV Department of Structural Engineering Sanjivani College of Engineering, Kopargaon. The producers will then reduce the production quantity, which in turn will affect the supply of the product. For instance, if the prices of fertilizers and cost of labor are increased significantly, in agriculture, the profit margin per bag of paddy will be reduced. So, the farmers will reduce the area of cultivation, and hence the quantity of supply of paddy will be reduced at the prevailing prices of the paddy. If there is advancement in technology used in the manufacture of the product in the long run, there will be a reduction in the production cost per unit. This will enable the manufacturer to have a greater profit margin per unit at the prevailing price of the product. Hence, the producer will be tempted to supply more quantity to the market. Weather also has a direct bearing on the supply of products. For example, demand for woolen products will increase during winter. This means the prices of woolen goods will be increased in winter. So, naturally, manufacturers will supply more volume of woolen goods during winter. Factors influencing supply The shape of the supply curve is affected by the following factors: Selling price: As the price increases, sellers like to sell more and vice-versa. Cost of production: As cost of production rise due to increase in the variable factors, supply decreases. Cost of the inputs: The change in technology affects the supply function. If the objective of firm is sales maximization, the supply would be larger. If the number of producers producing the same product increases, the market supply increases. During inflationary period, if sellers expect a further rise in prices, supply will decrease in the market. Imposition of taxes by the government will reduce the supply. Weather Prices of related goods Law of demand Law of demand states that other things being equal demand increases when price falls and contracts when price rises. Market demand is the total quantity demanded by all the purchasers together. Elasticity of Demand - Elasticity of demand may be defined as the degree of responsiveness of quantity demanded to a Change in price.
  • 4.
    Prepared by Dr. VigneshV Department of Structural Engineering Sanjivani College of Engineering, Kopargaon. An interesting aspect of the economy is that the demand and supply of a product are interdependent and they are sensitive with respect to the price of that product. From Fig. it is clear that when there is a decrease in the price of a product, the demand for the product increases and its supply decreases. Also, the product is more in demand and hence the demand of the product increases. At the same time, lowering of the price of the product makes the producers restrain from releasing more quantities of the product in the market. Hence, the supply of the product is decreased. The point of intersection of the supply curve and the demand curve is known as the equilibrium point. At the price corresponding to this point, the quantity of supply is equal to the quantity of demand. Hence, this point is called the equilibrium point. Factors influencing demand The shape of the demand curve is influenced by the following factors: Income of the people Prices of related goods Tastes of consumers Population and its distribution Consumer’s expectations Assumptions of Law of Demand There is no change in consumers Tastes and preferences Income of the people remains constant Prices of other goods should not change There is no substitute for the commodity The commodity should not confer any distinction The demand for the commodity is continuous People should not expect any change in the price of the commodity
  • 5.
    Prepared by Dr. VigneshV Department of Structural Engineering Sanjivani College of Engineering, Kopargaon. 1.5 CONCEPT OF ENGINEERING ECONOMICS Science is a field of study where the basic principles of different physical systems are formulated and tested. Engineering is the application of science. It establishes varied application systems based on different scientific principles. From the discussions in the previous section, it is clear that price has a major role in deciding the demand and supply of a product. Hence, from the organization’s point of view, efficient and effective functioning of the organization would certainly help it to provide goods/services at a lower cost which in turn will enable it to fix a lower price for its goods or services. The following section discusses the different types of efficiency and their impact on the operation of businesses and the definition and scope of engineering economics. . 1.6 TYPES OF EFFICIENCY Efficiency of a system is generally defined as the ratio of its output to input. The efficiency can be classified into technical efficiency and economic efficiency. Technical efficiency It is the ratio of the output to input of a physical system. The physical system may be a diesel engine, a machine working in a shop floor, a furnace, etc. The technical efficiency of a diesel engine is as follows: In practice, technical efficiency can never be more than 100%. This is mainly due to frictional loss and incomplete combustion of fuel, which are considered to be unavoidable phenomena in the working of a diesel engine. Economic efficiency Economic efficiency is the ratio of output to input of a business system.
  • 6.
    Prepared by Dr. VigneshV Department of Structural Engineering Sanjivani College of Engineering, Kopargaon. ‘Worth’ is the annual revenue generated by way of operating the business and ‘cost’ is the total annual expenses incurred in carrying out the business. For the survival and growth of any business, the economic efficiency should be more than 100%. Economic efficiency is also called ‘productivity’. There are several ways of improving productivity. Increased output for the same input Decreased input for the same output By a proportionate increase in the output which is more than the proportionate increase in the input By a proportionate decrease in the input which is more than the proportionate decrease in the output Through simultaneous increase in the output with decrease in the input. 1.7 DEFINITION AND SCOPE OF ENGINEERING ECONOMICS As stated earlier, efficient functioning of any business organization would enable it to provide goods/services at a lower price. In the process of managing organizations, the managers at different levels should take appropriate economic decisions which will help in minimizing investment, operating and maintenance expenditures besides increasing the revenue, savings and other related gains of the organization. Definition Engineering economics deals with the methods that enable one to take economic decisions towards minimizing costs and/or maximizing benefits to business organizations. Scope The issues that are covered are elementary economic analysis, interest formulae, bases for comparing alternatives, present worth method, future worth method, annual equivalent method, rate of return method, replacement analysis, depreciation, evaluation of public alternatives, inflation adjusted investment decisions, make or buy decisions, inventory control, project management, value engineering, and linear programming. 1.8 ELEMENTS OF COSTS Costing or cost accounting means classifying, recording and allocating the appropriate expenditure for determining the cost of production and achieved by keeping a continuous record of all the costs
  • 7.
    Prepared by Dr. VigneshV Department of Structural Engineering Sanjivani College of Engineering, Kopargaon. involved in manufacturing. Costing or cost accounting gives the actual expenditure incurred on the production of the component based on the records of expenditure on various activities involved. Fixed Costs and Variable Costs: The Fixed Costs are the items of expenditure which remain more or less constant irrespective of the quantity or volume of production. Examples of fixed costs are: Supervisory charges, cost of lighting, cost of cleaning the works, operator charges, rent of building, interest on capital, depreciation of plant and building. The Variable Costs are those items of expenditure which vary with quantity or volume of production. Examples are: direct material cost, cost of energy or fuel consumed, cost of tools used, cost of consumables, repair and maintenance charges and storage charges. The total cost of the product can be divided into following two major groups: Direct costs are costs of those factors which directly contribute to the final product and hencecan be directly charged or allocated to the manufacture of a specific product. Examples: cost of raw materials, cost of labor processing the materials, cost of equipment and special tooling, jigs and fixtures used in the manufacturing of the product. Indirect costs are costs which cannot be directly allocated to the manufacture of a particular product. Examples: Wages of inspection and supervisory staff, selling and distribution expenses, administrative expenses, overhead charges, and cost of indirect materials like lubricants, coolants, grease, repair and maintenance cost. Elements of Cost: For the purpose of calculations, the total cost of the product is divided into the following: (A) Material cost, (B) Labor cost, (C) Other expenses. (A) Material Cost Material cost consists of the cost of materials which are used in the manufacture of product. It is divided into the following: Direct material cost: It is the cost of those materials which are directly used for the manufacture of the product and become a part of the finished product. This expenditure can be directly allocated and charged to the manufacture of a specific product or job and includes the scrap and waste that has been cut away from original bar or casting. Indirect material cost: In addition to direct materials a number of other materials are necessary to help in the conversion of direct materials into final shape. Though these materials are consumed
  • 8.
    Prepared by Dr. VigneshV Department of Structural Engineering Sanjivani College of Engineering, Kopargaon. in the production, they don’t become a part of the finished product and their cost cannot be directly booked to the manufacture of a specific product. Such materials are called indirect materials. The indirect materials include oils, general tools, grease, sand papers, coolants, cotton waste etc. The cost associated with indirect materials is called indirect material cost. In some cases certain direct materials like nails, screws, glue, putty etc., are used in such small quantity that it is not considered worthwhile to identify and charge them as direct materials. In such cases these materials are also charged as indirect materials. (B) Labor Cost It is the expenditure made on the salaries, wages, overtime, bonuses, etc. of the employees of the enterprise. It can be classified as: Direct labor cost: Direct laborer is one who actually works and processes the materials to convert it into the final shape. The cost associated with direct labor is called direct labor cost. The direct labor cost can be identified and allocated to the manufacture of a specific product. Examples of the direct labor are the workers operating lathes, milling machines or welders, or assemblers in assembly shop. The direct labor cost may be allocated to a product or job on the basis of time spent by a worker on a job. Indirect labor cost: Indirect laborer is one who is not directly employed in the manufacturing of the product but his services are used in some indirect manner. The indirect labor includes supervisors, inspectors, foreman, storekeeper, gatekeeper, maintenance staff, crane driver etc.The cost associated with indirect labor is called indirect labor cost. The indirect labor costscannot be identified with a particular job or product but are charged on the total number of products made during a particular period in a plant. To make the concept of direct and indirect labor cost clear, consider an operator working on a drilling machine. The operator in this case is direct labor whereas the man supervising the job, inspector and storeman supplying the material are indirect labor. (C) Other Expenses In addition to the material cost and labor cost, several other expenses such as rent of building, depreciation of plant and machinery, cost of packing materials, transport and distribution expenses, wages and salaries of administrative staff and executives are also incurred by the manufacturer. All this expenditure including the indirect material cost and indirect labor cost is called other expenses. Simply, we can say that except direct material and direct labor costs all other expenditure incurred by the manufacturer is known as “Other Expenses”. Expenses are further classified as: (a) Direct expenses: Direct expenses include all that expenditure which can be directly allocated
  • 9.
    Prepared by Dr. VigneshV Department of Structural Engineering Sanjivani College of Engineering, Kopargaon. and charged to a particular job. The direct expenses include cost of special jigs or fixtures, patterns, tooling made for job, or cost of research and development work done for that specific job. (b) Indirect expenses: Except direct expenses, all other indirect expenditure incurred by the manufacturer is called indirect expenses. The indirect expenses are also called overhead expenses or on-cost. The indirect expenses are further classified as: (i) Factory expenses. (ii) Administrative expenses. (iii) Selling and distribution expenses. (i) Factory expenses: Factory expenses comprise of the indirect expenses incurred from the receipt of the order to the completion of production. In addition to indirect material and indirect labor cost it includes rent of factory building, license fee, electricity and telephone bills of factory, insurance charges etc. Factory expenses are also called “Works expenses”, or “Factory or Works overhead”. (ii) Administrative expenses: Administrative expenses or office expenses include the expenditure incurred on control and administration of the factory. It includes the salaries of office and administrative staff, rent of office building, postage and telephone charges, water and electricity charges for office, Director’s fee, legal and audit charges etc. Administrative expenses are also known as ‘Administrative overheads’. (c) Selling and distribution expenses: This is the expenditure incurred on Sales Department for selling the product, i.e., wages, salaries, commission and travelling allowances of salesmen and officers in Sales Department, cost of advertisement, packing, delivery and distribution expenses, rent of warehouses etc. 1.9 COST OF PRODUCT (LADDER OF COSTS) The components of cost discussed above can be grouped as follows: 1. Prime cost = Direct material cost + Direct labour cost + Direct expenses 2. Factory cost = Prime cost + Factory expenses 3. Production cost = Factory cost + Administrative expenses 4. Total or Ultimate cost = Production cost + Selling and distribution expenses. 5. Selling price = Ultimate cost + Profit The above relations can be illustrated on a chart (Ladder of costs)
  • 10.
    Prepared by Dr. VigneshV Department of Structural Engineering Sanjivani College of Engineering, Kopargaon. 1.10 EXAMPLES 1. Calculate prime cost, factory cost, production cost, total cost and selling price per item from the data given below for the year 2003-04: Particulars Rs. Cost of raw material in stock as on 1-04-2003 25,000 Raw material purchased 40,000 Direct labor cost 14,000 Direct expenses 1,000 Factory / Works overhead 9,750 Administrative expenditure 6,500 Selling and distribution expenses 3,250 No. of items produced 650
  • 11.
    Prepared by Dr. VigneshV Department of Structural Engineering Sanjivani College of Engineering, Kopargaon. Net profit/item is 10 percent of total cost of the product. Solution: For 650 units produced during 2003-04 (i) Direct material used = Stock of raw material on 1-04-2003 + raw material purchased – Stock of raw material on 31-03-2004 = 25,000 + 40,000 – 15,000 = Rs. 50,000 (ii) Direct labor = Rs. 14,000 (iii) Direct expenses = Rs. 1,000 Prime cost = 50,000 + 14,000 + 1,000 = Rs. 65,000 Factory cost = Prime cost + Factory expenses = 65,000 + 9,750 = Rs. 74,750 Production cost = Factory cost + Administrative expenses = 74,750 + 6,500 = Rs. 81,250 Total cost = Production cost + Selling expenses = 81,250 + 3,250 = Rs. 84,500 Selling price = 84,500 + 10 percent of 84,500 = 84,500 × 1.10 = Rs. 92,950 Prime cost/item = 65,000 / 650 = Rs. 100 Factory cost/item = 74,750 / 650 = Rs. 115 Production cost/item = 81,250 / 650 = Rs. 125 Total cost/item = 84,500 / 650 = Rs. 130 Selling price/item = 92,950 / 650 = Rs. 143 2. From the following data for a sewing machine manufacturer, prepare a statement showing prime cost, Works/factory cost, production cost, total cost and profit. Cost of raw material in stock as on 31-03-2004 15,000 Particulars Rs. Value of stock of material as on 1-04-2003 26,000 Material purchased 2,74,000
  • 12.
    Prepared by Dr. VigneshV Department of Structural Engineering Sanjivani College of Engineering, Kopargaon. General administrative expenses 3,400 Water, power and telephone bills of factory 9,600 Water, lighting and telephone bills of office 2,500 Material transportation in factory 2,000 Insurance and rent of office building 2,000 Direct expenses 5,000 Commission and pay of salesman 10,500 Repair and maintenance of plant 1,000 Works Manager salary 30,000 Salary of office staff 60,000 Value of stock of material as on 31-03-2004 36,000 Sale of products 6,36,000 Solution: (i) Material cost = Opening stock value + Material purchases – Closing balance = 26,000 + 2,74,000 – 36,000 = Rs. 2,64,000 Prime cost = Direct material cost + Direct labor cost + Direct expenses = 2,64,000 + 1,20,000 + 5,000 = Rs. 3,89,000 (ii) Factory overheads are: Rent 16,000 Depreciation of plant and machinery 8,000 Water, power and telephone bills of factory 9,600 Material transportation in factory 2,000 Repair and maintenance of plant 1,000 Work Manager salary 30,000 Factory overheads 66,600 Factory cost = Prime cost + Factory expenses = 3,89,000 + 66,600 = Rs. 4,55,600 (iii) Administrative/office expenses are: Depreciation of office equipment 2,000 General administrative expenses 3,400 Water, lighting and telephone bills of office 2,500 Rent, insurance and taxes on office building 2,000 Wages to labor 1,20,000 Depreciation of plant and machinery 8,000 Depreciation of office equipment 2,000 Rent, taxes and insurance of factory 16,000
  • 13.
    Prepared by Dr. VigneshV Department of Structural Engineering Sanjivani College of Engineering, Kopargaon. Salary of office staff 60,000 Office expenses 69,900 Production cost = Factory cost + Office expenses = Rs. 4,55,600 + Rs. 69,900 = Rs. 5,25,500 (iv)Selling overheads are: Commission and pay to salesmen = Rs. 10,500 Total cost = Production cost + Selling expenses = 5,25,500 + 10,500 = Rs. 5,36,000 (v) Profit = Sales – Total cost = 6,36,000 – 5,36,000 = Rs. 1,00,000 1.11 OTHER COST 1. Marginal Cost Marginal cost of a product is the cost of producing an additional unit of that product. Let the cost of producing 20 units of a product be Rs. 10,000, and the cost of producing 21 units of the same product be Rs. 10,045. Then the marginal cost of producing the 21st unit is Rs. 45. 2. Marginal Revenue Marginal revenue of a product is the incremental revenue of selling an additional unit of that product. Let, the revenue of selling 20 units of a product be Rs. 15,000 and the revenue of selling 21 units of the same product be Rs. 15,085. Then, the marginal revenue of selling the 21st unit is Rs. 85. 3. Sunk Cost This is known as the past cost of an equipment/asset. Let us assume that an equipment has been purchased for Rs. 1,00,000 about three years back. If it is considered for replacement, then its present value is not Rs. 1,00,000. Instead, its present market value should be taken as the present value of the equipment for further analysis. So, the purchase value of the equipment in the past is known as its sunk cost. The sunk cost should not be considered for any analysis done from now onwards. 4. Opportunity Cost In practice, if an alternative (X) is selected from a set of competing alternatives (X, Y), then the corresponding investment in the selected alternative is not available for any other purpose. If the same money is invested in some other alternative (Y), it may fetch some return. Since the money is invested in the selected alternative (X), one has to forego the return from the other alternative (Y). The amount that is foregone by not investing in the other alternative (Y) is known as the opportunity cost of the selected alternative (X). So the opportunity cost of an alternative is the return that will be foregone by not investing the same money in another alternative. Consider that a person has invested a sum of Rs. 50,000 in shares. Let the expected annual return by this alternative be Rs. 7,500. If the same amount is invested in a fixed deposit, a bank will pay a return of 18%. Then, the corresponding total return per year for the investment in the bank is Rs. 9,000. This return is greater than the return from shares. The foregone excess return of Rs. 1,500
  • 14.
    Prepared by Dr. VigneshV Department of Structural Engineering Sanjivani College of Engineering, Kopargaon. by way of not investing in the bank is the opportunity cost of investing in shares. 1.12 TERMS USED IN BREAK-EVEN ANALYSIS (i) Fixed cost: Fixed costs remain fixed in the short-run. Examples are rent, insurance, depreciation, factory supervisor's salaries, directors' salaries, and so on. (ii) Variable costs: The variable cost per unit varies with the volume of production. The variable costs include cost of direct materials, direct labor, direct expenses and operating supplies such as lubricating oil and so on. (iii) Total cost: The total of fixed and variable costs. (iv) Total revenue: The sales proceeds (selling price per unit x number of units sold). (v) Contribution margin: The contribution margin is the difference between the selling price per unit and the variable cost per unit. It is also determined as (fixed cost per unit +profit per unit). (vi) Profit = Contribution - Fixed cost. (vii) Contribution margin ratio: It is the ratio between contribution per unit and the selling price per unit. (viii) Margin of safety in units: The excess of actual sales (in units) minus the breakeven point (in units). (ix) Margin of safety in sales volume: The excess of actual sales (in rupees) minus the break- even point (in rupees). (x) Angle of incidence: The angle formed where total cost curve cuts the total revenue curve (xi) PN ratio: The ratio between the contribution and sales. 1.13 ASSUMPTIONS IN THE BREAK-EVEN ANALYSIS The following assumptions are made while plotting a break-even chart: The total cost of production can be divided into two categories - (a) Fixed cost, (b) Variable cost. Fixed cost remains constant i.e., it is independent of the quantity produced and includes executive’s salaries, rent of building, depreciation of plant and equipment etc. The variable cost varies directly and proportionately with the volume of production. If V = Variable cost per unit and Q is the quantity produced, variable cost = V x Q. The selling price does not change with change in the volume of sales. If P is the selling price per unit, the total sales income = P x Q.
  • 15.
    Prepared by Dr. VigneshV Department of Structural Engineering Sanjivani College of Engineering, Kopargaon. The firm deals with only one product, or the sales mix remains unchanged. There is a perfect synchronization between production and sales. This assumes that everything produced is sold and there is no change in the inventory of finished goods. Productivity per worker and efficiency of plant, etc., remains mostly unchanged. Any change in anyone of the above factors will affect the break-even point and the profits will be affected by factors other than volume. Hence, the result of the break-even analysis should be interpreted subject to the limitations of the above assumptions. 1.14 PLOTTING THE BREAK-EVENCHART The cost and the sales income (revenue) in rupees are plotted along the vertical axis. The quantity (volume of production) is plotted along the horizontal axis. Fixed cost is represented by a straight line parallel to the horizontal axis. The variable costs are superimposed upon the horizontal line representing the fixed cost. This top line then represents the total cost line. The sales income line passes through the origin. The point of intersection of the sales income line and the total cost line represents the break- even point. The shaded area between the total cost line and the sales income line on the left hand side of B.E.P. indicates loss; whereas the shaded area on the right hand side of B.E.P. shows profit. 1.15 Break-Even Analysis The main objective of break-even analysis is to find the cut-off production volume from where a firm will make profit.
  • 16.
    Prepared by Dr. VigneshV Department of Structural Engineering Sanjivani College of Engineering, Kopargaon. Let s = selling price per unit v = variable cost per unit FC = fixed cost per period Q = volume of production The total sales revenue (S) of the firm is given by the following formula: S = s Q The total cost of the firm for a given production volume is given as TC = Total variable cost + Fixed cost = v Q + FC The linear plots of the above two equations are shown in Fig. The intersection point of the total sales revenue line and the total cost line is called the break-even point. The corresponding volume of production on the X-axis is known as the break-even sales quantity. At the intersection point, the total cost is equal to the total revenue. This point is also called the no-loss or no-gain situation. For any production quantity which is less than the break-even quantity, the total cost is more than the total revenue. Hence, the firm will be making loss. For any production quantity which is more than the break-even quantity, the total revenue will be more than the total cost. Hence, the firm will be making profit. Profit = Sales – (Fixed cost + Variable costs) = s Q – (FC + v Q) The formulae to find the break-even quantity and break-even sales quantity:
  • 17.
    Prepared by Dr. VigneshV Department of Structural Engineering Sanjivani College of Engineering, Kopargaon. The contribution is the difference between the sales and the variable costs. The margin of safety (M.S.) is the sales over and above the break-even sales. The formulae to compute these values are Contribution = Sales – Variable costs Contribution/unit = Selling price/unit – Variable cost/unit M.S. = Actual sales – Break-even sales = Profit × sales / Contribution M.S. as a per cent of sales = (M.S./Sales) 100 1.16 Break-even point The point of intersection of the total cost line and the income line is called as the break-even point. The break-even point is that junction here income and costs are exactly in balance. Thus there is neither profit nor loss for that particular volume of production. Break-even point indicates minimum operating level below which it is dangerous to fall. As the performance reaches towards this non-profit point, corrective measures should be taken to cut down the cost, (increase output or raise selling price.) The spread to the right of BEP shows the profit potential while to the left represents the loss potential BEP is also called as the "no-profit- no-loss point." 1.17 Margin of Safety Margin of safety is the distance between the break-even point and the output being produced. A large margin of safety indicates that the business can earn profit even if there is a great reduction in output. If the margin of safety is relatively small then it indicates that the profit will be considerably small even if there is a small drop in output. A low margin of safety level indicates
  • 18.
    Prepared by Dr. VigneshV Department of Structural Engineering Sanjivani College of Engineering, Kopargaon. high fixed costs and profits are not possible unless the output level is sufficient enough to absorb fixed costs. Margin of safety is generally expressed as: Ratio of budgeted sales to sales at BEP. Ratio of actual sales to sales at BEP. Percentage of budget to BEP. Percentage of budget to actual sales at BEP. Percentage of the difference between actual sales and break-even sales to budgeted sales. In case unsatisfactory margin of safety the following measures should be taken: Increase in the sale price. Reduction in fixed costs. Reduction in variable costs. Increase in output. Stop production of non-profitable items and pay more attention towards profitable items. Mathematically: Margin of Safety = (Sales - Sales at BEP / Sales) x 100 = Profit x Sales / (Sales - Variable costs) 1.18 Angle of Incidence The angle between the sales income line and the total cost line is called as angle of incidence. A large angle of incidence indicates large profit and extremely favorable business position management aims to widen the angle of incidence to improve the rate of profitability. A narrow angle shows that even though fixed overheads are recovered, the profit accrued shows a low rate of return. This indicates a large part of variable costs in total cost. 1.10 Profit/Volume Ratio (P/V Ratio) P/V ratio is a valid ratio which is useful for further analysis. Profit volume ratio measures the profitability in relation to sales. The contribution at given output is defined to be the difference between total sales and total variable costs. The P/V ratio is the ratio of contribution to sales. It represents the relationship between contribution and turn-over. So, it is a measure to compare profitability of different products. Higher the P/V ratio, the high yielding is the product. The different formulae for the P/V ratio are as follows: P/V ratio = Contribution / Sales = Sales − Variable costs / Sales The relationship between BEP and P/V ratio is as follows: BEP =Fixed cost / P/V ratio
  • 19.
    Prepared by Dr. VigneshV Department of Structural Engineering Sanjivani College of Engineering, Kopargaon. Uses of P/V ratio The P/V ratio can be used to study a variety of problems viz.: Determination of B.E.P. To know profit for given sales volume. To now sales volume for achieving some desired profit. P/V ratio can be increased by Increasing the selling price. Changing the mix of sales. Reduction in variable costs. 1.19 ADVANTAGES OF BREAK-EVEN CHART Management can employ break-even chart to project the cost and income picture under various anticipated future conditions and for alternative business programme. Hence, the chart is useful to the management. To show the relative importance of different classes of costs, how they vary with volume of production, and how they may be controlled. To show the impact of changes in sales volume on profit. To predict the effect of price and cost changes on the break-even point. To show the gain needed in sales volume (or productivity) to maintain profits when prices or costs change in a specific way e.g. when prices decline but wages and the cost of material do not. To select the proper size plant or to predict the effect of changes in plant size or modernization of plant on the break-even point. Therefore, through break-even chart management can estimate what amount of investment in plant capacity is economically justified for the projected volume of sales. To compare the profitability of two or more firms. 1.20 LIMITATIONS OF BREAK-EVEN ANALYSIS In practice all the costs are not always either fixed costs or variable costs. There are some semi-variable overhead costs. In the long run all costs are variable, so the break-even analysis holds good only for short run requirements. Break even analysis assumes, that profits are a function of output ignoring the fact that they are also affected by technological changes, improved management, improvement in quality, versatility, etc.
  • 20.
    Prepared by Dr. VigneshV Department of Structural Engineering Sanjivani College of Engineering, Kopargaon. It is suitable only when the firm produces one type of product. 1.21 APPLICATION OF BREAK-EVEN ANALYSIS Make or Buy Decision Choosing a Product Mix when there is a Limiting Factor Drop or add decision Impact of changes in cost or selling price on BEP Determining the BEP when there is an increase in the fixed cost 1.22 EXAMPLE: Alpha Associates has the following details: Fixed cost = Rs. 20,00,000 Variable cost per unit = Rs. 100 Selling price per unit = Rs. 200 Find (a) The break-even sales quantity, (b) The break-even sales (c) If the actual production quantity is 60,000, find (i) contribution; and (ii) margin of safety by all methods. Solution Fixed cost (FC) = Rs. 20,00,000 Variable cost per unit (v) = Rs. 100 Selling price per unit (s) = Rs. 200 (a) Break-even quantity = FC / s – v = 20,00,000 / 100 = 20,000 units (b) Break-even sales = (FC / s – v) x s = 20,000 x 200 = Rs. 40,00,000 (c) (i) Contribution = Sales – Variable cost = s x Q – v x Q = 200 x 60000 – 100 x 60000 = 1,20,00,000 – 60,00,000 = Rs. 60,00,000 (ii) Margin of safety M.S. = Sales – Break-even sales = 60,000 x 200 – 40,00,000 = = Rs. 80,00,000 M.S. as a per cent of sales = 80,00,000 / 1,20,00,000 x 100 = 67% 1.23 Elementary Economic Analysis Whether it is a business situation or a day-to-day event in somebody’s personal life, there are a
  • 21.
    Prepared by Dr. VigneshV Department of Structural Engineering Sanjivani College of Engineering, Kopargaon. large number of economic decisions making involved. One can manage many of these decision problems by using simple economic analysis. For example, an industry can source its raw materials from a nearby place or from a far-off place. In this problem, the following factors will affect the decision: Price of the raw material Transportation cost of the raw material Availability of the raw material Quality of the raw material Consider the alternative of sourcing raw materials from a nearby place with the following characteristics: The raw material is more costly in the nearby area. The availability of the raw material is not sufficient enough to support the operation of the industry throughout the year. The raw material requires pre-processing before it is used in the production process. This would certainly add cost to the product. The cost of transportation is minimal under this alternative. On the other hand, consider another alternative of sourcing the raw materials from a far-off place with the following characteristics: The raw material is less costly at the far off place. The cost of transportation is very high. The availability of the raw material at this site is abundant and it can support the plant throughout the year. The raw material from this site does not require any preprocessing before using it for production 1.24 EXAMPLES FOR SIMPLE ECONOMIC ANALYSIS In this section, the concept of simple economic analysis is illustrated using suitable examples in the following areas: Material selection for a product Design selection for a product Design selection for a process industry Building material selection for construction activities Process planning/Process modification 1.24.1 Material Selection for a Product/Substitution Of Raw Material
  • 22.
    Prepared by Dr. VigneshV Department of Structural Engineering Sanjivani College of Engineering, Kopargaon. The cost of a product can be reduced greatly by substitution of the raw materials. Among various elements of cost, raw material cost is most significant and it forms a major portion of the total cost of any product. So, any attempt to find a suitable raw material will bring a reduction in the total cost in any one or combinations of the following ways: Reduced machining/process time Enhanced durability of the product Cheaper raw material price Therefore, the process of raw material selection/substitution will result in finding an alternate raw material which will provide the necessary functions that are provided by the raw material that is presently used. In this process, if the new raw material provides any additional benefit, then it should be treated as its welcoming feature. EXAMPLE In the design of a jet engine part, the designer has a choice of specifying either an aluminium alloy casting or a steel casting. Either material will provide equal service, but the aluminium casting will weigh 1.2 kg as compared with 1.35 kg for the steel casting. The aluminium can be cast for Rs. 80.00 per kg and the steel one for Rs. 35.00 per kg. The cost of machining per unit is Rs. 150.00 for aluminium and Rs. 170.00 for steel. Every kilogram of excess weight is associated with a penalty of Rs. 1,300 due to increased fuel consumption. Which material should be specified and what is the economic advantage of the selection perunit? Solution: (a) Cost of using aluminium metal for the jet engine part: Weight of aluminium casting/unit = 1.2 kg Cost of making aluminium casting = Rs. 80.00 per kg Cost of machining aluminium casting per unit = Rs. 150.00 Total cost of jet engine part made of aluminium/unit = Cost of making aluminium casting/unit + Cost of machining aluminium casting/unit = 80 x1.2 + 150 = 96 + 150 = Rs. 246 (b) Cost of jet engine part made of steel/unit: Weight of steel casting/unit = 1.35 kg Cost of making steel casting = Rs. 35.00 per kg
  • 23.
    Prepared by Dr. VigneshV Department of Structural Engineering Sanjivani College of Engineering, Kopargaon. Cost of machining steel casting per unit = Rs. 170.00 Penalty of excess weight of steel casting = Rs. 1,300 per kg Total cost of jet engine part made of steel/unit = Cost of making steel casting/unit + Cost of machining steel casting/unit + Penalty for excess weight of steel casting = 35 x 1.35 + 170 + 1,300(1.35 – 1.2) = Rs. 412.25 DECISION The total cost/unit of a jet engine part made of aluminium is less than that for an engine made of steel. Hence, aluminium is suggested for making the jet engine part. The economic advantage of using aluminium over steel/unit is Rs. 412.25 – Rs. 246 = Rs. 166.25 1.24.2 Design Selection for a Product The design modification of a product may result in reduced raw material requirements, increased machinability of the materials and reduced labor. Design is an important factor which decides the cost of the product for a specified level of performance of that product. The elementary economic analysis applied to the selection of design for a product is illustrated with example problems. EXAMPLE Two alternatives are under consideration for a tapered fastening pin. Either design will serve the purpose and will involve the same material and manufacturing cost except for the lathe and grinder operations. Design A will require 16 hours of lathe time and 4.5 hours of grinder time per 1,000 units. Design B will require 7 hours of lathe time and 12 hours of grinder time per 1,000 units. The operating cost of the lathe including labor is Rs. 200 per hour. The operating cost of the grinder including labor is Rs. 150 per hour. Which design should be adopted if 1,00,000 units are required per year and what is the economic advantage of the best alternative? Solution Operating cost of lathe including labor = Rs. 200 per hr Operating cost of grinder including labor = Rs. 150 per hr (a) Cost of design A No. of hours of lathe time per 1,000 units = 16 hr No. of hours of grinder time per 1,000 units = 4.5 hr Total cost of design A/1,000 units = Cost of lathe operation per 1,000 units + Cost of grinder operation per 1,000 units = 16 x 200 + 4.5 x 150 = Rs. 3,875
  • 24.
    Prepared by Dr. VigneshV Department of Structural Engineering Sanjivani College of Engineering, Kopargaon. Total cost of design A/1,00,000 units = 3,875 x 1,00,000/1,000 = Rs. 3,87,500 (b) Cost of design B No. of hours of lathe time per 1,000 units = 7 hr No. of hours of grinder time per 1,000 units = 12 hr Total cost of design B/1,000 units = Cost of lathe operation/1,000 units + Cost of grinder operation/1,000 units = 7 x 200 + 12 x 150 = Rs. 3,200 Total cost of design B/1,00,000 units = 3,200 x 1,00,000/1,000 = Rs. 3,20,000 DECISION The total cost/1,00,000 units of design B is less than that of design A. Hence, design B is recommended for making the tapered fastening pin. Economic advantage of the design B over design A per 1,00,000 units = Rs. 3,87,500 – Rs. 3,20,000 = Rs. 67,500. 1.25 Process Planning Process plan It is the detailed instructions for making a part or a component. It includes such information as the operations, their sequence, machines, tools, speeds and feeds, dimensions, tolerances, stock removed, inspection procedures and time standards (i.e., cycle time). Process planning It may be defined as the determination of the processes and the sequence of operations required for making the product. It consists of devising, selecting and specifying processes, machine tools and other equipment to transform the raw material into finished product as per the specifications called for by the drawings. Process planning can be defined as an act of preparing a detailed processing documentation for the manufacture of a piece part or assembly. Process Planning Activities Analysis of the finished part requirements as specified in the engineering design Determining the sequence of operation required Selecting the proper equipment to accomplish the required operations Calculating the specific operation setup times and cycle times on each machine Documenting the established process plans Communicating the manufacturing knowledge to the shop floor 1. Analyze finished part requirements Component drawing should be analyzed to identify its features, dimensions, and
  • 25.
    Prepared by Dr. VigneshV Department of Structural Engineering Sanjivani College of Engineering, Kopargaon. tolerance specifications Part’s requirement defined by its features, dimensions, and tolerance specifications will determine corresponding processing requirements 2. Determine operating sequence Basic aim is to determine the type of processing operation that has the capability to generate various types of features, given the tolerance requirements There are two ways of viewing decision process First view is to consider processing evaluation of part from rough state to finished final state. In this view material is removed or modified on rough part in stages in order to transform it into finished part Second view is to consider part evaluation from finished state back to rough/ initial state. In this view material is added back onto the part. 3. Select machines Machine selection requires determining how the part would be processed on each of the alternative machines so that best machine can be selected At this phase, firm has to decide whether to make or buy the component part Break even analysis is most convenient method for selecting optimum method of manufacture or machine amongst the competing ones Factures which influence the selection of machine are, ➢ Economic considerations ➢ Production rate and unit cost of production ➢ Durability and dependability ➢ Lower process rejection ➢ Minimum set-up and put away times ➢ Longer productive life of machines or equipment ➢ Functional versatility 4. Material selection parameters Function Appearance Reliability Service life Environment Compatibility Productivity Cost
  • 26.
    Prepared by Dr. VigneshV Department of Structural Engineering Sanjivani College of Engineering, Kopargaon. 5. Calculate processing time Determination of set-up times requires knowledge of available tooling and sequence of steps necessary to prepare the machine for processing given work piece For establishing accurate set-up times, detailed knowledge of equipment capacity, tooling, and shop practice required Calculation of part processing time requires determination of sequence of processing steps on each machine. This is called as OUTPLANNING After calculation of processing time, appropriate times for loading, part unloading, machine indexing, and other factors involved in one complete cycle for processing a part must be included to compute the expected machine cycle time Allowances are added with machine cycle time to calculate standard cycle time for processing one piece Appropriate machine rates are added with calculated cycle time to calculate expected standard cost for given operation 6. Document process planning Process plan is documented as job routing or operation sheet Operation sheet also called “route sheet”, “instruction sheet”, “traveler”, “planner” Information provided by route sheet are, ➢ Part identification ➢ Description of processing steps in each operation ➢ Operation sequence and machines ➢ Standard set-up and cycle times ➢ Tooling requirements for each operation ➢ Production control information showing the planning lead time at each operation Reasons for documentation To have a record on hoe a part is processed in order to plan future parts with similar design requirements in a consistent manner To provide a record for future job quoting, cost estimating, and standard costing systems To act as a vehicle for communication 7. Communicate process knowledge Communication is essential to ensure that part will be processed according to most economical way Process documentation and communication provide basis for improved part consistency and quality in manufacturing Process Planning Sheet
  • 27.
    Prepared by Dr. VigneshV Department of Structural Engineering Sanjivani College of Engineering, Kopargaon. The whole information determined by the process planning is recorded in a tabular form in a sheet called process planning sheet. This document is provided to the shop personnel for their use. The character of this sheet will vary for different organizations depending upon the production conditions and degree of details required. In general the following data is listed for each component of the product in the process sheet. Information regarding the main product, of which the component being manufactured is a part i.e., name and part number of the main product. Name, part number, drawing number of the component and number off i.e., no. of components required per product. Information concerning the blank i.e., raw material used, size and weight of stock. Operations are listed in proper sequence along with the shops in which these operations will be performed. Information regarding machines used for each operation. Data on jigs, fixtures and other special tools required. Inspection devices needed for inspection. Cutting data i.e., speeds, feeds & depth of cut for each machining operation. Elements of standard time such as set-up time, handling time and machining time for the job. A typical process sheet is shown in Table.
  • 28.
    Prepared by Dr. VigneshV Department of Structural Engineering Sanjivani College of Engineering, Kopargaon. The process planning sheet is prepared by the process engineer in consultation with the tool engineer, industrial engineer, or methods engineer.
  • 29.
    Prepared by Dr. VigneshV Department of Structural Engineering Sanjivani College of Engineering, Kopargaon. USES OF PROCESS SHEET A process sheet is a very important document which forms a basis for all planning, scheduling and dispatching functions. Also it helps in advance planning and for purchase of raw materials design and manufacture of special tools, jigs, fixtures and inspection devices. It helps in estimating the cost of the product before it is an actually manufactured. It also helps in planning for man power required for doing the job.