LEARNING
OUTCOMES
AFTER READING THEWHOLE CHAPTER, THE STUDENT IS EXPECTED
TO BE ABLE TO:
Define economics and distinguish between
microeconomics and macroeconomics
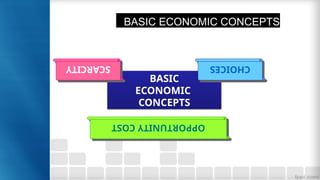
Describe basic economic concepts: scarcity, choices
and opportunity cost
Use the production possibilities curve to explain the
basic economic concepts
3.
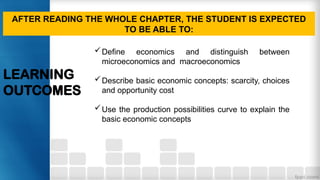
WHAT IS ECONOMICS?
limited
resources
unlimited
wants
Ascience that
studies human
behavior as a
relationship
between ends
and scarce
means which
have alternative
uses.’
The study of
how people
satisfy wants
with scarce
resourse
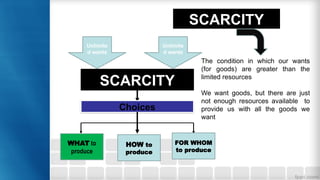
SCARCITY
Unlimite
d wants
Unlimite
d wants
SCARCITY
Choices
WHATto
produce
HOW to
produce
FOR WHOM
to produce
The condition in which our wants
(for goods) are greater than the
limited resources
We want goods, but there are just
not enough resources available to
provide us with all the goods we
want
8.
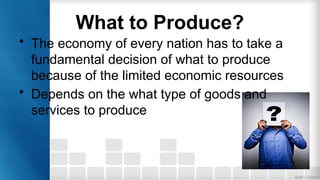
What to Produce?
•The economy of every nation has to take a
fundamental decision of what to produce
because of the limited economic resources
• Depends on the what type of goods and
services to produce
9.
How To Produce
•Depends on the cheapest method of
production
• There are alternative techniques of
producing goods and services
10.
For Whom ToProduce
• Depends on the distribution of income
• Example: Who will drive the latest model
of an imported car
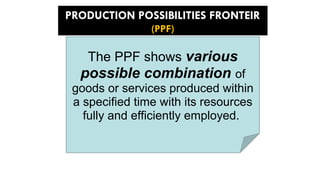
PRODUCTION POSSIBILITIES FRONTEIR
(PPF)
ThePPF shows various
possible combination of
goods or services produced within
a specified time with its resources
fully and efficiently employed.
18.
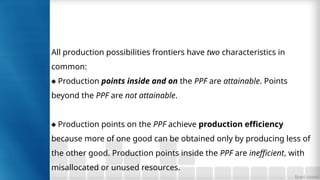
All production possibilitiesfrontiers have two characteristics in
common:
♦ Production points inside and on the PPF are attainable. Points
beyond the PPF are not attainable.
♦ Production points on the PPF achieve production efficiency
because more of one good can be obtained only by producing less of
the other good. Production points inside the PPF are inefficient, with
misallocated or unused resources.
19.
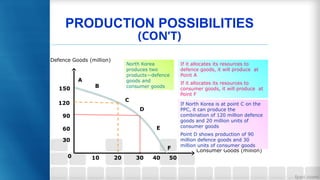
Consumer Goods (million)
DefenceGoods (million)
PRODUCTION POSSIBILITIES
(CON’T)
North Korea
produces two
products—defence
goods and
consumer goods
If North Korea is at point C on the
PPC, it can produce the
combination of 120 million defence
goods and 20 million units of
consumer goods
Point D shows production of 90
million defence goods and 30
million units of consumer goods
D
C
B
E
If it allocates its resources to
defence goods, it will produce at
Point A
If it allocates its resources to
consumer goods, it will produce at
Point F
A
F
40 50
0 10 20 30
90
60
120
150
30
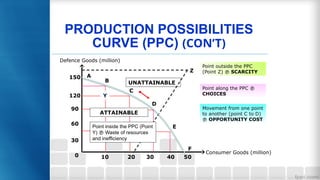
20.
Point along thePPC
CHOICES
Point outside the PPC
(Point Z) SCARCITY
UNATTAINABLE
PRODUCTION POSSIBILITIES
CURVE (PPC) (CON’T)
Movement from one point
to another (point C to D)
OPPORTUNITY COST
Defence Goods (million)
Consumer Goods (million)
F
Z
D
C
A
B
E
120
40
60
50
30
90
150
0 10 20 30
Y
ATTAINABLE
Point inside the PPC (Point
Y) Waste of resources
and inefficiency
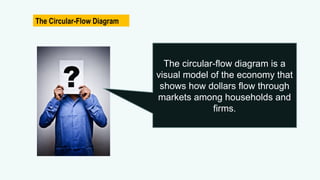
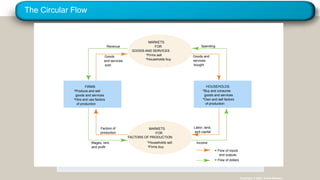
The Circular-Flow Diagram
Thecircular-flow diagram is a
visual model of the economy that
shows how dollars flow through
markets among households and
firms.
Firms
• Produce andsell goods and services
• Hire and use factors of production
Households
• Buy and consume goods and services
• Own and sell factors of production
26.
Markets for Goodsand Services
• Firms sell
• Households buy
Markets for Factors of Production
• Households sell
• Firms buy
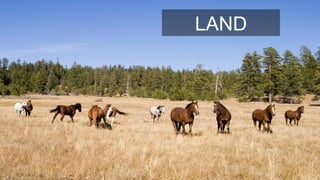
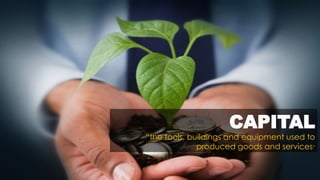
Factors of Production
• Inputs used to produce goods and services
• Land, labor, and capital
27.
SUMMARY
• Economists tryto address their subjects with a scientist’s
objectivity.
• They make appropriate assumptions and build simplified models in
order to understand the world around them.
• Two simple economic models are the circular-flow diagram and the
production possibilities frontier.
28.
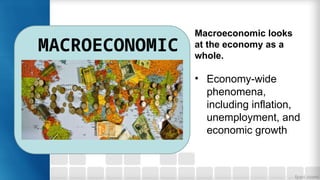
SUMMARY
• Economics isdivided into two subfields:
• Micro economists study decision-making by households
and firms in the marketplace.
• Macroeconomists study the forces and trends that affect the
economy as a whole