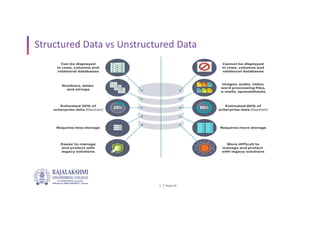
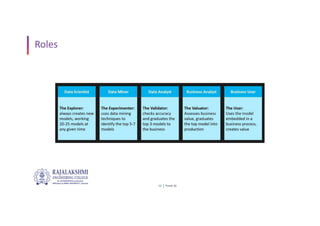
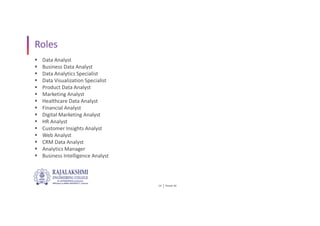
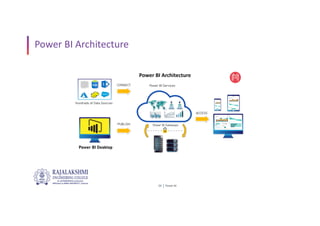
Power BI
1
Introduction to Data Visualization and its Applications
B.Bhuvaneswaran
28 September 2022
Power BI
2
Data?
 Industries
 E-Commerce
 Retailers
 Social Media
 Food (Online/Offline)
 Email/Photos/Videos
 Calling
Power BI
3
Data
Power BI
4
Structured Data vs Unstructured Data
Power BI
5
Structured Data vs Unstructured Data
Power BI
6
Data Processing
 Data Preprocessing is a technique that is used to convert the raw
data into a clean data set.
 In other words, whenever the data is gathered from different
sources it is collected in raw format which is not feasible for the
analysis.
Power BI
7
Data Wrangling
 Data Wrangling is a technique that is executed at the time of
making an interactive model.
 In other words, it is used to convert the raw data into a format
that is convenient for the consumption of data.
Power BI
8
Data Preparation
 Data Cleaning
 Data Integration
 Data Transformation
 Data Reduction
Power BI
9
Data Wrangling
 Discovering
 Structuring
 Cleaning
 Validating
 Publishing
Power BI
10
Dashboard and Reporting
Power BI
11
Data Analytics vs Business Analytics
 Business Analytics is specific to business-related problems like
cost, profit, etc.
 Data Analytics answers questions like the influence of geography,
seasonal factors, and customer preferences on the business.
 Business analytics is the analysis of company data with statistical
concepts to get solutions and insights.
 Data Analytics combines data with algorithm building like adding
Visualization Insights and technology to draw the answers to a
range of questions.
Power BI
12
Process of Data Analysis
Power BI
13
Roles
Power BI
14
Roles
 Data Analyst
 Business Data Analyst
 Data Analytics Specialist
 Data Visualization Specialist
 Product Data Analyst
 Marketing Analyst
 Healthcare Data Analyst
 Financial Analyst
 Digital Marketing Analyst
 HR Analyst
 Customer Insights Analyst
 Web Analyst
 CRM Data Analyst
 Analytics Manager
 Business Intelligence Analyst
Power BI
15
Tools
 SQL
 Tableau Public
 Power BI Desktop
Power BI
16
Datasets
 Kaggle
 Google Public Datasets
 healthdata.gov
 WHO - Covid Data
Power BI
17
Case Study-Global Store Data Analysis
 Importing the dataset
 Data Manipulating and Joining
 Data Visualization, Geo Maps and Complex Visuals
 Decision making and indepth analysis
Power BI
18
Power BI Architecture
 Data Integration
 Data Transforming
 Report & Publish
 Creating and Dashboard
Power BI
19
Power BI Architecture
 Power BI Architecture
 Power BI Desktop - Visualization
 Power BI Editor - Structure and Exploration of the data
 Power BI Service - Sharing the dashboards online, within a team
Power BI
20
Power BI Architecture
Queries…?
Thank You…!

Introduction to Data Visualization and its Applications.pdf

  • 1.
    Power BI 1 Introduction toData Visualization and its Applications B.Bhuvaneswaran 28 September 2022
  • 2.
    Power BI 2 Data?  Industries E-Commerce  Retailers  Social Media  Food (Online/Offline)  Email/Photos/Videos  Calling
  • 3.
  • 4.
    Power BI 4 Structured Datavs Unstructured Data
  • 5.
    Power BI 5 Structured Datavs Unstructured Data
  • 6.
    Power BI 6 Data Processing Data Preprocessing is a technique that is used to convert the raw data into a clean data set.  In other words, whenever the data is gathered from different sources it is collected in raw format which is not feasible for the analysis.
  • 7.
    Power BI 7 Data Wrangling Data Wrangling is a technique that is executed at the time of making an interactive model.  In other words, it is used to convert the raw data into a format that is convenient for the consumption of data.
  • 8.
    Power BI 8 Data Preparation Data Cleaning  Data Integration  Data Transformation  Data Reduction
  • 9.
    Power BI 9 Data Wrangling Discovering  Structuring  Cleaning  Validating  Publishing
  • 10.
  • 11.
    Power BI 11 Data Analyticsvs Business Analytics  Business Analytics is specific to business-related problems like cost, profit, etc.  Data Analytics answers questions like the influence of geography, seasonal factors, and customer preferences on the business.  Business analytics is the analysis of company data with statistical concepts to get solutions and insights.  Data Analytics combines data with algorithm building like adding Visualization Insights and technology to draw the answers to a range of questions.
  • 12.
  • 13.
  • 14.
    Power BI 14 Roles  DataAnalyst  Business Data Analyst  Data Analytics Specialist  Data Visualization Specialist  Product Data Analyst  Marketing Analyst  Healthcare Data Analyst  Financial Analyst  Digital Marketing Analyst  HR Analyst  Customer Insights Analyst  Web Analyst  CRM Data Analyst  Analytics Manager  Business Intelligence Analyst
  • 15.
    Power BI 15 Tools  SQL Tableau Public  Power BI Desktop
  • 16.
    Power BI 16 Datasets  Kaggle Google Public Datasets  healthdata.gov  WHO - Covid Data
  • 17.
    Power BI 17 Case Study-GlobalStore Data Analysis  Importing the dataset  Data Manipulating and Joining  Data Visualization, Geo Maps and Complex Visuals  Decision making and indepth analysis
  • 18.
    Power BI 18 Power BIArchitecture  Data Integration  Data Transforming  Report & Publish  Creating and Dashboard
  • 19.
    Power BI 19 Power BIArchitecture  Power BI Architecture  Power BI Desktop - Visualization  Power BI Editor - Structure and Exploration of the data  Power BI Service - Sharing the dashboards online, within a team
  • 20.
  • 21.
  • 22.