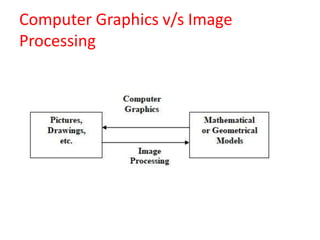
• Computer Graphicsis a field related to the
generation of graphics using computers.
• It includes the creation, storage, and
manipulation of images of objects.
• These objects come from diverse fields such
as physical, mathematical, engineering,
architectural, abstract structures and natural
phenomenon.
3.
• Computer graphicstoday is largely interactive,
that is , the user controls the contents,
structure, and appearance of images of the
objects by using input devices.
4.
• Until theearly 1980's computer graphics was a
small, specialized field,
• largely because the hardware was expensive
and graphics-based application programs that
were easy to use and cost-effective were few.
5.
• Personal computerswith built-in raster
graphics displays-such as Apple Macintosh and
the IBM PC- popularized the use of bitmap
graphics for user-computer interaction.
• A bitmap is a ones and zeros representation of
the rectangular array points on the screen.
6.
• Once bitmapgraphics became affordable, and
explosion of easy-to-use and inexpensive
graphics-based applications followed.
7.
• This alloweduser to represent data files,
application program, file cabinets, mailboxes,
printers, recycle bin using different icons.
• By pointing and clicking the icons, users could
activate the corresponding programs or
objects, which replaced much of the typing of
the commands used in earlier operating
systems and computer applications.
8.
• Today, almostall interactive application
programs, even those for manipulating
text(e.g.. word processor) or numerical data
(e.g. spreadsheet programs), use graphics
extensively in the user interface and for
visualizing and manipulating the application-
specific objects
9.
• Even peoplewho do not use computers
encounter computer graphics in TV
commercials and as cinematic special effects.
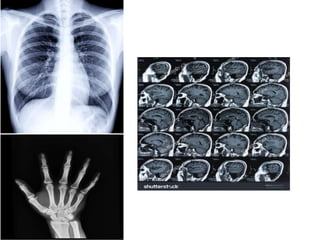
• Thus computer graphics is and integral part of
all computer user interfaces, and is
indispensable for visualizing 2D, 3D objects in
all most all areas such as education, science,
engineering, medicine, commerce, the
military, advertising, and entertainment.
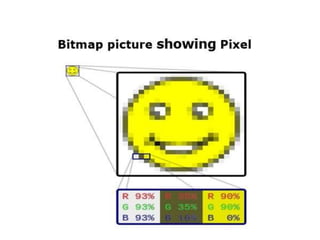
10.
Pixel
• In digitalimaging, a pixel, pel, dots, or picture element is a
physical point in a raster image, i.e. the smallest addressable
element in an all points addressable display device;
• it is the smallest controllable element of a picture represented on
the screen.
11.
Resolution
• Maximum numberof points displayed horizontally and
vertically without overlap on a display screen / image is
called resolution.
• In other ways , resolution is referred as the no of points per
inch(dpi/pixel per inch).
12.
• Image resolutionis typically expressed as a horizontal x
vertical measurement.
• So, an image resolution of 6000 x 4000 tells us that the image
measures 6000 pixels in width and 4000 pixels in height.
• Multiplying the two figures together gives us the second way
this is commonly stated, namely as megapixels.
• 6000 x 4000 equals 24,000,000, which is more commonly
written as 24 megapixels (MP).
13.
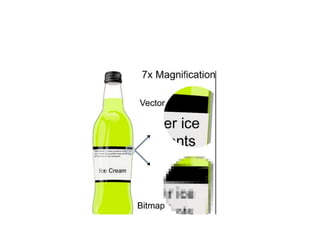
Types of Graphics
a)Bitmap graphics
b) Vector graphics
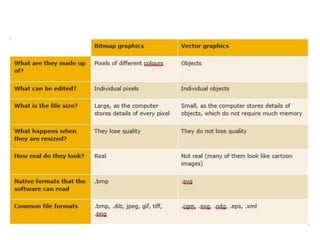
• Bitmap graphics are made up of pixels of different colors.
• Vector graphics are made up of objects.
14.
Bitmap graphics
• Itis also called a bit array, pixmap or bitmap index. meaning just
a map of bits, a spatially mapped array of bits.
• A bitmap graphic is composed of many tiny parts, called pixels,
which are often many different colours.
• It is possible to edit each individual pixel.
15.
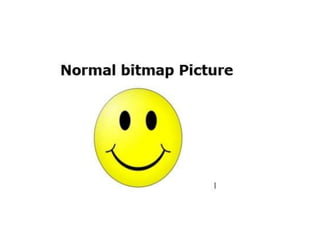
• Since thecomputer has to store information about every
single pixel in the image, the file size of a bitmap graphic is often
quite large.
• When you resize a bitmap graphic, it tends to lose quality.
18.
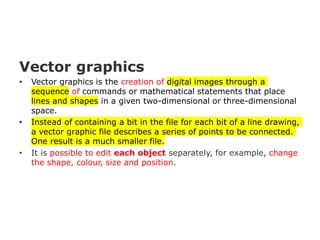
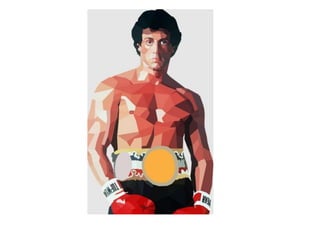
Vector graphics
• Vectorgraphics is the creation of digital images through a
sequence of commands or mathematical statements that place
lines and shapes in a given two-dimensional or three-dimensional
space.
• Instead of containing a bit in the file for each bit of a line drawing,
a vector graphic file describes a series of points to be connected.
One result is a much smaller file.
• It is possible to edit each object separately, for example, change
the shape, colour, size and position.
22.
• Even ifan object in a vector graphic is quite
large, it doesn't need a lot of computer memory.
Therefore the file size of a vector graphic is often
very small.
• Vector graphics are scalable - ie when you resize
them, they do not lose quality.
25.
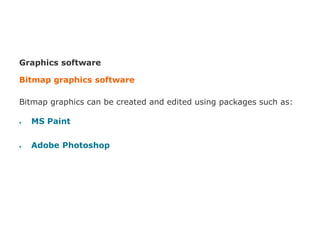
Graphics software
Bitmap graphicssoftware
Bitmap graphics can be created and edited using packages such as:
MS Paint
Adobe Photoshop
26.
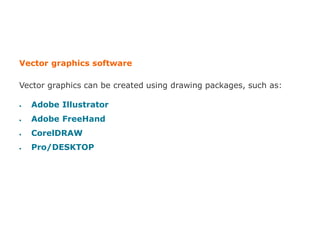
Vector graphics software
Vectorgraphics can be created using drawing packages, such as:
Adobe Illustrator
Adobe FreeHand
CorelDRAW
Pro/DESKTOP
• Image processingis a method to perform some
operations on an image, in order to get an
enhanced image or to extract some useful
information from it.
• It is a type of signal processing in which input is
an image and output may be image or
characteristics/features associated with that
image.
• Nowadays, image processing is among rapidly
growing technologies.
29.
Image processing basicallyincludes the
following three steps:
• Importing the image via image acquisition
tools;
• Analyzing and manipulating the image;
• Output ----- can be altered image or report
that is based on image analysis.
30.
Fundamental Image ProcessingSteps:
• Image Acquisition (Preprocessing)
the action of retrieving an image from
some source.
• Image Enhancement
the action of enhancing components of
an image.
31.
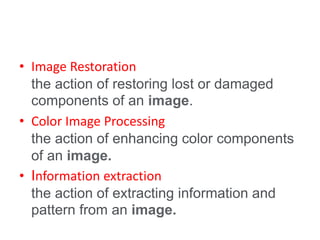
• Image Restoration
theaction of restoring lost or damaged
components of an image.
• Color Image Processing
the action of enhancing color components
of an image.
• Information extraction
the action of extracting information and
pattern from an image.
32.
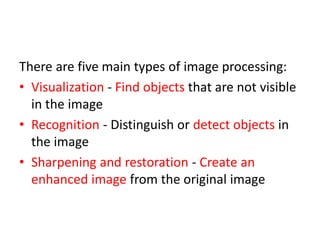
There are fivemain types of image processing:
• Visualization - Find objects that are not visible
in the image
• Recognition - Distinguish or detect objects in
the image
• Sharpening and restoration - Create an
enhanced image from the original image
33.
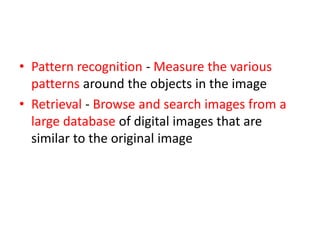
• Pattern recognition- Measure the various
patterns around the objects in the image
• Retrieval - Browse and search images from a
large database of digital images that are
similar to the original image
34.
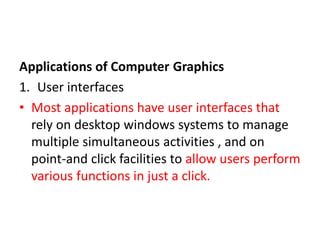
Applications of ComputerGraphics
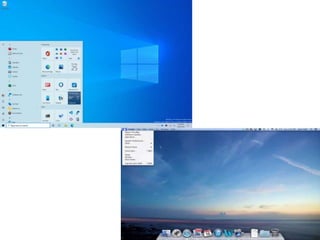
1. User interfaces
• Most applications have user interfaces that
rely on desktop windows systems to manage
multiple simultaneous activities , and on
point-and click facilities to allow users perform
various functions in just a click.
36.
• User interfaceshave menu items, icons and
objects on the screen designed with the help
of graphics.
37.
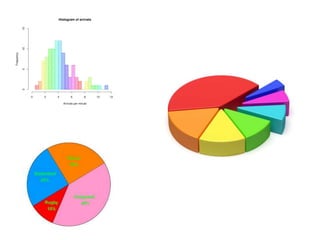
2. Plotting
• Plotting2D and 3D graphs of mathematical,
physical, and economic functions use computer
graphics extensively.
• The histograms, bar, and pie charts; the task-
scheduling charts are the most commonly used
plotting.
• These all are used to present meaningfully and
concisely the trends and patterns of complex
data.
39.
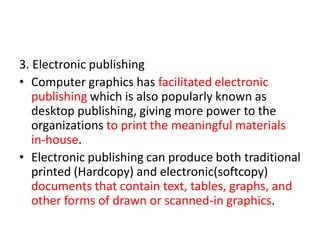
3. Electronic publishing
•Computer graphics has facilitated electronic
publishing which is also popularly known as
desktop publishing, giving more power to the
organizations to print the meaningful materials
in-house.
• Electronic publishing can produce both traditional
printed (Hardcopy) and electronic(softcopy)
documents that contain text, tables, graphs, and
other forms of drawn or scanned-in graphics.
41.
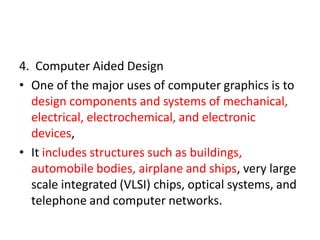
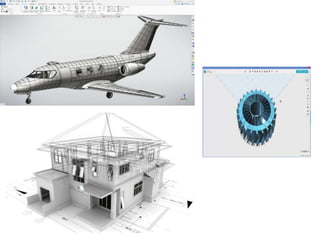
4. Computer AidedDesign
• One of the major uses of computer graphics is to
design components and systems of mechanical,
electrical, electrochemical, and electronic
devices,
• It includes structures such as buildings,
automobile bodies, airplane and ships, very large
scale integrated (VLSI) chips, optical systems, and
telephone and computer networks.
43.
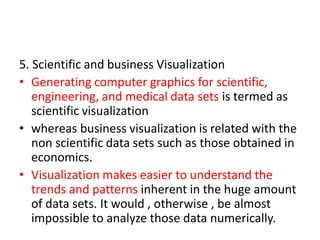
5. Scientific andbusiness Visualization
• Generating computer graphics for scientific,
engineering, and medical data sets is termed as
scientific visualization
• whereas business visualization is related with the
non scientific data sets such as those obtained in
economics.
• Visualization makes easier to understand the
trends and patterns inherent in the huge amount
of data sets. It would , otherwise , be almost
impossible to analyze those data numerically.
45.
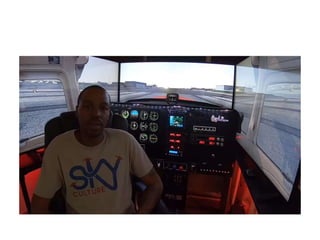
6. Simulation andmodeling
• Simulation is the imitation of the conditions
like those , which is encountered in real life.
• Simulation thus helps to learn or to feel the
conditions one might have to face in near
future without being in danger at the
beginning of the course.
47.
• The militarytank simulator, the naval
simulator, driving simulator, air traffic control
simulator, heavy-duty vehicle simulator, and
so on are some of the mostly used simulator
in practice.
48.
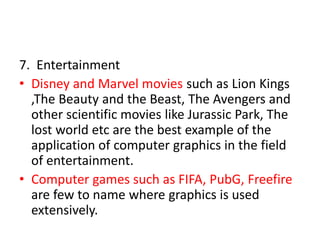
7. Entertainment
• Disneyand Marvel movies such as Lion Kings
,The Beauty and the Beast, The Avengers and
other scientific movies like Jurassic Park, The
lost world etc are the best example of the
application of computer graphics in the field
of entertainment.
• Computer games such as FIFA, PubG, Freefire
are few to name where graphics is used
extensively.
50.
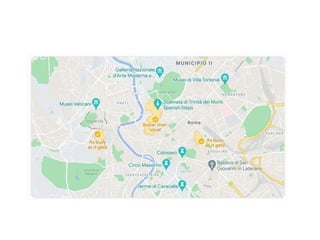
8. Cartography
• Cartographyis a subject , which deals with the
making of maps and charts.
• Computer graphics is used to produce both
accurate and schematic representations of
geographical and other natural phenomena
from measurement data.
• Examples include geographic maps, weather
maps, and population-density maps.
52.
Hardware Concepts
Input Devices
DigitizerTablet:
• In general a digitizer is a device which is used
to scan over an object, and to input a set of
discrete coordinate positions.
• These positions can then be joined with
straight-line segments to approximate the
shape of the original object.
54.
• It isa tool used to convert hand-drawn images
into a format suitable for computer processing.
• Images are usually drawn onto a flat surface with
a stylus and then appear on a computer monitor
or screen.
• Digitizer tablets can also be used as an input
device, receiving information represented in
drawings and sending output to a CAD (computer
aided design) application and PC-based software
like AutoCAD.
55.
Touch panel
• Thetouch panel allows the users to point at
the screen directly with a finger to move the
cursor around the screen, or to select the
icons.
• Following are the mostly used touch panels:
56.
Optical touch panel
•It uses a series of infra-red light emitting diodes (LED)
along one vertical edge and along one horizontal edge
of the panel.
• The opposite vertical and horizontal edges contain
photo-detectors to form a grid of invisible infrared light
beams over the display area.
• Touching the screen breaks one or two vertical and
horizontal light beams, thereby indicating the finger's
position.
• The cursor is then moved to this position, or the icon at
this position is selected.
57.
Light pen
• Itis a pencil-shaped device to determine the
coordinates of a point on the screen where it is
activated such as pressing the button.
• A light pen is a light-sensitive computer input
device, basically a stylus, that is used to select
text, draw pictures and interact with user
interface elements on a computer screen or
monitor.
58.
Keyboard
• A keyboardcreates a code such as ASCII
corresponding to a pressed key.
• It is used to provide input using alphanumeric
keys, function keys, cursor-control keys.
59.
Mouse
A mouse isa small hand-held device used to
position the cursor on the screen.
• They can be picked up, moved in space, and
then put down gain without any change in the
reported position.
• Following are the mostly used mouse in
computer graphics:
60.
Mechanical mouse
• Whena roller in the base of this mechanical
mouse is moved, a pair of orthogonally
arranged toothed wheels, each placed in
between a LED and a photo detector,
interrupts the light path.
• The interrupts so generated are used to report
the mouse movements to the computer.
61.
Optical mouse
• ALED on the bottom of the mouse directs a
beam of light down onto the pad, from which
it is reflected and sensed by the detectors on
the bottom of the mouse.
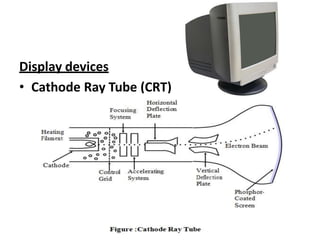
• CRT usedto be the most common display
devices.
• A CRT is an evacuated glass tube, with a
heating element on one end and a phosphor-
coated screen on the other end.
• When a current flows through this heating
element (filament) the conductivity of metal is
reduced due to high temperature, these cause
electrons to pile up on the filament.
64.
• These electronsare attracted to a strong positive
charge from the outer surface of the focusing
anode cylinder.
• The electrons head towards the anode forced
into a beam and accelerated by the inner cylinder
walls in just the way that water is speeds up
when its flow though a small diameter pipe.
• The forwarding fast electron beam is called
Cathode Ray.
65.
• There aretwo sets of weakly charged
deflection plates with oppositely charged, one
positive and another negative.
• The first set displaces the beam up and down
and the second displaces the beam left and
right.
• The electrons are sent flying out of the neck of
bottle (tube) until the smash into the
phosphor coating on the other end.
66.
• When electronsstrike on phosphor coating,
the phosphor then emits a small spot of light
at each position contacted by electron beam.
• The glowing positions are used to represent
the picture in the screen.
67.
• The amountof light emitted by the phosphor
coating depends on the no. of electrons
striking the screen.
• The brightness of the display is controlled by
varying the voltage on the control grid.
68.
Persistence:
• How longa phosphor continues to emit light after the
electron beam is removed
• Persistence of phosphor is defined as the time it takes
for emitted light to decay to 1/10 (10%) of its original
intensity. Range of persistence of different phosphors
can react many seconds.
• Phosphors for graphical display have persistence of 10
to 60 microseconds. Phosphors with low persistence
are useful for animation whereas high persistence
phosphor is useful for highly complex, static pictures.
69.
Refresh Rate:
• Lightemitted by phosphor fades very rapidly, so to keep the
drawn picture glowing constantly, it is required to redraw
the picture repeatedly and quickly directing the electron
beam back over the some point.
• The no of times/sec the image is redrawn to give a feeling
of non-flickering pictures is called refresh-rate.
• If Refresh rate decreases, flicker develops.
• For refresh displays, it depends on picture complexity
• Refresh rate above which flickering stops and steady it may
be called as critical fusion frequency(CFF).
70.
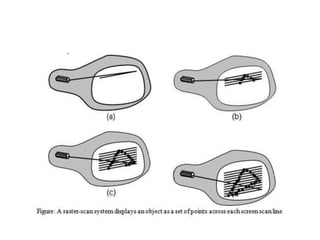
Raster-Scan Display
• Inraster-scan the electron beam is swept
across the screen, one row at a time from top
to bottom.
• No. of scan lines scaned per second is called
horizontal scan rate.
72.
• As electronbeam moves across each row, the
beam intensity is turned on and off to create a
pattern of illuminated spots.
• Picture definition is stored in a memory called
frame buffer or refresh buffer.
73.
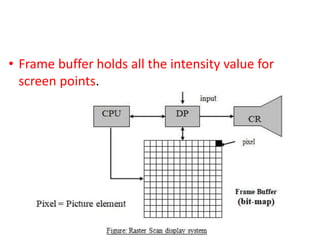
• Frame bufferholds all the intensity value for
screen points.
74.
• The storedintensity value is retrieved from frame
buffer and painted on the scan line at a time.
• Home television are common examples using
raster display.
• Intensity range for pixel position depends on
capability of raster system.
• For B/W system each point on screen are either
on or off, so only one bit per pixel is needed to
control the pixel intensity.
75.
• To displaycolor with varying intensity level,
additional bits are needed.
• Up to 24 to 32 bit per pixel are included in
high quality systems, which require more
space of storage for the frame buffer.
76.
− A systemwith 24 bit pixel and screen resolution 1024
*1024 require 3 megabyte of storage in frame buffer.
• 1024*1024 pixel = 1024*1024*24 bits = 3
MB
77.
• The framebutter in B/W system stores a pixel
with one bit per pixel so it is termed as
bitmap.
• The frame buffer in multi-bit per pixel storage,
is called pixmap.
78.
Interlacing
• When referringto a computer monitor or
another display, interlace or interlacing is a
description of how the picture is created.
• With an interlaced display the picture is
created by scanning every other line, and on
the next scan, scanning every opposite line.
80.
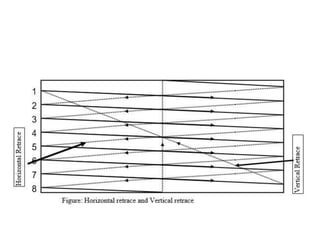
• Returning ofelectron beam from right end to
left end after refreshing each scan line is
horizontal retrace.
• At the end of each frame, the electron beam
returns to the top left corner to begin next
frame called vertical retrace.
81.
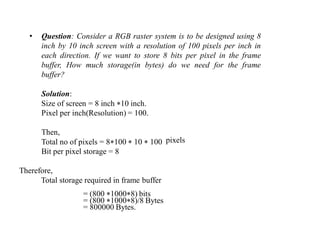
• Question: Considera RGB raster system is to be designed using 8
inch by 10 inch screen with a resolution of 100 pixels per inch in
each direction. If we want to store 8 bits per pixel in the frame
buffer, How much storage(in bytes) do we need for the frame
buffer?
Solution:
Size of screen = 8 inch *10 inch.
Pixel per inch(Resolution) = 100.
Then,
Total no of pixels = 8*100 * 10 * 100
Bit per pixel storage = 8
Therefore,
Total storage required in frame buffer
= (800 *1000*8) bits
= (800 *1000*8)/8 Bytes
= 800000 Bytes.
pixels
82.
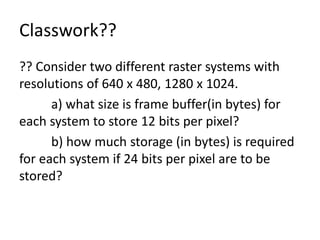
Classwork??
?? Consider twodifferent raster systems with
resolutions of 640 x 480, 1280 x 1024.
a) what size is frame buffer(in bytes) for
each system to store 12 bits per pixel?
b) how much storage (in bytes) is required
for each system if 24 bits per pixel are to be
stored?
83.
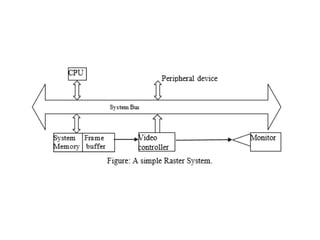
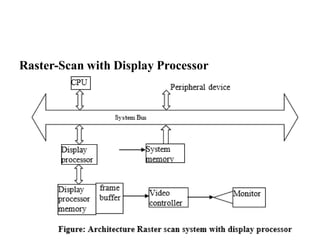
Architecture of RasterScan System:
• Consists of several processing units.
• CPU is the main processing unit of computer
systems.
• Besides CPU, graphics system consists of a
special purpose processor called video
controller or display processor.
• The display processor controls the operation
of the display device.
85.
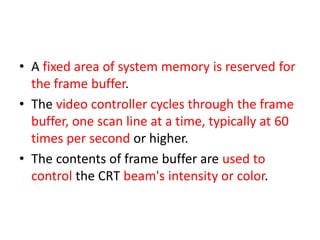
• A fixedarea of system memory is reserved for
the frame buffer.
• The video controller cycles through the frame
buffer, one scan line at a time, typically at 60
times per second or higher.
• The contents of frame buffer are used to
control the CRT beam's intensity or color.
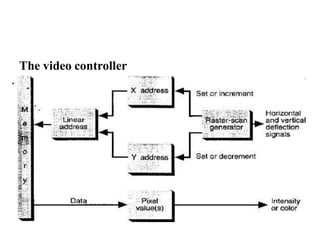
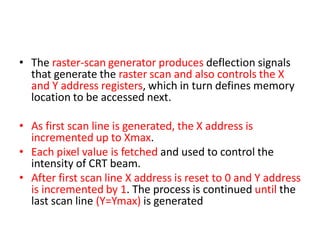
• The raster-scangenerator produces deflection signals
that generate the raster scan and also controls the X
and Y address registers, which in turn defines memory
location to be accessed next.
• As first scan line is generated, the X address is
incremented up to Xmax.
• Each pixel value is fetched and used to control the
intensity of CRT beam.
• After first scan line X address is reset to 0 and Y address
is incremented by 1. The process is continued until the
last scan line (Y=Ymax) is generated
• Includes aseparate graphics processor to
perform graphics functions such as scan
conversion and raster operation and a
separate frame buffer for image refresh.
90.
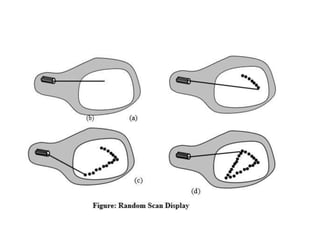
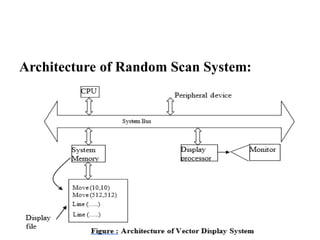
Random scan display:(Vector display)
• Electron beam that is directed only to the
parts of the screen where the picture is to be
drawn.
• It draws a picture one line at a time, so it is
also called vector display.
• The component lines of a picture are drawn
and refreshed by random scan system in any
specified order.
92.
• refresh rateof vector display depends upon
the no. of lines to be displayed for any image.
• Picture definition is stored as a set of line
drawing instructions in an area of memory
called the refresh display file.
93.
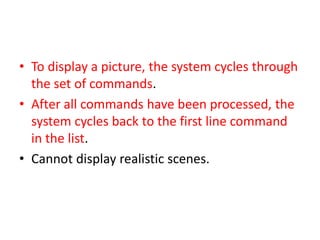
• To displaya picture, the system cycles through
the set of commands.
• After all commands have been processed, the
system cycles back to the first line command
in the list.
• Cannot display realistic scenes.
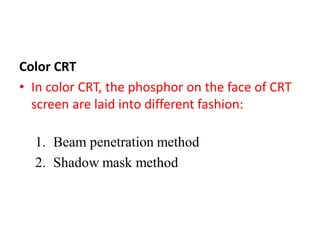
Color CRT
• Incolor CRT, the phosphor on the face of CRT
screen are laid into different fashion:
1. Beam penetration method
2. Shadow mask method
96.
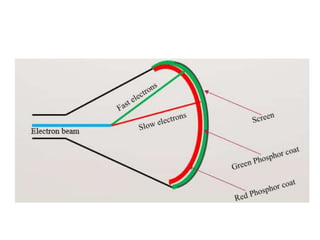
Beam Penetration method:
•This method is commonly used for random
scan display or vector display.
• In random scan display CRT, the two layers of
phosphor usually red and green are coated on
CRT screen.
• Display color depends upon how far electrons
beam penetrate the phosphor layers.
98.
• Slow electronexcite only red layer so
that we can see red color displayed on
the screen pixel where the beam
strikes.
• Fast electron beam excite green layer
penetrating the red layer and we can
see the green color displayed at the
corresponding position.
99.
• Intermediate iscombination of red and
green so two additional colors are
possible – orange and yellow.
• So only four colors are possible, so no
good quality picture.
100.
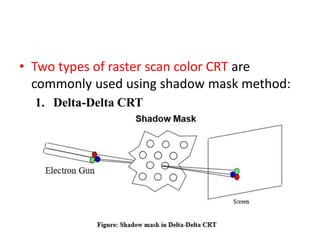
Shadow Mask Method:
•Shadow mask method is used for raster scan
system so they can produce wide range of
colors.
• In shadow mask color CRT, the phosphor on
the face of the screen are laid out in a precise
geometric pattern.
103.
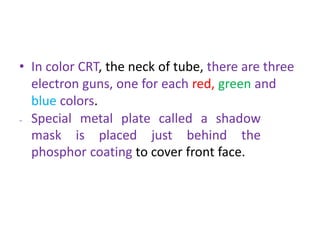
• In colorCRT, the neck of tube, there are three
electron guns, one for each red, green and
blue colors.
− Special metal plate called a shadow
mask is placed just behind the
phosphor coating to cover front face.
104.
• The maskis aligned so that it simultaneously
allow each electron beam to see only the
phosphor of its assigned color.
105.
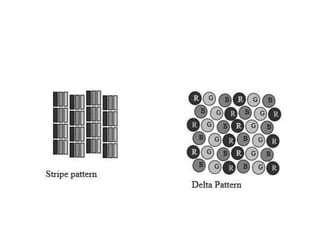
• Two typesof raster scan color CRT are
commonly used using shadow mask method:
1. Delta-Delta CRT
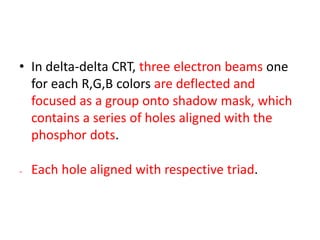
106.
• In delta-deltaCRT, three electron beams one
for each R,G,B colors are deflected and
focused as a group onto shadow mask, which
contains a series of holes aligned with the
phosphor dots.
− Each hole aligned with respective triad.
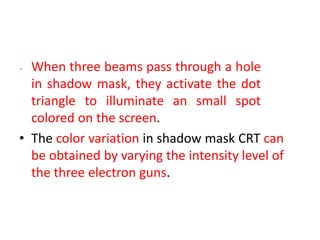
107.
− When threebeams pass through a hole
in shadow mask, they activate the dot
triangle to illuminate an small spot
colored on the screen.
• The color variation in shadow mask CRT can
be obtained by varying the intensity level of
the three electron guns.
108.
• Draw backof this CRT is due to difficulty for
the alignment of shadow mask hole and
respective triads.
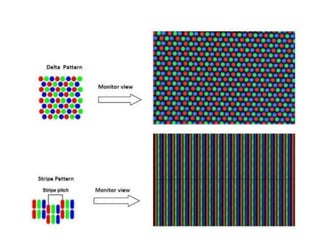
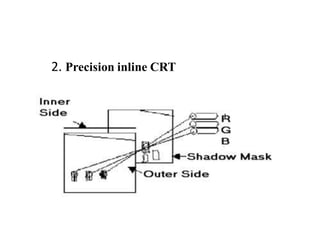
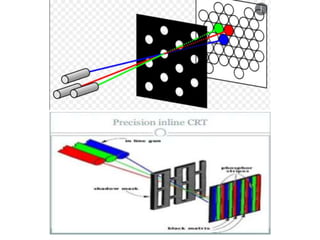
• This CRTuses strips pattern instead of
delta pattern.
• Three strips one for each R, G, B color are
used for a single pixel along a scan line so
called inline.
112.
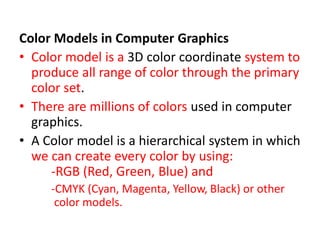
Color Models inComputer Graphics
• Color model is a 3D color coordinate system to
produce all range of color through the primary
color set.
• There are millions of colors used in computer
graphics.
• A Color model is a hierarchical system in which
we can create every color by using:
-RGB (Red, Green, Blue) and
-CMYK (Cyan, Magenta, Yellow, Black) or other
color models.
113.
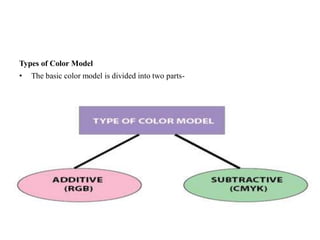
Types of ColorModel
• The basic color model is divided into two parts-
114.
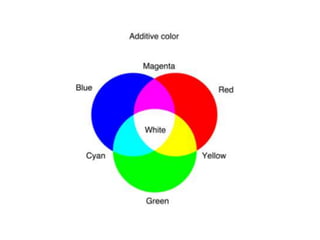
Additive Color Model:
•It is also named as RGB model.
• This color space is widely used in computer
graphics.
117.
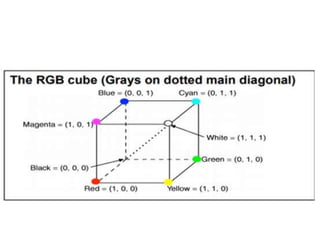
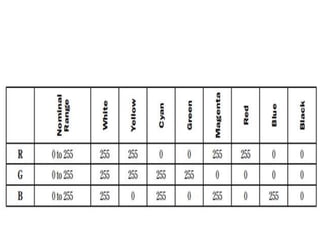
• In RGBmodel, the default color is black.
• It means absence of any color or the 0 values
of all R, G and B results in a black color and
presence of all R, G and B in full intensity
results in white.
118.
• To generateprimary colors, we add the
different values of R, G and B together.
• That is why it’s so called additive color model.
120.
• RGB colormodel is used for digital display
devices.
121.
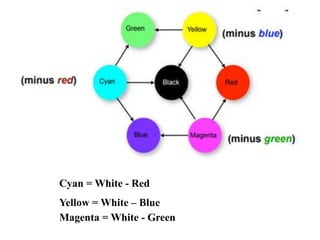
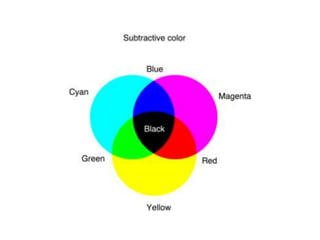
Subtractive Color Model:
•It is also named as CMYK Model.
• CMYK stands for Cyan, Magenta, Yellow, and
Black.
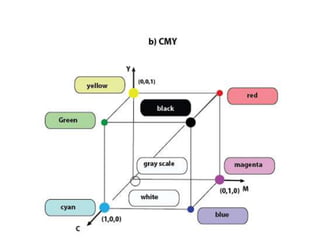
123.
• In CMYKmodel, the default color is white.
• It means absence of any color or the 0 values
of all C, M and Y results in a white color and
presence of all C, M and Y in full intensity
results in black.
124.
• To generatethe primary colors, we subtract
the different values of R, G and B from White
color.
• That is why it’s so called subtractive color
model.
• Specified color is subtracted from the white
light rather than adding.
125.
Cyan = White- Red
Yellow = White – Blue
Magenta = White - Green
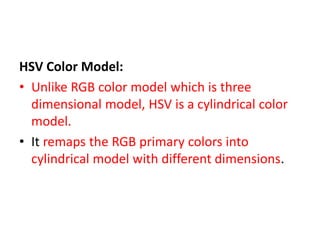
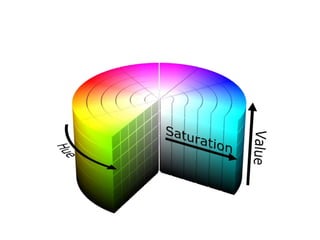
HSV Color Model:
•Unlike RGB color model which is three
dimensional model, HSV is a cylindrical color
model.
• It remaps the RGB primary colors into
cylindrical model with different dimensions.
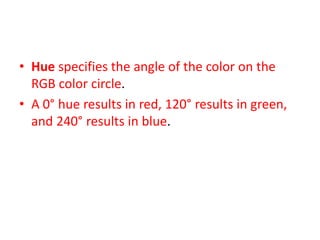
• Hue specifiesthe angle of the color on the
RGB color circle.
• A 0° hue results in red, 120° results in green,
and 240° results in blue.
132.
• Saturation controlsthe amount of color used.
• A color with 100% saturation will be the
purest color possible, while 0% saturation
yields gray scale.
• Value controls the brightness of the color.
133.
• Dimensions ofthe HSV color model are
interdependent.
• If the value dimension of a color is set to 0%,
the amount of hue and saturation does not
matter as the color will be black.
134.
• Likewise, ifthe saturation of a color is set to
0%, the hue does not matter as there is no
color used.
135.
Graphics Software
Two generalclassifications for graphics software:
General programming packages
• Special purpose application packages
136.
General programming packages
•It contains graphics functions that can be used with
high level programming languages such as C, FORTRAN,
JAVA, etc. Example: OpenGL (Graphics Library).
• A general purpose graphics package provides users
with a variety of functions for creating and manipulating
pictures.
• These graphic functions include tools for generating
picture components, setting color, and applying
transformations.
137.
Special purpose applicationpackages
• It is specifically designed for particular
applications.
• Maya, CINEMA 3D are particularly used for
animations, different types of CAD applications
are designed for medical and business purposes.
• These are primarily oriented to non-
programmers.
138.
Software Standards
• Graphicspackages are designed with standard
graphics functions, software can be easily
moved from one H/W system to another.
139.
1)Graphical Kernel System(GKS)
• GKS was the first graphics software standard
adopted by the international standards
organization (ISO).
• It was originally designed as a 2-dimensional
graphics package.
• GKS supports the grouping of logically related
primitives such as lines, polygons.
140.
2) Programmer’s HierarchicalInteractive Graphics
System (PHIGS)
• It is an extension of GKS.
• Increased capabilities in object modeling, color
specifications, surface rendering and picture
manipulation are provided in PHIGS.
• It include all primitives supported by GKS, in
addition, it also includes geometric
transformations (like Scaling, Translation,
Rotation, etc).
141.
3) PHIGS+
• Itis an extension of earlier PHIGS.
• 3D surface shading capabilities are added
to the PHIGS.