Made by –Nagesh Pratap Singh
Assistant Professor
JMS Group Of institutions
BCA 2 YEAR IV SEM
2.
What is ComputerGraphics?
Computer Graphics including digital images, animations,
and interactive graphics used in various sectors such as
entertainment, education, scientific visualization, and virtual
reality. Computer Graphics can be used in UI design,
rendering, geometric objects, animation, and many more. In
most areas, computer graphics is an abbreviation of CG.
Computer Graphics refers to several things
• The manipulation and the representation of the image or the
data in a graphical manner.
• Various technology is required for the creation and
manipulation.
• Digital synthesis and its manipulation.
Computer graphics is a wide-ranging topic that
covers rendering, modeling, and visualization techniques.
3.
1) Interactive ComputerGraphics
In interactive computer graphics, users have
some controls over the image, i.e., the user
can make any changes to the image
produced.
2) Non Interactive Computer Graphics
Non-interactive computer graphics are also
known as passive computer graphics. It is a
type of computer graphics in which the user
has no control over the image. The photo is
completely controlled by the instructions of
the program, not by the user
4.
Applications of ComputerGraphics
Computer graphics deals with creation, manipulation and storage of different type of
images and objects.
1. Computer Art: Using computer graphics we
can create fine and commercial art which
include animation packages, paint
packages. These packages provide facilities
for designing object shapes and specifying
object motion. Cartoon drawing, paintings,
logo design can also be done.
2. Computer Aided Designing: Designing of
buildings, automobile, aircraft is done with
the help of computer aided drawing, this
helps in providing minute details to the
drawing and producing more accurate and
sharp drawings with better specifications.
3. Presentation Graphics: For the preparation
of reports or summarizing the financial,
statistical, mathematical, scientific,
economic data for research reports,
managerial reports, moreover creation of bar
graphs, pie charts, time chart, can be done
using the tools present in computer
graphics.
5.
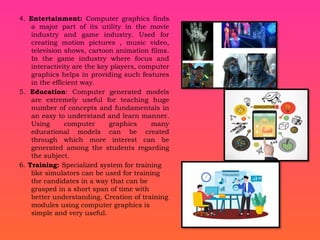
4. Entertainment: Computergraphics finds
a major part of its utility in the movie
industry and game industry. Used for
creating motion pictures , music video,
television shows, cartoon animation films.
In the game industry where focus and
interactivity are the key players, computer
graphics helps in providing such features
in the efficient way.
5. Education: Computer generated models
are extremely useful for teaching huge
number of concepts and fundamentals in
an easy to understand and learn manner.
Using computer graphics many
educational models can be created
through which more interest can be
generated among the students regarding
the subject.
6. Training: Specialized system for training
like simulators can be used for training
the candidates in a way that can be
grasped in a short span of time with
better understanding. Creation of training
modules using computer graphics is
simple and very useful.
6.
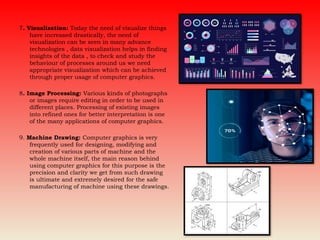
7. Visualization: Todaythe need of visualize things
have increased drastically, the need of
visualization can be seen in many advance
technologies , data visualization helps in finding
insights of the data , to check and study the
behaviour of processes around us we need
appropriate visualization which can be achieved
through proper usage of computer graphics.
8. Image Processing: Various kinds of photographs
or images require editing in order to be used in
different places. Processing of existing images
into refined ones for better interpretation is one
of the many applications of computer graphics.
9. Machine Drawing: Computer graphics is very
frequently used for designing, modifying and
creation of various parts of machine and the
whole machine itself, the main reason behind
using computer graphics for this purpose is the
precision and clarity we get from such drawing
is ultimate and extremely desired for the safe
manufacturing of machine using these drawings.
7.
Graphical User Interface:
Theuse of pictures, images,
icons, pop-up menus,
graphical objects helps in
creating a user friendly
environment where working
is easy and pleasant, using
computer graphics we can
create such an atmosphere
where everything can be
automated and anyone can
get the desired action
performed in an easy
fashion.
8.
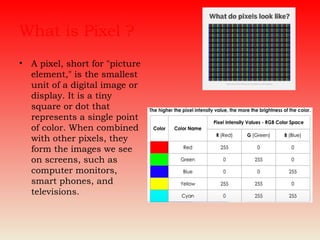
What is Pixel?
• A pixel, short for "picture
element," is the smallest
unit of a digital image or
display. It is a tiny
square or dot that
represents a single point
of color. When combined
with other pixels, they
form the images we see
on screens, such as
computer monitors,
smart phones, and
televisions.
9.
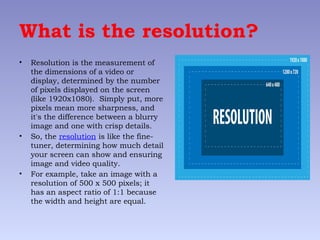
What is theresolution?
• Resolution is the measurement of
the dimensions of a video or
display, determined by the number
of pixels displayed on the screen
(like 1920x1080). Simply put, more
pixels mean more sharpness, and
it's the difference between a blurry
image and one with crisp details.
• So, the resolution is like the fine-
tuner, determining how much detail
your screen can show and ensuring
image and video quality.
• For example, take an image with a
resolution of 500 x 500 pixels; it
has an aspect ratio of 1:1 because
the width and height are equal.
10.
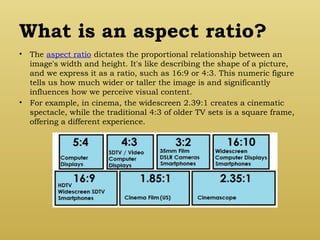
What is anaspect ratio?
• The aspect ratio dictates the proportional relationship between an
image's width and height. It's like describing the shape of a picture,
and we express it as a ratio, such as 16:9 or 4:3. This numeric figure
tells us how much wider or taller the image is and significantly
influences how we perceive visual content.
• For example, in cinema, the widescreen 2.39:1 creates a cinematic
spectacle, while the traditional 4:3 of older TV sets is a square frame,
offering a different experience.
11.
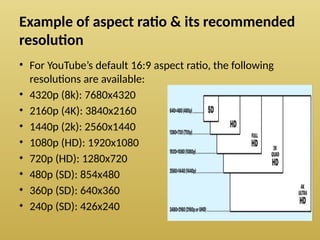
Example of aspectratio & its recommended
resolution
• For YouTube’s default 16:9 aspect ratio, the following
resolutions are available:
• 4320p (8k): 7680x4320
• 2160p (4K): 3840x2160
• 1440p (2k): 2560x1440
• 1080p (HD): 1920x1080
• 720p (HD): 1280x720
• 480p (SD): 854x480
• 360p (SD): 640x360
• 240p (SD): 426x240
12.
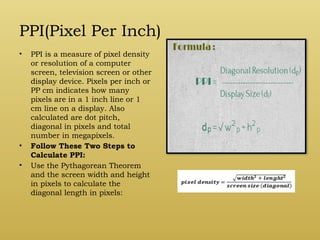
PPI(Pixel Per Inch)
•PPI is a measure of pixel density
or resolution of a computer
screen, television screen or other
display device. Pixels per inch or
PP cm indicates how many
pixels are in a 1 inch line or 1
cm line on a display. Also
calculated are dot pitch,
diagonal in pixels and total
number in megapixels.
• Follow These Two Steps to
Calculate PPI:
• Use the Pythagorean Theorem
and the screen width and height
in pixels to calculate the
diagonal length in pixels:
13.
Advantages of interactivegraphics
• In interactive Computer Graphics user have some controls over the
picture, i.e., the user can make any change in the produced image.
• Interactive Computer Graphics require two-way communication
between the computer and the user. A User can see the image and
make any change by sending his command with an input device.
• Advantages:
• Higher Quality
• More precise results or products
• Greater Productivity
• Lower analysis and design cost
• Significantly enhances our ability to understand data and to perceive
trends.
14.
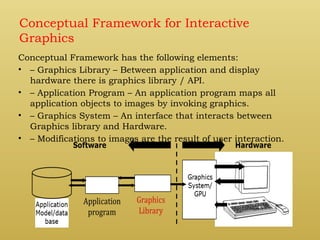
Conceptual Framework forInteractive
Graphics
Conceptual Framework has the following elements:
• – Graphics Library – Between application and display
hardware there is graphics library / API.
• – Application Program – An application program maps all
application objects to images by invoking graphics.
• – Graphics System – An interface that interacts between
Graphics library and Hardware.
• – Modifications to images are the result of user interaction.
15.
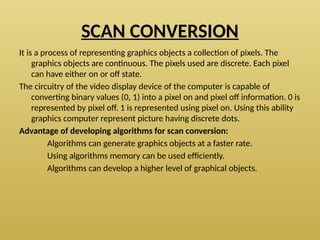
SCAN CONVERSION
It isa process of representing graphics objects a collection of pixels. The
graphics objects are continuous. The pixels used are discrete. Each pixel
can have either on or off state.
The circuitry of the video display device of the computer is capable of
converting binary values (0, 1) into a pixel on and pixel off information. 0 is
represented by pixel off. 1 is represented using pixel on. Using this ability
graphics computer represent picture having discrete dots.
Advantage of developing algorithms for scan conversion:
Algorithms can generate graphics objects at a faster rate.
Using algorithms memory can be used efficiently.
Algorithms can develop a higher level of graphical objects.
16.
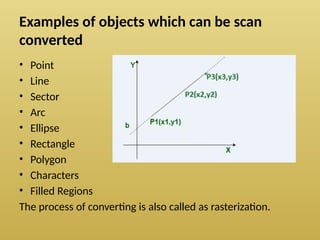
Examples of objectswhich can be scan
converted
• Point
• Line
• Sector
• Arc
• Ellipse
• Rectangle
• Polygon
• Characters
• Filled Regions
The process of converting is also called as rasterization.
17.
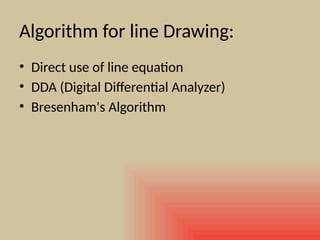
Algorithm for lineDrawing:
• Direct use of line equation
• DDA (Digital Differential Analyzer)
• Bresenham's Algorithm
18.
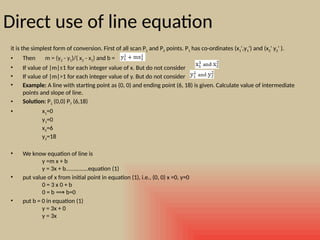
Direct use ofline equation
it is the simplest form of conversion. First of all scan P1 and P2 points. P1 has co-ordinates (x1',y1') and (x2' y2' ).
• Then m = (y2 - y1)/( x2 - x1) and b =
• If value of |m|≤1 for each integer value of x. But do not consider
• If value of |m|>1 for each integer value of y. But do not consider
• Example: A line with starting point as (0, 0) and ending point (6, 18) is given. Calculate value of intermediate
points and slope of line.
• Solution: P1 (0,0) P7 (6,18)
• x1=0
y1=0
x2=6
y2=18
• We know equation of line is
y =m x + b
y = 3x + b..............equation (1)
• put value of x from initial point in equation (1), i.e., (0, 0) x =0, y=0
0 = 3 x 0 + b
0 = b b=0
⟹
• put b = 0 in equation (1)
y = 3x + 0
y = 3x
19.
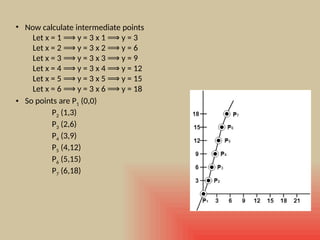
• Now calculateintermediate points
Let x = 1 y = 3 x 1 y = 3
⟹ ⟹
Let x = 2 y = 3 x 2 y = 6
⟹ ⟹
Let x = 3 y = 3 x 3 y = 9
⟹ ⟹
Let x = 4 y = 3 x 4 y = 12
⟹ ⟹
Let x = 5 y = 3 x 5 y = 15
⟹ ⟹
Let x = 6 y = 3 x 6 y = 18
⟹ ⟹
• So points are P1 (0,0)
P2 (1,3)
P3 (2,6)
P4 (3,9)
P5 (4,12)
P6 (5,15)
P7 (6,18)
20.
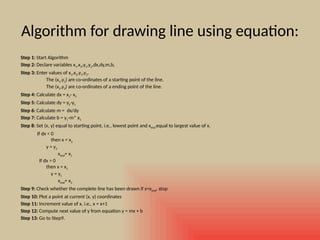
Algorithm for drawingline using equation:
Step 1: Start Algorithm
Step 2: Declare variables x1,x2,y1,y2,dx,dy,m,b,
Step 3: Enter values of x1,x2,y1,y2.
The (x1,y1) are co-ordinates of a starting point of the line.
The (x2,y2) are co-ordinates of a ending point of the line.
Step 4: Calculate dx = x2- x1
Step 5: Calculate dy = y2-y1
Step 6: Calculate m = dx/dy
Step 7: Calculate b = y1-m* x1
Step 8: Set (x, y) equal to starting point, i.e., lowest point and xend equal to largest value of x.
If dx < 0
then x = x2
y = y2
xend= x1
If dx > 0
then x = x1
y = y1
xend= x2
Step 9: Check whether the complete line has been drawn if x=xend, stop
Step 10: Plot a point at current (x, y) coordinates
Step 11: Increment value of x, i.e., x = x+1
Step 12: Compute next value of y from equation y = mx + b
Step 13: Go to Step9.
21.
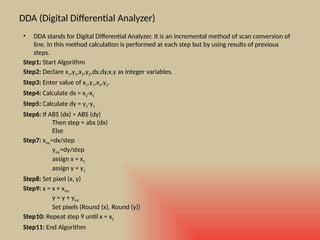
DDA (Digital DifferentialAnalyzer)
• DDA stands for Digital Differential Analyzer. It is an incremental method of scan conversion of
line. In this method calculation is performed at each step but by using results of previous
steps.
Step1: Start Algorithm
Step2: Declare x1,y1,x2,y2,dx,dy,x,y as integer variables.
Step3: Enter value of x1,y1,x2,y2.
Step4: Calculate dx = x2-x1
Step5: Calculate dy = y2-y1
Step6: If ABS (dx) > ABS (dy)
Then step = abs (dx)
Else
Step7: xinc=dx/step
yinc=dy/step
assign x = x1
assign y = y1
Step8: Set pixel (x, y)
Step9: x = x + xinc
y = y + yinc
Set pixels (Round (x), Round (y))
Step10: Repeat step 9 until x = x2
Step11: End Algorithm
22.
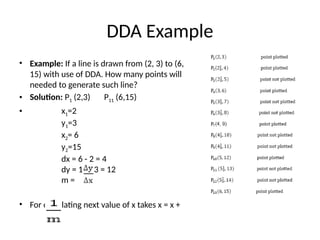
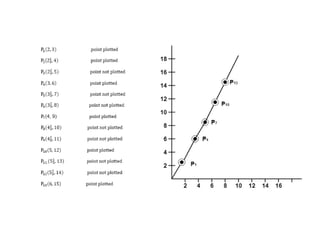
DDA Example
• Example:If a line is drawn from (2, 3) to (6,
15) with use of DDA. How many points will
needed to generate such line?
• Solution: P1 (2,3) P11 (6,15)
• x1=2
y1=3
x2= 6
y2=15
dx = 6 - 2 = 4
dy = 15 - 3 = 12
m =
• For calculating next value of x takes x = x +
24.
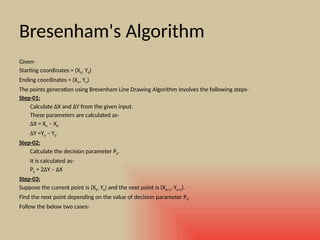
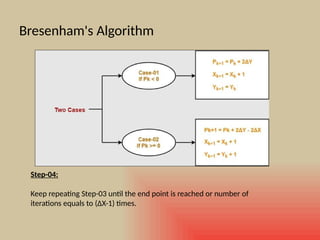
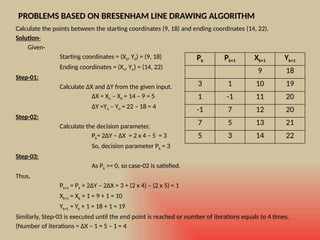
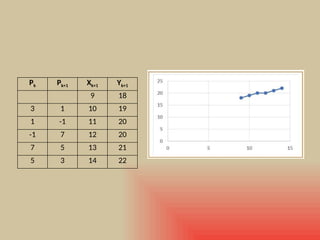
Bresenham's Algorithm
Given-
Starting coordinates= (X0, Y0)
Ending coordinates = (Xn, Yn)
The points generation using Bresenham Line Drawing Algorithm involves the following steps-
Step-01:
Calculate ΔX and ΔY from the given input.
These parameters are calculated as-
ΔX = Xn – X0
ΔY =Yn – Y0
Step-02:
Calculate the decision parameter Pk.
It is calculated as-
Pk = 2ΔY – ΔX
Step-03:
Suppose the current point is (Xk, Yk) and the next point is (Xk+1, Yk+1).
Find the next point depending on the value of decision parameter Pk.
Follow the below two cases-
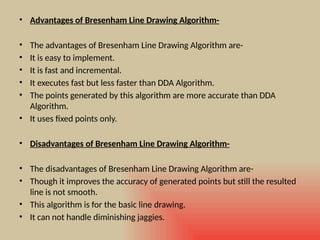
• Advantages ofBresenham Line Drawing Algorithm-
• The advantages of Bresenham Line Drawing Algorithm are-
• It is easy to implement.
• It is fast and incremental.
• It executes fast but less faster than DDA Algorithm.
• The points generated by this algorithm are more accurate than DDA
Algorithm.
• It uses fixed points only.
• Disadvantages of Bresenham Line Drawing Algorithm-
• The disadvantages of Bresenham Line Drawing Algorithm are-
• Though it improves the accuracy of generated points but still the resulted
line is not smooth.
• This algorithm is for the basic line drawing.
• It can not handle diminishing jaggies.
29.
Circle Drawing Algorithms-
Incomputer graphics, popular algorithms used
to generate circle are-
1. Mid Point Circle Drawing Algorithm
2. Bresenham Circle Drawing Algorithm
30.
Bresenham Circle DrawingAlgorithm
Given-
Centre point of Circle = (X0, Y0)
Radius of Circle = R
The points generation using Bresenham Circle Drawing Algorithm involves the following steps-
Step-01:
Assign the starting point coordinates (X0, Y0) as-
X0 = 0
Y0 = R
Step-02:
Calculate the value of initial decision parameter P0 as-
P0 = 3 – 2 x R
Step-03:
Suppose the current point is (Xk, Yk) and the next point is (Xk+1, Yk+1).
Find the next point of the first octant depending on the value of decision parameter Pk.
Follow the below two cases-
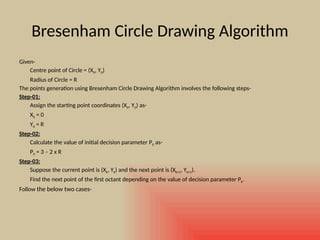
31.
Step-04:
If the givencentre point (X0, Y0) is not (0, 0),
then do the following and plot the point-
Xplot = Xc + X0
Yplot = Yc + Y0
Here, (Xc, Yc) denotes the current value of
X and Y coordinates.
Step-05:
Keep repeating Step-03 and Step-04 until Xplot => Yplot.
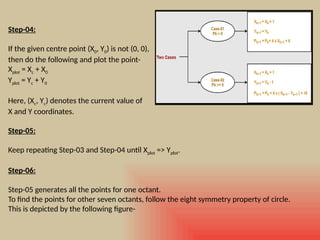
Step-06:
Step-05 generates all the points for one octant.
To find the points for other seven octants, follow the eight symmetry property of circle.
This is depicted by the following figure-
33.
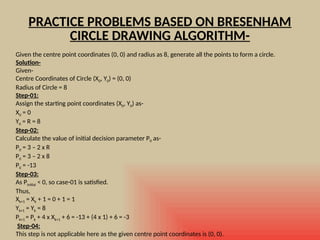
PRACTICE PROBLEMS BASEDON BRESENHAM
CIRCLE DRAWING ALGORITHM-
Given the centre point coordinates (0, 0) and radius as 8, generate all the points to form a circle.
Solution-
Given-
Centre Coordinates of Circle (X0, Y0) = (0, 0)
Radius of Circle = 8
Step-01:
Assign the starting point coordinates (X0, Y0) as-
X0 = 0
Y0 = R = 8
Step-02:
Calculate the value of initial decision parameter P0 as-
P0 = 3 – 2 x R
P0 = 3 – 2 x 8
P0 = -13
Step-03:
As Pinitial < 0, so case-01 is satisfied.
Thus,
Xk+1 = Xk + 1 = 0 + 1 = 1
Yk+1 = Yk = 8
Pk+1 = Pk + 4 x Xk+1 + 6 = -13 + (4 x 1) + 6 = -3
Step-04:
This step is not applicable here as the given centre point coordinates is (0, 0).
34.
Pk Pk+1 (Xk+1,Yk+1)
(0, 8)
-13 -3 (1, 8)
-3 11 (2, 8)
11 5 (3, 7)
5 7 (4, 6)
7 (5, 5)
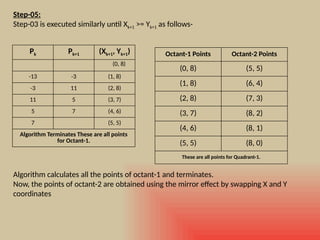
Algorithm Terminates These are all points
for Octant-1.
Step-05:
Step-03 is executed similarly until Xk+1 >= Yk+1 as follows-
Algorithm calculates all the points of octant-1 and terminates.
Now, the points of octant-2 are obtained using the mirror effect by swapping X and Y
coordinates
Octant-1 Points Octant-2 Points
(0, 8) (5, 5)
(1, 8) (6, 4)
(2, 8) (7, 3)
(3, 7) (8, 2)
(4, 6) (8, 1)
(5, 5) (8, 0)
These are all points for Quadrant-1.
35.
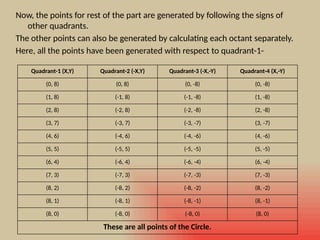
Now, the pointsfor rest of the part are generated by following the signs of
other quadrants.
The other points can also be generated by calculating each octant separately.
Here, all the points have been generated with respect to quadrant-1-
Quadrant-1 (X,Y) Quadrant-2 (-X,Y) Quadrant-3 (-X,-Y) Quadrant-4 (X,-Y)
(0, 8) (0, 8) (0, -8) (0, -8)
(1, 8) (-1, 8) (-1, -8) (1, -8)
(2, 8) (-2, 8) (-2, -8) (2, -8)
(3, 7) (-3, 7) (-3, -7) (3, -7)
(4, 6) (-4, 6) (-4, -6) (4, -6)
(5, 5) (-5, 5) (-5, -5) (5, -5)
(6, 4) (-6, 4) (-6, -4) (6, -4)
(7, 3) (-7, 3) (-7, -3) (7, -3)
(8, 2) (-8, 2) (-8, -2) (8, -2)
(8, 1) (-8, 1) (-8, -1) (8, -1)
(8, 0) (-8, 0) (-8, 0) (8, 0)
These are all points of the Circle.


![[Deck] What's New in Spark-Iceberg Integration via DSV2.pptx](https://cdn.slidesharecdn.com/ss_thumbnails/deckwhatsnewinspark-icebergintegrationviadsv2-260210005337-25955b12-thumbnail.jpg?width=640&height=640&fit=bounds)


