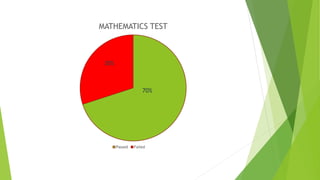
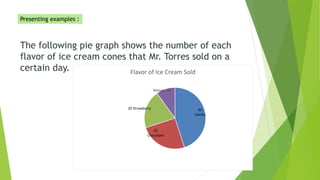
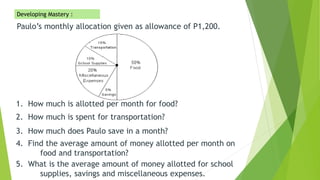
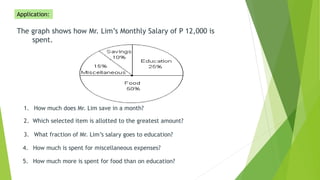
The document provides information about interpreting data presented in pie graphs. It includes examples of pie graphs showing results of a mathematics test, ice cream sales, and how one person's monthly salary is allocated. It also discusses key aspects of pie graphs like they show percentages of a whole total and can be used to compare data categories. The document aims to help readers understand how to read and interpret information from pie graphs.