Download to read offline
![“Marketo is very good about monitoring the community.
Employees often step in to help.”
— Drew, Marketo Customer, <50 FTE
“Has a large online community and makes sure you are
involved in a local user group.”
— Cathy, Marketo Partner, <50 FTE, service provider
Attack (real customer complaints)
Inflexible Reporting
“When we tried to get the system to show
us the create date…Marketo couldn't do
it. In salesforce.com, I would simply run a
report with Create Date, Lead Source =
Website, and Lead Source
Name... Marketo was unable to break
down the data along those dimensions.”
(Marketo Customer, Blog Post 12/11)
Poor Analytics
“Marketo is designed for looking at the
behavior of individual leads…not for
analyzing the behavior of groups of leads.”
(Marketo Customer, Blog Post 3/12)
Difficult to Work With
Consistent complaints about pushy sales
reps, uncooperative support, too much
effort needed to get information. (Marketo
Customer, Blog Post, 3/12, among others)
Defend (real sales reps’ attacks)
“Marketo is purely market automation, this is
not what Client does well.” (Chip, Marketo
Sales Rep)
We combine lead gen with nurturing and
automation for a more complete solution
than Marketo (which is solely focused on
automation).
Client doesn’t do nurturing, scoring, tracking
well” (Chip, Marketo Sales Rep)
Our segment/list approach to nurturing and
scoring is based on behavior, actions, and
data collected through forms, CRM, etc. It’s
more flexible and robust than Marketo.
Marketo’s difference: pace of innovation –
every year 1 major release. Each one is looked
at as a competitive advantage. [Ex: Crowd
Factory, first to move to B2C social media]
(Chip, Marketo Sales Rep)
We are continually shipping new features.
Just check out our blog.
Marquis
Customers
“Really easy. All object oriented.”
— Mari, Marketo Partner, <50 FTE, consultant
Product
Screenshot
Marketo Dashboard Funnel
Top Features
Positioned by their
reps during sales calls
1. Convenient Pre-built
campaigns
2. Complete third-party
Integration
3. Intricate marketing
system
4. Elaborate lead
scoring system
5. “IT Free”
“Marketo drives [leads] through [the] sales function. HubSpot
drives [leads] to [the] company.”
— Matt, Marketo Employee
Battle Marketo with Flexibility & Complete Solution
from Top of Funnel
Prepared in collaboration with Explorics. www.explorics.com
13
Attack&Defend](https://image.slidesharecdn.com/introtocorymannmarketinsight20182-181022203351/75/Intro-to-Cory-Mann-s-User-Customer-Market-Insight-Practice-13-2048.jpg)
![Jeff
VP EE
Benefits
Pamela
Parks &
Resorts
Tom
Operations
Barbara
Strategy
Deloitte
Jeff Was Final Decision-Maker; Barbara Highly
Influential, Then Tom
Decision influencers included:
Deloitte: Input in the beginning of process. Encouraged
Client to invite Client to bid
Tom : Facilitated RFP process. Ran previous program with
Payer/Client partnership. Now rolling out new
Payer program.
Barbara: Strategy, long term focused. Open to best-in-class
solution. Her team developed RFP.
Pamela: Medical Director, Client Resorts, represented 80%
of employee population
14
“My team designed the RFP, but
Tom facilitated the project to get
a new vendor. This would
normally be my role…Due to
lack of bandwidth, Tom took on
the role running the integrated
medical management stream.”
– Barbara
“is consensus-
driven…He [Jeff]
influenced the final
decision. He is
oriented towards
bundling of vendors.
Some of us felt best-
in-class was the way
to go.”
– Barbara
Win/Loss](https://image.slidesharecdn.com/introtocorymannmarketinsight20182-181022203351/75/Intro-to-Cory-Mann-s-User-Customer-Market-Insight-Practice-14-2048.jpg)
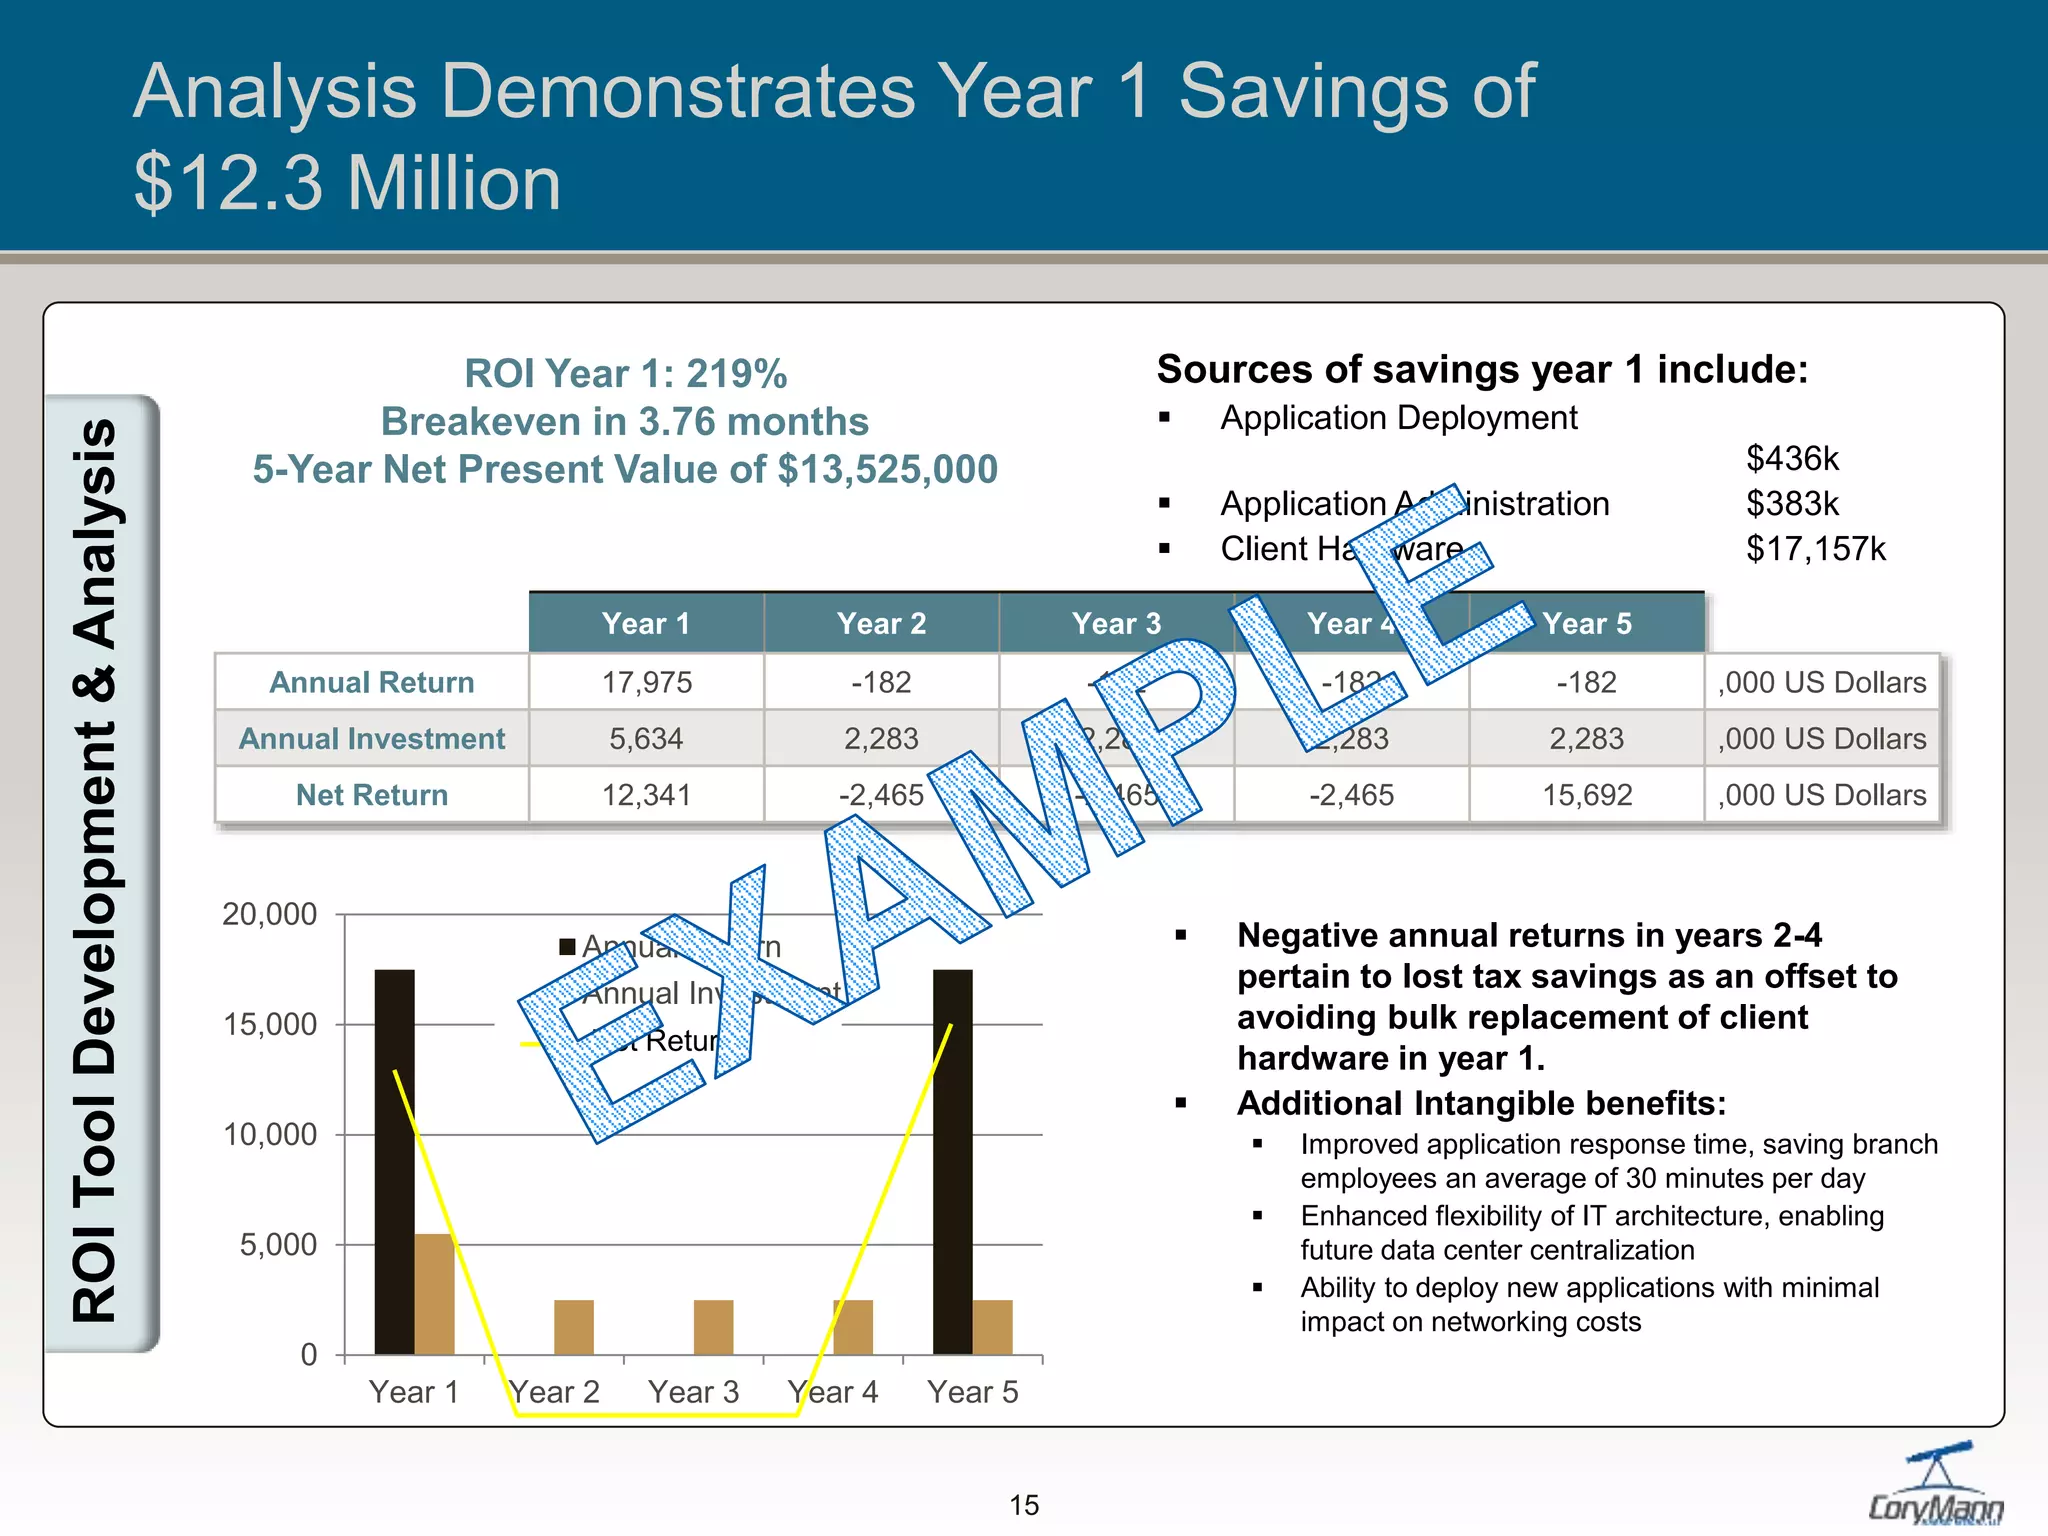

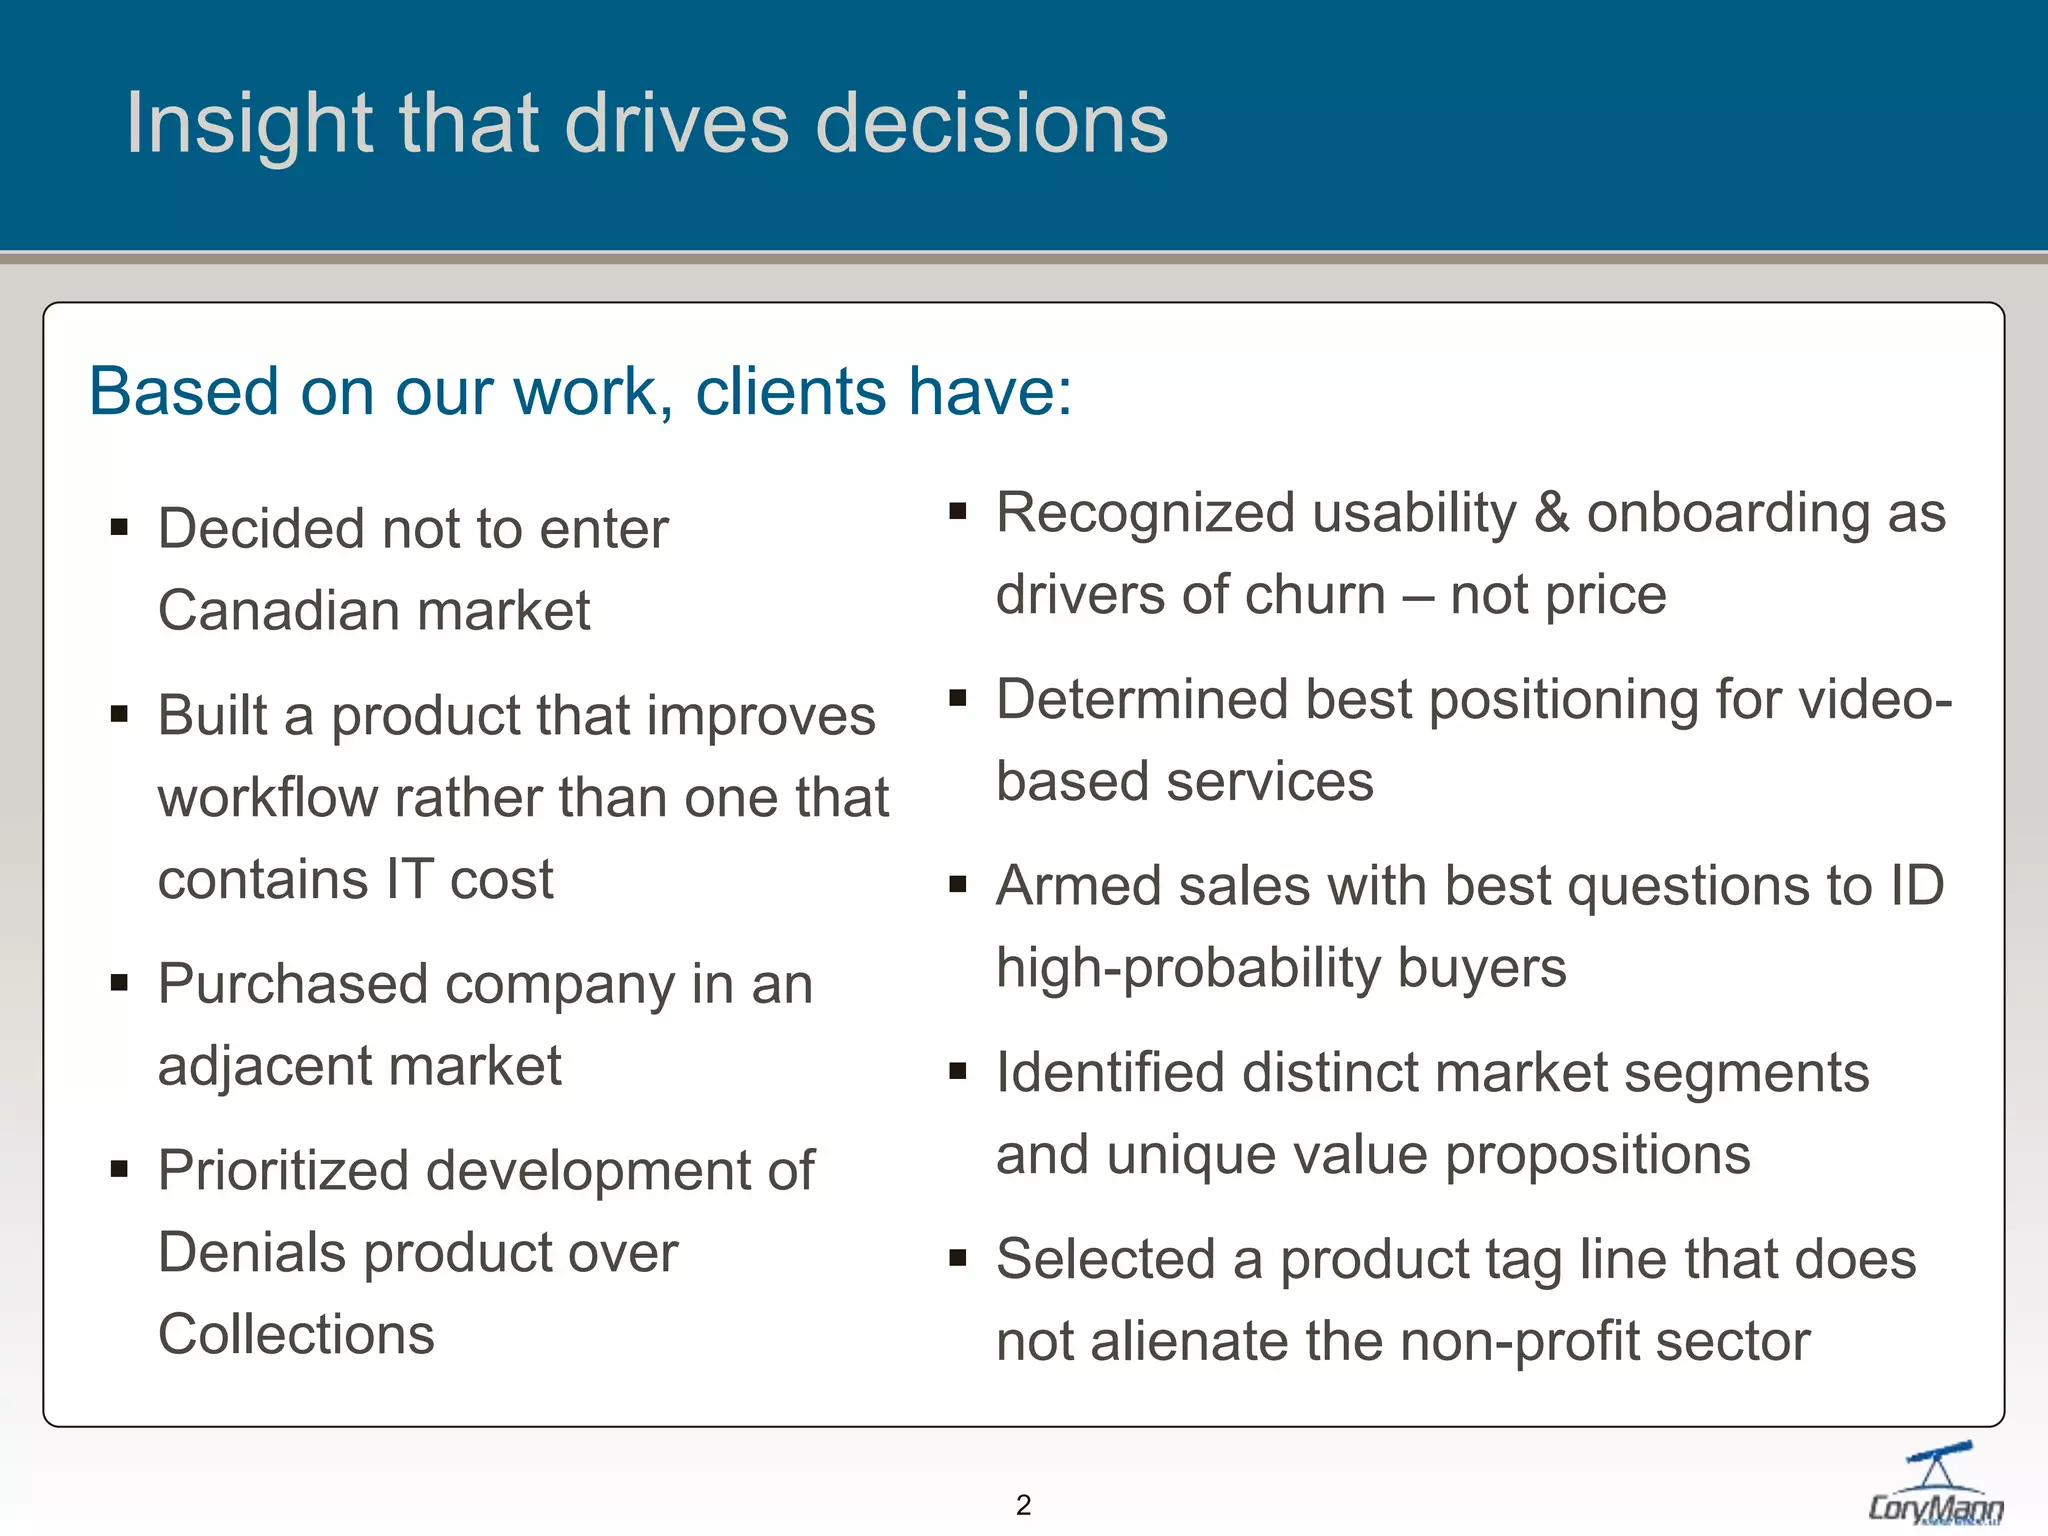
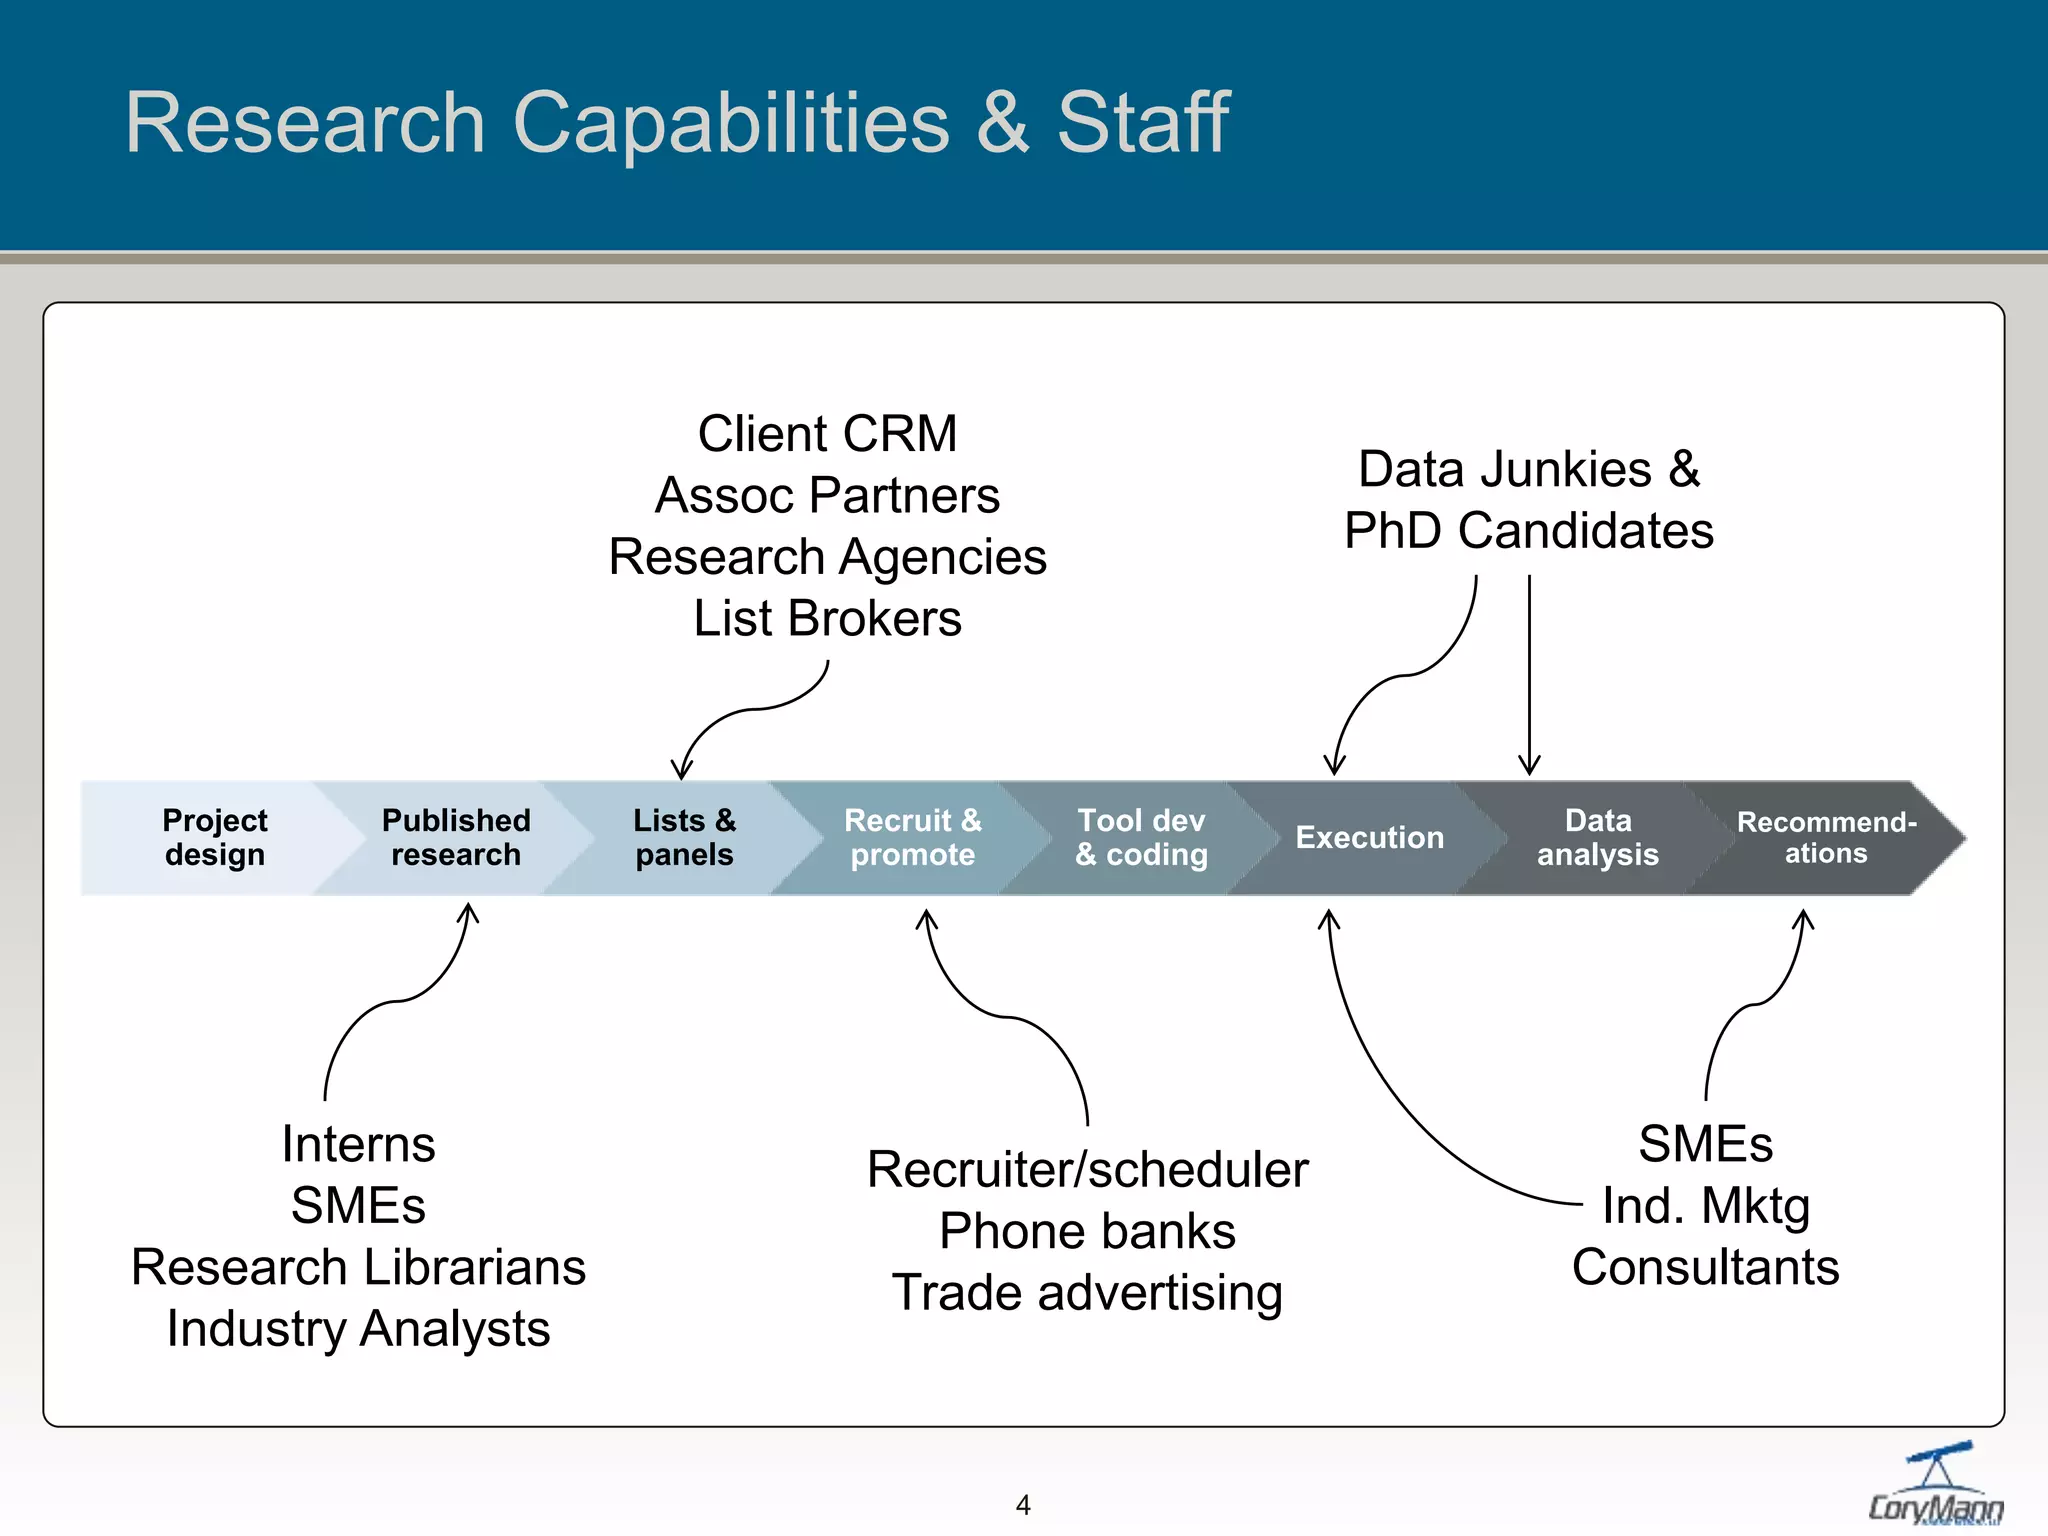
The document discusses insights gained from market research and client interactions that highlight the importance of usability and onboarding in reducing churn, alongside positioning video-based services effectively. It outlines strategies for demand creation, concept testing, and competitive intelligence, along with the identification of distinct market segments. Additionally, it includes details about various services offered, client feedback on existing products, and an analysis of investment returns, including significant cost savings from enhanced application deployment and administration.


