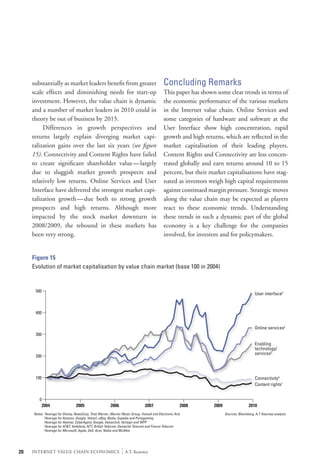
Downloaded 108 times

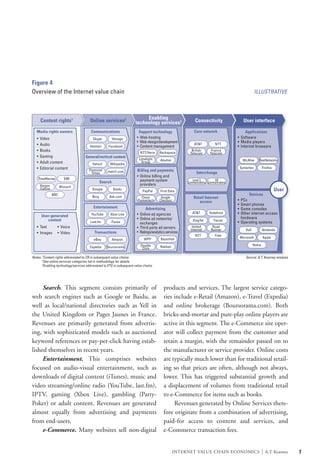
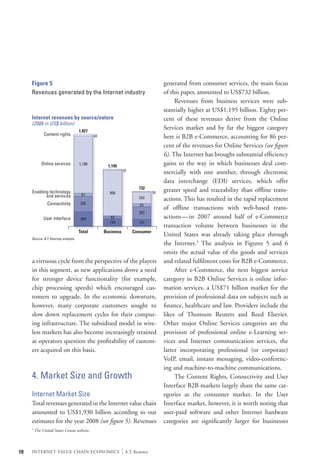
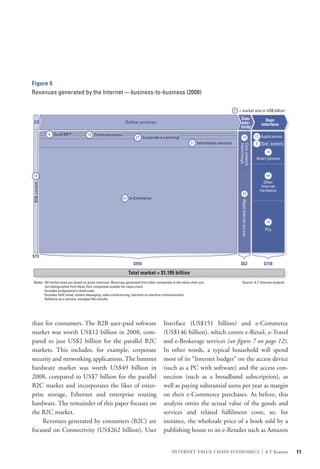
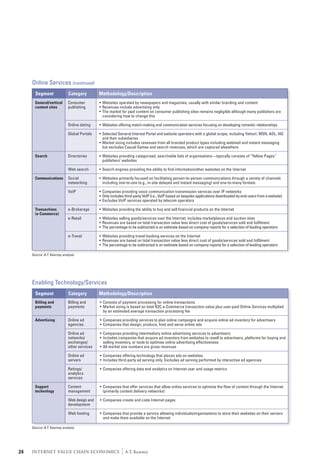
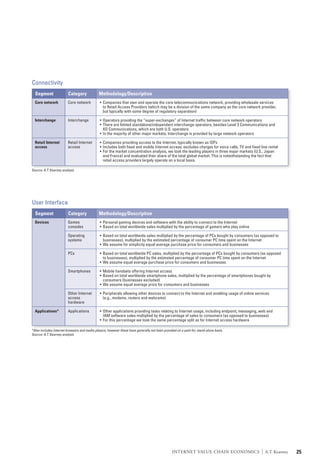


This document summarizes findings about the global internet value chain. It describes how the value chain has grown rapidly, with total revenues estimated at $1.9 trillion in 2008. More than 60% of revenues come from business-to-business activities, while consumer spending is largest for internet access and devices. Online services represent $242 billion in revenues, with search engines capturing over 1/3. The most concentrated and profitable parts of the value chain are online services like gaming, search, and hardware categories like smartphones and consoles. The internet continues to grow rapidly but its future development is uncertain.


