This document presents the results of a project to develop a standardized framework for measuring and reporting shipping industry performance. The project aimed to address inconsistencies and challenges in performance measurement by different companies. A three-phase methodology was used to evaluate existing indicators, develop a new performance hierarchy of indicators and indexes, and obtain stakeholder feedback. The result was a Shipping KPI Performance Hierarchy and an online Shipping KPI Depository for companies to upload and benchmark performance data according to the standardized framework. Areas for further research include validating the framework's calculations, expanding the Depository's functionality, and facilitating benchmarking through its use.
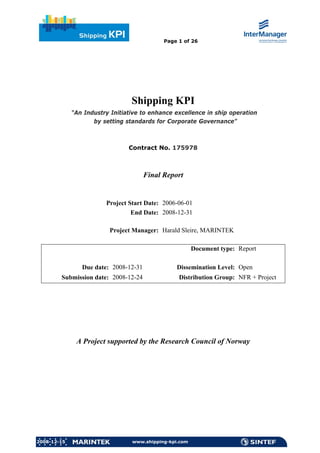


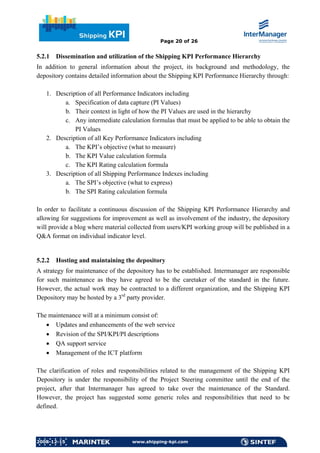


![The Shipping KPI Standard - Concept
Aggregated indexes for external communication
SPI
KPI Extended Balanced Score
Card for internal improvement
Processes
Customer
Learning
HSE
Financial Others
Corporate
PI measurements
Copyright © InterManager, the International Ship Managers' Association 200[8]
InterManager, Page 2](https://image.slidesharecdn.com/intermanagerkpi-120217054340-phpapp01/85/Intermanager-kpi-28-320.jpg)
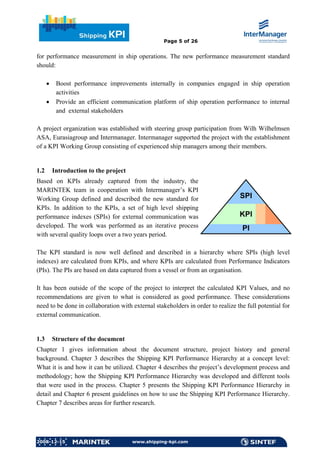
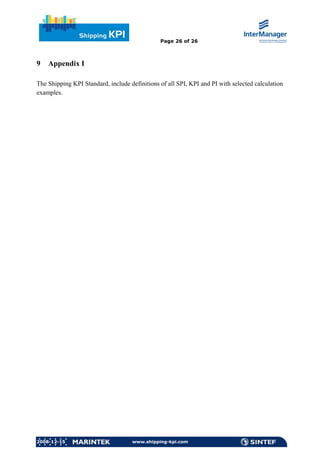
![For Further Information or Help
Contact:
Guy Morel Harald Sleire
guy.morel@intermanager.org harald.sleire@marintek.sintef.no
General Secretary Project Manager
InterManager MARINTEK
Phone +336 8086 0986 Phone +47 7359 5500
Or visit the Depository (fully implemented by 31/12-2008)
http://www.sintef.no/Projectweb/Shipping-KPI/
Copyright © InterManager, the International Ship Managers' Association 200[8]
InterManager, Page 3](https://image.slidesharecdn.com/intermanagerkpi-120217054340-phpapp01/85/Intermanager-kpi-29-320.jpg)

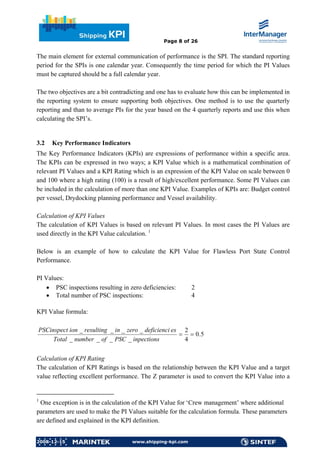
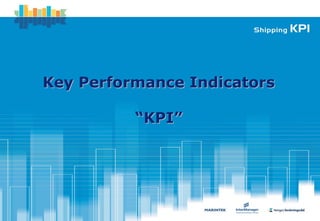
![The Shipping KPI Standard - SPIs
•• Environmental performance
Environmental performance
•• HR performance
HR performance
•• Safety performance
Safety performance
•• Security performance
Security performance
•• Technical Performance
Technical Performance
•• Navigation Performance
Navigation Performance
•• Operational Performance
Operational Performance
Copyright © InterManager, the International Ship Managers' Association 200[8]
InterManager, Page 5](https://image.slidesharecdn.com/intermanagerkpi-120217054340-phpapp01/85/Intermanager-kpi-31-320.jpg)
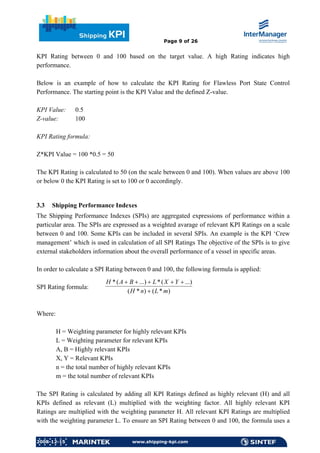
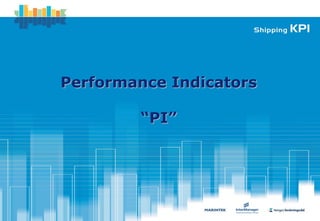
![SPI: Operational Performance
Operational Performance is a measure of the operational efficiency of the vessel including all cargo transport related
operations (safe and efficient cargo handling, transport timeliness, reliability and cost efficiency)
Highly Relevant KPIs (H): Relevant KPIs (L):
•A: Cargo incidents during cargo operations •J: Crew management
•B: Cargo incidents during voyage •K: Failures to critical equipment and systems
•C: Port state control detention •M: Crew planning
•D: Vessel availability •N: Flawless Port state control performance
•E: Budget control per vessel •O: Navigational Incidents
•F: Operational deficiencies •P: CO2 Emission
•G: Drydocking planning performance •Q: NOx emission
•R: SOx emission
•S: Accidental releases of substances as defined by MARPOL
•T: Contained spills
•U: Security deficiencies
SPI Rating Formula= (H*(A+B+C+D+E+F+G)) + (L*(J+K+M+N+O+P+Q+R+S+T+U))
(H*7) + (L*11)
Rating Parameters:
H=3
L=1
Copyright © InterManager, the International Ship Managers' Association 200[8]
InterManager, Page 6](https://image.slidesharecdn.com/intermanagerkpi-120217054340-phpapp01/85/Intermanager-kpi-32-320.jpg)
![SPI: Navigational Performance
Navigational Performance is a measure of the navigational incidents recorded for each vessels.
Navigational Incident is related to safe navigation.
Highly Relevant KPIs (H): Relevant KPIs (L):
•A: Navigational incidents •C: Crew management
•B: Navigational deficiencies •D: Failures of critical equipment and systems
•E: Crew planning
SPI Rating Formula = (H*(A+B)) + (L*(C+D+E))
(H*2) + (L*3)
Rating Parameters:
H=3
L=1
Copyright © InterManager, the International Ship Managers' Association 200[8]
InterManager, Page 7](https://image.slidesharecdn.com/intermanagerkpi-120217054340-phpapp01/85/Intermanager-kpi-33-320.jpg)
![SPI: Navigational Performance
Calculation Example
Highly Relevant KPIs (H): Relevant KPIs (L):
•A: Navigational incidents 80 •C: Crew management 70
•B: Navigational deficiencies 60 •D: Failures of critical equipment and systems 40
•E: Crew planning 45
SPI Rating Formula = (H*(A+B)) + (L*(C+D+E)) = (3 * (80 + 60)) + (1* (70 + 40 + 45)) = 420 + 155 = 64
(H*2) + (L*3) (3 * 2) + (1* 3) 9
Rating Parameters:
H=3
L=1
Copyright © InterManager, the International Ship Managers' Association 200[8]
InterManager, Page 8](https://image.slidesharecdn.com/intermanagerkpi-120217054340-phpapp01/85/Intermanager-kpi-34-320.jpg)
![SPI: Environmental Performance
Environmental Performance is a measure of emissions, spills and other forms of pollution that impact the environment,
caused by the vessel operations.
Recorded for each vessel.
Highly Relevant KPIs (H): Relevant KPIs (L):
•A: No of Violations of MARPOL Annex 1-6 •J: Crew management
•B: CO2 emission •K: Failures to critical equipment and systems
•C: NOx emission •M: Cargo incidents during cargo operations
•D: SOx emission •N: Crew planning
•E: Ballast water discharge violations •O: Cargo incidents during voyage
•F: Accidental releases of substances as def by MARPOL •P: Port state control detention
•G: Contained spills •Q: Flawless port state control performance
•I: Environmental deficiencies •R: Navigational incidents
SPI Rating Formula = (H*(A+B+C+D+E+F+G+I)) + (L*(J+K+M+N+O+P+Q+R))
(H*8) + (L*8)
Rating Parameters:
H=3
L=1
Copyright © InterManager, the International Ship Managers' Association 200[8]
InterManager, Page 9](https://image.slidesharecdn.com/intermanagerkpi-120217054340-phpapp01/85/Intermanager-kpi-35-320.jpg)
![SPI: Technical Performance
Technical Performance is a measure of the technical incidents for each vessel including technical breakdown and technical
underperformances.
Highly Relevant KPIs (H): Relevant KPIs (L):
•A: Failures to critical equipment and systems •C: Crew management
•B: Condition of class •D: Cargo incidents during cargo operations
•E: Crew planning
•F: Cargo incidents during voyage
•G: Port state control detention
•I: Flawless Port state control performance
•J: Navigational Incidents
•K: No of violations of MARPOL Annex 1-6
•M: CO2 emission
•N: NOx emission
•O: SOx emission
•P: Accidental releases of substances as defined by MARPOL
•Q: Contained spills
•R: Vessel availability
SPI Rating Formula = (H*(A+B)) + (L*(C+D+E+F+G+I+J+K+M+N+O+P+Q+R))
(H*2) + (L*14)
Rating Parameters:
H=3* * These weighting parameters will have to be updated as the
L=1* ratio of Highly relevant KPIs (H) and Relevant KPIs (L) is
2:14. This will be done in an eventual validation and
calibration of the overall calculation model
Copyright © InterManager, the International Ship Managers' Association 200[8]
InterManager, Page 10](https://image.slidesharecdn.com/intermanagerkpi-120217054340-phpapp01/85/Intermanager-kpi-36-320.jpg)
![SPI: Safety Performance
Safety Performance is a measure of accidents/incidents resulting in injuries or death. Environmental damage and safety
of assets and cargo are covered by different SPIs. An accident is a special form of incident involving injuries or death to
personnel (OSHAS 18001, ISO 18001).
Highly Relevant KPIs (H): Relevant KPIs (L):
•A: Flawless Port state control performance •E: Crew management
•B: LTIF •F: Failures to critical equipment and systems
•C: Safety deficiencies •G: Cargo incidents during cargo operations
•D: Fire and Explosions •I: Crew planning
•J: Cargo incidents during voyage
•K: Port state control detention
•M: Navigational incidents
•N: Crew behaviour
SPI Rating Formula = (H*(A+B+C+D)) + (L*(E+F+G+I+J+K+M+N))
(H*4) + (L*8)
Rating Parameters:
H=3 Note: We would also like to include near misses but the
L=1 challenge here is the reporting and quality of such.
Near misses are considered more leading than
lagging and inline with TMSA.
Copyright © InterManager, the International Ship Managers' Association 200[8]
InterManager, Page 11](https://image.slidesharecdn.com/intermanagerkpi-120217054340-phpapp01/85/Intermanager-kpi-37-320.jpg)
![SPI: Security Performance
Security Performance is a measure of security incidents (as described in the ISPS Code) recorded for each vessel.
A security incident is an intentional or unintentional breach of security (ref ISPS code).
Highly Relevant KPIs (H): Relevant KPIs (L):
•A: Security deficiencies •B: Crew management
•C: Crew planning
•D: Port state control detention
•E: Flawless port state control performance
•F: Crew behaviour
SPI Rating Formula = (H*A) + (L*(B+C+D+E+F))
(H) + (L*5)
Rating Parameters:
H=3
L=1
Copyright © InterManager, the International Ship Managers' Association 200[8]
InterManager, Page 12](https://image.slidesharecdn.com/intermanagerkpi-120217054340-phpapp01/85/Intermanager-kpi-38-320.jpg)
![SPI: HR Performance
Human Resources Performance is a measure of the company's ability to employ, retain and develop personnel with the
required competences in order to ensure safe and efficient operations of the vessels.
Highly Relevant KPIs (H): Relevant KPIs (L):
•B: Crew planning •F: Cargo incidents during cargo operations
•A: Crew management •G: Cargo incidents during voyage
•C: Crew behaviour •I: Navigational incidents
•D: LTSF •J: No of violations of MARPOL Annex 1-6
•E: HR deficiencies •K: Ballast water discharge violations
•M: Security deficiencies
•N: Vessel availability
•O: LTIF
SPI Rating Formula = (H*(A+B+C+D+E)) + (L*(F+G+I+J+K+M+N+O))
(H*5) + (L*8)
Rating Parameters:
H=3
L=1
Copyright © InterManager, the International Ship Managers' Association 200[8]
InterManager, Page 13](https://image.slidesharecdn.com/intermanagerkpi-120217054340-phpapp01/85/Intermanager-kpi-39-320.jpg)
![The Shipping KPI Standard - KPIs
• • Accidental releases of substances as def by MARPOL
Accidental releases of substances as def by MARPOL • • HR deficiencies
HR deficiencies
• • Ballast Water Discharge Violations
Ballast Water Discharge Violations • • Lost Time Injury Frequency
Lost Time Injury Frequency
• • Budget control per vessel
Budget control per vessel • • Lost Time Sickness Frequency
Lost Time Sickness Frequency
• • Cargo incidents during cargo operations
Cargo incidents during cargo operations • • Navigational deficiencies
Navigational deficiencies
• • Cargo incidents during voyage
Cargo incidents during voyage • • Navigational Incidents
Navigational Incidents
• • CO2 emissions
CO2 emissions • • No of Violations of MARPOL Annex 1-6
No of Violations of MARPOL Annex 1-6
• • Condition of Class
Condition of Class • • NOx emissions
NOx emissions
• • Contained Spills
Contained Spills • • Operational deficiencies
Operational deficiencies
• • Crew behaviour
Crew behaviour • • Port state control deficiency rate
Port state control deficiency rate
• • Crew management
Crew management • • Port state control detention
Port state control detention
• • Crew planning
Crew planning • • Safety deficiencies
Safety deficiencies
• • Drydocking Planning Performance
Drydocking Planning Performance • • Security deficiencies
Security deficiencies
• • Environmental deficiencies
Environmental deficiencies • • SOx emissions
SOx emissions
• • Failure of critical equipment and systems
Failure of critical equipment and systems • • Vessel availability
Vessel availability
• • Fire and Explosions
Fire and Explosions
• • Flawless Port state control performance
Flawless Port state control performance
Copyright © InterManager, the International Ship Managers' Association 200[8]
InterManager, Page 15](https://image.slidesharecdn.com/intermanagerkpi-120217054340-phpapp01/85/Intermanager-kpi-41-320.jpg)
![KPI: Accidental releases of substances as def by MARPOL
Accidental discharges to the environment in violation of MARPOL in a calendar year.
Due to difficulties related to measuring the actual volume/quantity of a spill, only number of spills are counted.
Measured per vessel for internal improvement as well as external communication (input to SPIs).
Relevant PIs:
•A: Total number of accidental releases of substances covered by MARPOL, to the environment
•B: Severe spills of bulk liquid
KPI Value Formula= A+B
KPI Rating Formula= 0 = 100 rating
1 = 50 rating
> 1 = 0 rating
Rating Parameters: N/A
This KPI counts the number of (severe) spills of liquid and accidental releases of substances. A severe spill is a spill above
one barrel.
Copyright © InterManager, the International Ship Managers' Association 200[8]
InterManager, Page 16](https://image.slidesharecdn.com/intermanagerkpi-120217054340-phpapp01/85/Intermanager-kpi-42-320.jpg)
![KPI: Ballast water discharge violations
Any discharge or exchange of ballast water (or lack of doing so) in a calendar year, not in compliance with applicable rules
and regulations
Relevant PIs:
•Ballast water discharge violations
KPI Value Formula= ∑ Ballast water discharge violations
KPI Rating Formula= 0 = 100 rating
1 = 50 rating
> 1 = 0 rating
This KPI counts the number of times where prevailing regulations regarding treatment of ballast water has been violated
Copyright © InterManager, the International Ship Managers' Association 200[8]
InterManager, Page 17](https://image.slidesharecdn.com/intermanagerkpi-120217054340-phpapp01/85/Intermanager-kpi-43-320.jpg)
![KPI: Budget control per vessel
The overall costs deviation (management, purchasing, operation, M&R, crewing) vs. budgets. Show the ability of the ship
manager to effectively plan the ship’s operating costs (e.g. predictable costs, good budgeting). The cost deviation is
adjusted for agreed additional expenditure.
Measured per fiscal year.
Measured per vessel for internal improvement as well as external communication (input to SPIs)
Relevant PIs:
•Vessel running cost budget
•Actual running costs and accruals
•Additional Authorized Expenses (AAE)
|| Vessel running cost budget - (Actual running costs and accruals - AAE) ||
KPI Value Formula= ∗100%
Vessel running cost budget
KPI Rating Formula= 100-(Z*KPI Value)
Rating Parameters: Z= 10
This KPI measures the deviations from the vessel's running cost budget in percentage by comparing it to the vessel's
actual running costs and accruals and taking into account additional authorized expense (AAE) as these expenses are in
fact altering the vessel's running cost budget by being authorized/approved by the ship owner. As the KPI measures
deviations both positive and negative, the KPI Value is always converted to a positive value
Copyright © InterManager, the International Ship Managers' Association 200[8]
InterManager, Page 18](https://image.slidesharecdn.com/intermanagerkpi-120217054340-phpapp01/85/Intermanager-kpi-44-320.jpg)
![KPI: Budget control per vessel
Calculation Example
Relevant PIs:
•Vessel running cost budget 1,2M USD
•Actual running costs and accruals 1,5M USD
•Additional Authorized Expenses (AAE) 0,25M USD
KPI Value Formula= || 1,2 − (1,5 − 0,25) ||
|| Vessel running cost budget - (Actual running costs and accruals - AAE) ||
∗100%
= ∗100% = 4,17%
Vessel running cost budget 1,2
KPI Rating Formula= 100-(Z*KPI Value) = 100 – (10*4,17) = 100 – 41,7 = 58,3
Rating Parameters: Z= 10
Please note that as we are measuring deviations both positive and negative, the KPI Value is always converted to a
positive.
Copyright © InterManager, the International Ship Managers' Association 200[8]
InterManager, Page 19](https://image.slidesharecdn.com/intermanagerkpi-120217054340-phpapp01/85/Intermanager-kpi-45-320.jpg)
![KPI: Cargo incidents during cargo operations
The total number of received claims concerning damaged or lost cargo or injured passengers during cargo operations in a
calendar year. Made relative to the total number of cargo units transported in a calendar year. Measured per vessel for
internal improvement as well as external communication (input to SPIs)
Relevant PIs:
•Total number of damaged or lost cargo units or passengers injured during cargo handling
•Total number of cargo units or passengers transported
KPI Value Formula=
Total number of damaged or lost cargo units or passengers injured during cargo handling
Total number of cargo units or passengers transported
KPI Rating Formula= 100-(Z*KPI Value)
Rating Parameters: Z= 100000
This KPI represents a ratio between the total quantity of damaged or lost cargo or injured passengers (during handling
operations such as loading cargo or boarding passengers) relative to the total quantity of cargo or number of passengers
handled in a calendar year. By defining the KPI as a ratio, benchmarking is feasible even between different vessel sizes.
Copyright © InterManager, the International Ship Managers' Association 200[8]
InterManager, Page 20](https://image.slidesharecdn.com/intermanagerkpi-120217054340-phpapp01/85/Intermanager-kpi-46-320.jpg)
![KPI: Cargo incidents during cargo operations
Calculation Example
Relevant PIs:
•Total number of damaged or lost cargo units or passengers injured during cargo handling 4
•Total number of cargo units or passengers transported 150.000
KPI Value Formula=
4
Total number of damaged or lost cargo units or passengers injured during cargo handling
Total number of cargo units or passengers transported
= = 2,6 *10 −5
150.000
5 -5
KPI Rating Formula= 100-(Z*KPI Value) = 100 – (10 *2,6*10 ) = 100 – 2,6 = 97,4
5
Rating Parameters: Z= 100000 = 10
A KPI Value of 0,001 will give zero rating, 1000 units destroyed out of one million transported
Copyright © InterManager, the International Ship Managers' Association 200[8]
InterManager, Page 21](https://image.slidesharecdn.com/intermanagerkpi-120217054340-phpapp01/85/Intermanager-kpi-47-320.jpg)
![KPI: Cargo incidents during voyage
The total number of received claims concerning damaged or lost cargo or injured passengers during voyage in a calendar
year. Made relative to the total number of cargo units transported in a calendar year. Measured per vessel for internal
improvement as well as external communication (input to SPIs)
Relevant PIs:
•Total number of damaged or lost cargo units or passengers injured during voyage
•Total number of cargo units or passengers transported
KPI Value Formula=
Total number of damaged or lost cargo units or passengers injured during voyage
Total number of cargo units or passengers transported
KPI Rating Formula= 100-(Z*KPI Value)
Rating Parameters: Z= 1000000
This KPI represents a ratio between the total quantity of damaged or lost cargo or injured passengers (during the actual
sea voyage) relative to the total quantity of cargo or number of passengers transported in a calendar year. By defining the
KPI as a ratio, benchmarking is feasible even between different vessel sizes.
Copyright © InterManager, the International Ship Managers' Association 200[8]
InterManager, Page 22](https://image.slidesharecdn.com/intermanagerkpi-120217054340-phpapp01/85/Intermanager-kpi-48-320.jpg)
![KPI: Cargo incidents during voyage
Calculation Example
Relevant PIs:
•Total number of damaged or lost cargo units or passengers injured during voyage 4
•Total number of cargo units or passengers transported 150.000
KPI Value Formula=
4
Total number of damaged or lost cargo units or passengers injured during voyage
Total number of cargo units or passengers transported
= = 2,6 *10 −5
150.000
6 -5
KPI Rating Formula= 100-(Z*KPI Value) = 100 – (10 *2,6*10 ) = 100 – 26 = 74
6
Rating Parameters: Z= 1000000 = 10
A KPI Value of 0,0001 will give zero rating, 100 units destroyed out of one million transported
Copyright © InterManager, the International Ship Managers' Association 200[8]
InterManager, Page 23](https://image.slidesharecdn.com/intermanagerkpi-120217054340-phpapp01/85/Intermanager-kpi-49-320.jpg)
![KPI: CO2 emissions
The estimated CO2 efficiency in a calendar year. Measured per vessel for external communication (input to SPIs)
Relevant PIs:
•Emitted Mass CO2
•Transport Work
6
KPI Value Formula= Emitted Mass CO2*10
Transport Work
KPI Rating Formula= 100-(Z*KPI Value)
Rating Parameters: Z=7
This KPI compares emitted mass of CO2 to the vessel’s total transport work, hereby stating the value achieved (transport
work) by the emission of CO2. As the PI ’Emitted Mass CO2 is to be given in tons, the PI’s value is multiplied by 1 million
to get the KPI value in g/transport work (tonmile, passengermile, TEUmile, etc).
Copyright © InterManager, the International Ship Managers' Association 200[8]
InterManager, Page 24](https://image.slidesharecdn.com/intermanagerkpi-120217054340-phpapp01/85/Intermanager-kpi-50-320.jpg)
![KPI: CO2 emissions
Calculation Example
Relevant PIs:
•Emitted Mass CO2 103.500 ton
•Transport Work 20.710.647.000 tonmile
6
KPI Value Formula= Emitted Mass CO2*10 103500 *106
Transport Work = = 4,98 g / tonmile
20710647000
KPI Rating Formula= 100-(Z*KPI Value) = 100 – (7 * 4,98) = 65,1
Rating Parameters: Z=7
Some typical emission factors
Ship Type Index unit CO2 NOx SOx
LNG Tanker g/ tonmile 66,5 1,9 1,2
Z value to be updated (agreed), and need to be differentiated Chemical Tanker g/ tonmile 23,5 0,7 0,4
between ship size and other factors Crude Oil Tanker g/ tonmile 8 0,2 0,1
Bulk Dry g/ tonmile 7,6 0,2 0,1
Container g/ tonmile 96,5 2,7 1,7
Refrigerated Cargo g/ tonmile 124,3 3,5 2,2
RO-RO Cargo g/ tonmile 94,9 1,8 1,7
Copyright © InterManager, the International Ship Managers' Association 200[8]
InterManager, Page 25](https://image.slidesharecdn.com/intermanagerkpi-120217054340-phpapp01/85/Intermanager-kpi-51-320.jpg)
![KPI: Condition of class
All condition of class in a calendar year. Condition of class is a written statement from class (ref. IACS). All categories of
CoC are counted equally.
Measured per vessel for internal improvement as well as external communication (input to SPIs)
Relevant PIs:
•Condition of class
KPI Value Formula= ∑Conditions of class
KPI Rating Formula= 100-(Z*KPI Value)
Rating Parameters: Z= 20
This KPI counts the total number of Conditions of Class issued. Conditions of class is not measured as a ratio because the
potential denominator (total no of inspections where CoCs can be stated) is said to be relatively low between all vessels
Copyright © InterManager, the International Ship Managers' Association 200[8]
InterManager, Page 26](https://image.slidesharecdn.com/intermanagerkpi-120217054340-phpapp01/85/Intermanager-kpi-52-320.jpg)
![KPI: Condition of class
Calculation Example
Relevant PIs:
•Condition of class = 3
KPI Value Formula= ∑Conditions of class = 3
KPI Rating Formula= 100-(Z*KPI Value) = 100 – 20*3 = 40
Rating Parameters: Z= 20
Copyright © InterManager, the International Ship Managers' Association 200[8]
InterManager, Page 27](https://image.slidesharecdn.com/intermanagerkpi-120217054340-phpapp01/85/Intermanager-kpi-53-320.jpg)
![KPI: Contained Spills
Contained spills should cover liquid spills including cargo and bunkers contained on the vessel. Summarized per calendar
year.
Measured per vessel for internal improvement as well as external communication (input to SPIs).
Relevant PIs:
•Total no of contained spills of bulk liquid
KPI Value Formula= ∑ Number of contained spills of bulk liquid
KPI Rating Formula= 100-(Z*KPI Value)
Rating Parameters: Z= 33,33
Some spills are contained but still represent an incident that should be recorded. This KPI counts the total number of
contained spills and is complementary to the KPI ‘Accidental releases of substances as def by MARPOL, to the
environment’. No denominator has been proven necessary for benchmarking purposes
Copyright © InterManager, the International Ship Managers' Association 200[8]
InterManager, Page 28](https://image.slidesharecdn.com/intermanagerkpi-120217054340-phpapp01/85/Intermanager-kpi-54-320.jpg)
![KPI: Contained Spills
Calculation Example
Relevant PIs:
•Total no of contained spills of bulk liquid 2
KPI Value Formula= ∑ Number of contained spills of bulk liquid = 2
KPI Rating Formula= 100-(Z*KPI Value) = 100 – 33,3*2 = 33,4
Rating Parameters: Z= 33,33
Copyright © InterManager, the International Ship Managers' Association 200[8]
InterManager, Page 29](https://image.slidesharecdn.com/intermanagerkpi-120217054340-phpapp01/85/Intermanager-kpi-55-320.jpg)
![KPI: Crew behaviour
The behaviour of the crew on a vessel. Counted per calendar year and made relative to the average number of crew
onboard the vessel in a calendar year. If one incident of the same crew breach several categories, each breach should be
counted individually.
Measured per vessel for internal improvement as well as external communication (input to SPIs)
Relevant PIs:
•A: Absconded Crew
•B: Criminal offence
•C: Drugs or alcohol abused
•D: No of dismissed crew
•E: No of logged warnings
•F: Total Exposure hours
KPI Value Formula= (A+B+C+D+E)*(24*365)
F
KPI Rating Formula= 100-(Z*KPI Value)
Rating Parameters: Z= 1000
This KPI counts the total number of breaches of code of conduct made by the vessel's crew such as substance abuse,
criminal offences and AWOLs.
As the number of crew on different vessels vary significantly, total exposure hours (divided by 24*365 to represent the
average number of crew onboard the vessel) is used as a denominator to enable benchmarking
Copyright © InterManager, the International Ship Managers' Association 200[8]
InterManager, Page 30](https://image.slidesharecdn.com/intermanagerkpi-120217054340-phpapp01/85/Intermanager-kpi-56-320.jpg)
![KPI: Crew behaviour
Calculation Example
Relevant PIs:
•A: Absconded Crew 0
•B: Criminal offence 0
•C: Drugs or alcohol abused 0
•D: No of dismissed crew 0
•E: No of logged warnings 1
•F: Total Exposure hours 90.000 (approximately 10 persons onboard)
KPI Value Formula= (A+B+C+D+E)*(24*365) = (0 + 0 + 0 + 0 + 1) * 24 * 365 = 0,0973
F 90000
KPI Rating Formula= 100-(Z*KPI Value) = 100 – 1000*0,0973 = 100 – 97,3 = 2,7
Rating Parameters: Z= 1000
Copyright © InterManager, the International Ship Managers' Association 200[8]
InterManager, Page 31](https://image.slidesharecdn.com/intermanagerkpi-120217054340-phpapp01/85/Intermanager-kpi-57-320.jpg)
![KPI: Crew management
The KPI measures the ship management organisation's ability to acquire and maintain the required competence/crew for
their operations.
Measured per calendar year. Measured as a company KPI for internal improvement as well as external communication
(input to SPIs)
Relevant PIs:
•D: Training days
•E: Officer working days
•F: Number of new cadets
•G: Average number of vessels under management
•H: Officer retention rate
D F
A∗ + B∗ +C∗H
KPI Value Formula= E G
KPI Value Parameters: A=60,83
B=2
C=4
KPI Rating Formula= (Z*KPI Value) - 100
Rating Parameters: Z= 35
This KPI combines the training effort, ability to have new cadets onboard and the officer retention rate to express crew
management capability of the ship manager. Due to the different score-range for the three ratios, three value parameters
(A, B and C) are introduced
Copyright © InterManager, the International Ship Managers' Association 200[8]
InterManager, Page 32](https://image.slidesharecdn.com/intermanagerkpi-120217054340-phpapp01/85/Intermanager-kpi-58-320.jpg)
![KPI: Crew management
Calculation Example
Relevant PIs:
•D: Training days 20
•E: Officer working days 1825 (crew of 5)
•F: Number of new cadets 11
•G: Average number of vessels under management 10
•H: Officer retention rate 66,4
D F 20 11
KPI Value Formula= = A∗ + B ∗ + C ∗ H = 60,83 * + 2 * + 0,04 * 66,4 = 0,666 + 2,2 + 2,66 = 5,526
E G 1825 10
KPI Value Parameters: A=60,83
B=2
C=0,04
KPI Rating Formula= (Z*KPI Value) – 100 = 35*5,526 – 100 = 93,4
Rating Parameters: Z= 35
Copyright © InterManager, the International Ship Managers' Association 200[8]
InterManager, Page 33](https://image.slidesharecdn.com/intermanagerkpi-120217054340-phpapp01/85/Intermanager-kpi-59-320.jpg)
![KPI: Crew planning
The ship management organisation’s performance in crew planning.
Measured per calendar year.
Measured as a vessel KPI for internal improvement as well as external communication (input to SPIs)
Relevant PIs:
•No of crew not relieved on time
•Violation of rest hours
KPI Value Formula= No of crew not relieved on time + Violation of rest hours
KPI Rating Formula= 100-(Z*KPI Value)
Rating Parameters: Z= 10
This KPI count the ship manager's ability to relieve crew on time as well as avoiding violations of rest hours.
Copyright © InterManager, the International Ship Managers' Association 200[8]
InterManager, Page 34](https://image.slidesharecdn.com/intermanagerkpi-120217054340-phpapp01/85/Intermanager-kpi-60-320.jpg)
![KPI: Crew planning
Calculation Example
Relevant PIs:
•No of crew not relieved on time 1
•Violation of rest hours 4
KPI Value Formula= No of crew not relieved on time + Violation of rest hours = 1 + 4 = 5
KPI Rating Formula= 100-(Z*KPI Value) = 100 – 10*5 = 50
Rating Parameters: Z= 10
Copyright © InterManager, the International Ship Managers' Association 200[8]
InterManager, Page 35](https://image.slidesharecdn.com/intermanagerkpi-120217054340-phpapp01/85/Intermanager-kpi-61-320.jpg)
![KPI: Drydocking planning performance
The deviations (positive or negative) from scheduled drydocking plan related to time and costs per drydocking.
Summarized per 5 year rolling time period. Measured per vessel for internal improvement as well as external
communication (input to SPIs)
Relevant PIs:
•Agreed drydocking duration
•Actual drydocking duration
•Agreed drydocking costs
•Actual drydocking costs
Actual drydocking duration - Agreed drydocking duration Actual drydocking costs - Agreed drydocking costs
KPI Value Formula= ∗100% + ∗100%
Agreed drydocking duration Agreed drydocking costs
KPI Rating Formula= 100-(Z*KPI Value)
Rating Parameters: Z= 2
This KPI measures the deviations from planned duration and costs of a vessel's drydocking in percentage.
Both 'positive' and 'negative' deviations are treated equally as the KPI measures the ship managers' ability to create
accurate plans and not their ability to cut time and costs
Copyright © InterManager, the International Ship Managers' Association 200[8]
InterManager, Page 36](https://image.slidesharecdn.com/intermanagerkpi-120217054340-phpapp01/85/Intermanager-kpi-62-320.jpg)
![KPI: Drydocking planning performance
Calculation Example
Relevant PIs:
•Agreed drydocking duration 14 days
•Actual drydocking duration 16 days
•Agreed drydocking costs 4M USD
•Actual drydocking costs 3,9M USD
KPI Value Formula=
Actual drydocking duration - Agreed drydocking duration Actual drydocking costs - Agreed drydocking costs
*100 + *100
Agreed drydocking duration Agreed drydocking costs
16 − 14 3,9 − 4
= *100 + *100 = 14,3 + 2,5 = 16,8
14 4
KPI Rating Formula= 100-(Z*KPI Value) = 100 – 2 * 16,8 = 100 – 33,6 = 66,4
Rating Parameters: Z= 2
Be aware that it is the absolute value of the deviation that is used, so both negative and positive deviations reduces your
performance
Copyright © InterManager, the International Ship Managers' Association 200[8]
InterManager, Page 37](https://image.slidesharecdn.com/intermanagerkpi-120217054340-phpapp01/85/Intermanager-kpi-63-320.jpg)
![KPI: Environmental deficiencies
Environment-related deficiencies, observations and non-conformances, recorded during external inspections and audits in
a calendar year. Made relative to the total number of external inspections in a calendar year.
Measured per vessel for internal improvement as well as external communication (input to SPIs)
Relevant PIs:
•Total number of environmental related deficiencies
•Total number of recorded external inspections
KPI Value Formula= Total number of Environmental related deficiencies
Total number of recorded external inspections
KPI Rating Formula= 100-(Z*KPI Value)
Rating Parameters: Z= 33,33
This KPI is part of a range of KPIs related to deficiencies that are identified during external inspections. These deficiencies
are categorized depending on their nature such as deficiencies related to environmental issues such as a failure in the Oily
Water Separator (OWS).
The total number of recorded external inspection is used as a denominator in all these KPIs (related to deficiencies) to
enable benchmarking between vessels that are subject to a uneven number of external inspection.
Copyright © InterManager, the International Ship Managers' Association 200[8]
InterManager, Page 38](https://image.slidesharecdn.com/intermanagerkpi-120217054340-phpapp01/85/Intermanager-kpi-64-320.jpg)
![KPI: Environmental deficiencies
Calculation Example
Relevant PIs:
•Total number of Environmental related deficiencies 13
•Total number of recorded external inspections 3
KPI Value Formula= Total no of Environmental related deficiencies 13
= = 4,33
Total number of recorded external inspections 3
KPI Rating Formula= 100-(Z*KPI Value) = 100 – 33,33*4,33 = 100 – 144,4 = 0 NB!
Rating Parameters: Z= 33,33
Worse performance than zero is not recorded. The rating will in this example give a negative number but the KPI Rating is
still zero.
Copyright © InterManager, the International Ship Managers' Association 200[8]
InterManager, Page 39](https://image.slidesharecdn.com/intermanagerkpi-120217054340-phpapp01/85/Intermanager-kpi-65-320.jpg)
![KPI: Failure of critical equipment and systems
The total number of failures to equipment and systems in the critical list (as required by the ISM code 10.3 and defined in
the company Safety Management System) resulting in whole or partial unavailability in a calendar year.
Measured per vessel for internal improvement as well as external communication (input to SPIs)
Relevant PIs:
•Failure of critical equipment and systems
KPI Value Formula= ∑Failure of critical equipment and systems
KPI Rating Formula= 100-(Z*KPI Value)
Rating Parameters: Z= 20
As the vessels’ critical lists may vary in size it could be argued that e.g. the number of items on the list could be used as a
denominator for benchmarking purposes. In any case, a failure to a critical equipment or system is a serious matter,
regardless of the number of items in the vessel’s critical list, and the KPI ’Failure to critical equipment and systems is kept
without a denominator
Copyright © InterManager, the International Ship Managers' Association 200[8]
InterManager, Page 40](https://image.slidesharecdn.com/intermanagerkpi-120217054340-phpapp01/85/Intermanager-kpi-66-320.jpg)
![KPI: Failure of critical equipment and systems
Calculation Example
Relevant PIs:
•Failure of critical equipment and systems =3
KPI Value Formula= ∑Failure of critical equipment and systems = 3
KPI Rating Formula= 100-(Z*KPI Value) = 100 – 20*3 = 40
Rating Parameters: Z= 20
Copyright © InterManager, the International Ship Managers' Association 200[8]
InterManager, Page 41](https://image.slidesharecdn.com/intermanagerkpi-120217054340-phpapp01/85/Intermanager-kpi-67-320.jpg)
![KPI: Fire and Explosions
The total number of fire and explosions incidents in a calendar year. Measured per vessel for internal improvement as well
as external communication (input to SPIs)
Relevant PIs:
•Total number of fire incidents
•Total number of explosion incidents
KPI Value Formula= Total number of fire incidents + Total number of explosion incidents
KPI Rating Formula= 0 = 100 rating
1 = 50 rating
> 1 = 0 rating
Rating Parameters: N/A
This KPI counts the total number of incidents related to fire and explosions
Copyright © InterManager, the International Ship Managers' Association 200[8]
InterManager, Page 42](https://image.slidesharecdn.com/intermanagerkpi-120217054340-phpapp01/85/Intermanager-kpi-68-320.jpg)
![KPI: Flawless Port state control performance
The ratio of port state control inspections resulting in zero deficiencies in a calendar year compared to the total number of
PSC inspections. Measured per vessel for internal improvement as well as external communication (input to SPIs)
Relevant PIs:
•PSC inspections resulting in zero deficiencies
•Total number of PSC inspections
KPI Value Formula= PSC inspections resulting in zero deficiencies
Total number of PSC inspections
KPI Rating Formula= Z*KPI Value
Rating Parameters: Z= 100
This KPI is one of three KPIs related to Port State Control Inspections. The three areas covered are; 'Port state control
deficiency rate' which measures the ratio of the total number of issued deficiencies during port state control inspection
against the total number of port state control inspections conducted, 'Port state control detention' which measures the
total number of port state control inspections resulting in a detention and this specific KPI, 'Flawless port state control
performance' which measures the percentage of port state controls resulting in zero deficiencies against the total number
of port state control inspections conducted
Copyright © InterManager, the International Ship Managers' Association 200[8]
InterManager, Page 43](https://image.slidesharecdn.com/intermanagerkpi-120217054340-phpapp01/85/Intermanager-kpi-69-320.jpg)
![KPI: Flawless Port state control performance
Calculation Example
Relevant PIs:
•PSC inspections resulting in zero deficiencies 2
•Total number of PSC inspections 4
KPI Value Formula= PSC inspections resulting in zero deficiencies 2
= = 0,5
Total number of PSC inspections 4
KPI Rating Formula= Z*KPI Value = 100 *0,5 = 50
Rating Parameters: Z= 100
Copyright © InterManager, the International Ship Managers' Association 200[8]
InterManager, Page 44](https://image.slidesharecdn.com/intermanagerkpi-120217054340-phpapp01/85/Intermanager-kpi-70-320.jpg)
![KPI: HR deficiencies
HR-related deficiencies, observations and non-conformances, recorded in external inspections and audits in a calendar
year. Made relative to the total number of external inspections in a calendar year.
Measured per vessel for internal improvement as well as external communication (input to SPIs)
Relevant PIs:
•Total number of HR related deficiencies
•Total number of recorded external inspections
KPI Value Formula Total number of HR related deficiencies
Total number of recorded external inspections
KPI Rating Formula= 100-(Z*KPI Value)
Rating Parameters: Z= 33,33
This KPI is part of a range of KPIs related to deficiencies that are identified during external inspections. These deficiencies
are categorized depending on their nature such as deficiencies related to HR issues such as lack of compliance to resting-
hours.
The total number of recorded external inspection is used as a denominator in all these KPIs to enable benchmarking
between vessels that are subject to a uneven number of external inspection.
Copyright © InterManager, the International Ship Managers' Association 200[8]
InterManager, Page 45](https://image.slidesharecdn.com/intermanagerkpi-120217054340-phpapp01/85/Intermanager-kpi-71-320.jpg)
![KPI: Lost Time Injury Frequency
The number of Lost Time Injuries (LTI) per million exposure hours (OCIMF). Exposure hours are 24 hours per day while
serving onboard. Note that injuries during spare-time on board are also included. LTI is the sum of Fatalities, Permanent
Total Disabilities, Permanent Partial Disabilities and Lost Workday Cases.
Measured per calendar year.
Measured per vessel for internal improvement as well as external communication (input to SPIs).
Relevant PIs:
•F: Fatalities due to injuries
•LWC: Lost workday cases
•PTD: Permanent total disabilities
•PPD: Permanent partial disabilities
•TEH: Total exposure hours
KPI Value Formula= F+LWC+PTD+PPD
-6
TEH * 10
KPI Rating Formula= 100-(Z*KPI Value)
Rating Parameters: Z= 25
This KPI represents a ratio between Lost Time Injuries (fatalities, lost workday cases and permanent total and partial
disabilities) against the total exposure hours. The measurement unit for the KPI value is incidents per million hour
exposure.
Copyright © InterManager, the International Ship Managers' Association 200[8]
InterManager, Page 46](https://image.slidesharecdn.com/intermanagerkpi-120217054340-phpapp01/85/Intermanager-kpi-72-320.jpg)
![KPI: Lost Time Injury Frequency
Calculation Example
Relevant PIs:
•F: Fatalities due to injuries 0
•LWC: Lost workday cases 1
•PTD: Permanent total disabilities 0
•PPD: Permanent partial disabilities 0
•TEH: Total exposure hours 438000 (crew of 10) in 5 years
KPI Value Formula= F+LWC+PTD+PPD 0 +1+ 0 + 0 1
= = = 2.28
TEH * 10
-6
438000 *10 −6 0,438
KPI Rating Formula= 100-(Z*KPI Value) = 100 – 25*2.28 = 43
Rating Parameters: Z= 25
The z-value of 25 indicates that 4 incidents per million exposure hour will give 0 KPI Rating
Copyright © InterManager, the International Ship Managers' Association 200[8]
InterManager, Page 47](https://image.slidesharecdn.com/intermanagerkpi-120217054340-phpapp01/85/Intermanager-kpi-73-320.jpg)
![KPI: Lost Time Sickness Frequency
The number of cases where a crew member is sick for more than 24 hours per unit exposure hours, including fatalities.
Exposure hours are 24 hours per day while serving onboard. Note that sickness during onboard spare-time is also
included.
Measured per calendar year
Relevant PIs:
•A: Number of cases where crew member is sick for more than 24 hours
•B: Fatalities due to sickness
•TEH: Total Exposure Hours
KPI Value Formula= A+B
-6
TEH * 10
KPI Rating Formula= 100-(Z*KPI Value)
Rating Parameters: Z= 10
This KPI represents a ratio between the total number of cases where a crew member is sick for more than 24 hours
as well as the total number of fatalities due to sickness per the total exposure hours (TEH is divided by 1000000). The unit
of measure for the KPI value is in incidents per million hour exposure.
Copyright © InterManager, the International Ship Managers' Association 200[8]
InterManager, Page 48](https://image.slidesharecdn.com/intermanagerkpi-120217054340-phpapp01/85/Intermanager-kpi-74-320.jpg)
![KPI: Lost Time Sickness Frequency
Calculation Example
Relevant PIs:
•A: Number of cases where crew member is sick for more than 24 hours 2
•B: Fatalities due to sickness 0
•TEH: Total Exposure Hours 438000 (crew of 10) in 5 years
KPI Value Formula= A+B 2+0 2
-6 = = = 4,57
TEH * 10 438000 *10 −6 0,438
KPI Rating Formula= 100-(Z*KPI Value) = 100 – 10* 4.57 = 54.3
Rating Parameters: Z= 10
The z-value of 10 indicates that 10 incidents per million exposure hour will give 0 KPI Rating
Copyright © InterManager, the International Ship Managers' Association 200[8]
InterManager, Page 49](https://image.slidesharecdn.com/intermanagerkpi-120217054340-phpapp01/85/Intermanager-kpi-75-320.jpg)
![KPI: Navigational deficiencies
Navigational related deficiencies, observations and non-conformances recorded during external inspections and audits in a
calendar year. Made relative to the total number of external inspections in a calendar year.
Measured per vessel for internal improvement as well as external communication (input to SPIs)
Relevant PIs:
•Total number of Navigational related deficiencies
•Total number of recorded external inspections
KPI Value Formula= Total number of Navigational related deficiencies
Total number of recorded external inspections
KPI Rating Formula= 100-(Z*KPI Value)
Rating Parameters: Z= 33,33
This KPI is part of a range of KPIs related to deficiencies that are identified during external inspections. These deficiencies
are categorized depending on their nature. An example of a navigational related deficiency is a mal-functioning radar.
The total number of recorded external inspection is used as a denominator in all these KPIs in order to enable
benchmarking between vessels that are subject to a uneven number of external inspection.
Copyright © InterManager, the International Ship Managers' Association 200[8]
InterManager, Page 50](https://image.slidesharecdn.com/intermanagerkpi-120217054340-phpapp01/85/Intermanager-kpi-76-320.jpg)
![KPI: Navigational incidents
Any navigational incident resulting in a collision, allision or grounding in a calendar year. All incidents are counted
regardless of the cause of the incident.
Measured per vessel for internal improvement as well as external communication (input to SPIs)
Relevant PIs:
•Collision
•Allision
•Grounding
KPI Value Formula= (A*Collision) + (B*Allision) + (C*Grounding)
Value Parameters: A= 2
B= 1
C= 2
KPI Rating Formula= 100-(Z*KPI Value)
Rating Parameters: Z= 50
This KPI measures the total number of collisions, allisions and groundings recorded in a calendar year.
The KPI's value is a simple counter where the parameters weight collision and grounding twice as influential to the KPI as
an allision
Copyright © InterManager, the International Ship Managers' Association 200[8]
InterManager, Page 51](https://image.slidesharecdn.com/intermanagerkpi-120217054340-phpapp01/85/Intermanager-kpi-77-320.jpg)
![KPI: Navigational incidents
Calculation Example
Relevant PIs:
•Collision 0
•Allision 1
•Grounding 0
KPI Value Formula= (A*Collision) + (B*Allision) + (C*Grounding) = 2*0+1*1+2*0=1
Value Parameters: A= 2
B= 1
C= 2
KPI Rating Formula= 100-(Z*KPI Value) = 100 – 50*1 = 50
Rating Parameters: Z= 50
Copyright © InterManager, the International Ship Managers' Association 200[8]
InterManager, Page 52](https://image.slidesharecdn.com/intermanagerkpi-120217054340-phpapp01/85/Intermanager-kpi-78-320.jpg)
![KPI: No of violations of MARPOL Annex 1-6
KPI covering substances overboard (outside operational emissions and oil-spills) in breach of regulation in a calendar year.
Measured per vessel for internal improvement as well as external communication (input to SPIs).
Relevant PIs:
•Number of violations of MARPOL Annex 1-6
KPI Value Formula= ∑ Violations of MARPOL Annex 1-6
KPI Rating Formula= 0 = 100 rating
1 = 50 rating
> 1 = 0 rating
This KPI counts the number of times where MARPOL Annex 1-6 has been violated
Copyright © InterManager, the International Ship Managers' Association 200[8]
InterManager, Page 53](https://image.slidesharecdn.com/intermanagerkpi-120217054340-phpapp01/85/Intermanager-kpi-79-320.jpg)
![KPI: NOx emissions
The estimated NOx efficiency in a calendar year. Measured per vessel for external communication (input to SPIs)
Relevant PIs:
•Emitted Mass NOx
•Transport Work
6
KPI Value Formula= Emitted Mass NOx*10
Transport Work
KPI Rating Formula= 100-(Z*KPI Value)
Rating Parameters: Z=250
This KPI compares emitted mass of NOx to the vessel’s total transport work, hereby stating the value achieved (transport
work) by the emission of NOx. Because the PI ’Emitted Mass NOx’ is measured in tons, the PI’s value is multiplied by 1
million in order to get the KPI value in g/ton mile (tonmile, passengermile, TEUmile, etc).
Copyright © InterManager, the International Ship Managers' Association 200[8]
InterManager, Page 54](https://image.slidesharecdn.com/intermanagerkpi-120217054340-phpapp01/85/Intermanager-kpi-80-320.jpg)
![KPI: NOx emissions
Calculation Example
Relevant PIs:
•Emitted Mass NOx 4000ton
•Transport Work 20.710.647.000 tonmile
KPI Value Formula= Emitted Mass NOx
Transport Work = 4500 *106
= 0,217 g / tonmile
20710647000
KPI Rating Formula= 100-(Z*KPI Value) = 100 – (250 *0,217) = 100 – 54,3 = 45,7
Rating Parameters: Z=250 Some typical emission factors
Ship Type Index unit CO2 NOx SOx
LNG Tanker g/ tonmile 66,5 1,9 1,2
Z value to be updated (agreed), and need to be differentiated Chemical Tanker g/ tonmile 23,5 0,7 0,4
between ship size and other factors Crude Oil Tanker g/ tonmile 8 0,2 0,1
Bulk Dry g/ tonmile 7,6 0,2 0,1
Container g/ tonmile 96,5 2,7 1,7
Refrigerated Cargo g/ tonmile 124,3 3,5 2,2
RO-RO Cargo g/ tonmile 94,9 1,8 1,7
Copyright © InterManager, the International Ship Managers' Association 200[8]
InterManager, Page 55](https://image.slidesharecdn.com/intermanagerkpi-120217054340-phpapp01/85/Intermanager-kpi-81-320.jpg)
![KPI: Operational deficiencies
Operational related deficiencies, observations and non-conformances, recorded during external inspections and audits in a
calendar year, not including HR, security, safety and environmental deficiencies. Made relative to the total number of
external inspections in a calendar year.
Measured per vessel for internal improvement as well as external communication (input to SPIs)
Relevant PIs:
•Total number of Operational related deficiencies
•Total number of recorded external inspections
KPI Value Formula= Total number of Operational related deficiencies
Total number of recorded external inspections
KPI Rating Formula= 100-(Z*KPI Value)
Rating Parameters: Z= 16,67
This KPI is part of a range of KPIs related to deficiencies that are identified during external inspections. These deficiencies
are categorized depending on their nature such as deficiencies related to security or environment. This specific KPI
(Operational deficiencies) is a KPI that will cover all deficiencies that are not easily related to one of the other more
specific KPIs within this range.
The total number of recorded external inspection is used as a denominator in all these KPIs in order to enable
benchmarking between vessels that are subject to a uneven number of external inspection.
Copyright © InterManager, the International Ship Managers' Association 200[8]
InterManager, Page 56](https://image.slidesharecdn.com/intermanagerkpi-120217054340-phpapp01/85/Intermanager-kpi-82-320.jpg)
![KPI: Port state control deficiency rate
The number of deficiencies reported during Port State Control Inspections in a calendar year. Made relative to the total
number of port state control inspections in a calendar year. Measured per vessel for internal improvement as well as
external communication (input to SPIs)
Relevant PIs:
•Total number of PSC deficiencies
•Total number of PSC inspections
KPI Value Formula= Total number of PSC deficiencies
Total number of PSC inspections
KPI Rating Formula= 100-(Z*KPI Value)
Rating Parameters: Z= 15,2
This KPI is one of three KPIs related to Port State Control Inspections. The three areas covered are; 'Flawless port state
control performance' which measures the percentage of port state controls resulting in zero deficiencies, 'Port state control
detention' which measures the total number of port state control inspections resulting in a detention and this specific KPI,
'Port state control deficiency rate‘, which measures the ratio of the total number of issued deficiencies during port state
control inspection relative to the total number of port state control inspections conducted
Copyright © InterManager, the International Ship Managers' Association 200[8]
InterManager, Page 57](https://image.slidesharecdn.com/intermanagerkpi-120217054340-phpapp01/85/Intermanager-kpi-83-320.jpg)
![KPI: Port state control deficiency rate
Calculation Example
Relevant PIs:
•Total number of PSC deficiencies 6
•Total number of PSC inspections 2
KPI Value Formula= Total number of PSC deficiencies 12
Total number of PSC inspections
= =3
4
KPI Rating Formula= 100-(Z*KPI Value) = 100 – (15,2*3) = 100 – 45,6 = 54,4
Rating Parameters: Z= 15,2
Copyright © InterManager, the International Ship Managers' Association 200[8]
InterManager, Page 58](https://image.slidesharecdn.com/intermanagerkpi-120217054340-phpapp01/85/Intermanager-kpi-84-320.jpg)
![KPI: Port state control detention
The number of Port State Control Inspections resulting in a detention in a calendar year.
Measured per vessel for internal improvement as well as external communication (input to SPIs)
Relevant PIs:
•Total number of PSC inspections resulting in a detention
KPI Value Formula= Total Number of PSC inspections resulting in a detention
KPI Rating Formula= 100 if KPI Value = 0
0 if KPI Value > 0
Rating Parameters: N/A
This KPI is one of three KPIs related to Port State Control Inspections. The three areas covered are; 'Flawless port state
control performance' which measures the percentage of port state controls resulting in zero deficiencies, 'Port state control
deficiency rate' which measures the ratio of the total number of issued deficiencies during port state control inspection
against the total number of port state control inspections conducted and this specific KPI, 'Port state control detention'
which measures the total number of port state control inspections resulting in a detention.
No denominator is used in this KPI
Copyright © InterManager, the International Ship Managers' Association 200[8]
InterManager, Page 59](https://image.slidesharecdn.com/intermanagerkpi-120217054340-phpapp01/85/Intermanager-kpi-85-320.jpg)
![KPI: Port state control detention
Calculation Example
Relevant PIs:
•Total number of PSC inspections resulting in a detention =1
KPI Value Formula= Total Number of PSC inspections resulting in a detention = 1
KPI Rating Formula= 0
100 if KPI Value = 0
0 if KPI Value > 0
Rating Parameters: N/A
This KPI is binary. If you have a detention on the vessel your Rating will be zero.
Copyright © InterManager, the International Ship Managers' Association 200[8]
InterManager, Page 60](https://image.slidesharecdn.com/intermanagerkpi-120217054340-phpapp01/85/Intermanager-kpi-86-320.jpg)
![KPI: Safety deficiencies
Safety related deficiencies, observations and non-conformances, recorded during external inspections and audits in a
calendar year. Made relative to the total number of external inspections in a calendar year.
Measured per vessel for internal improvement as well as external communication (input to SPIs)
Relevant PIs:
•Total number of Safety related deficiencies
•Total number of recorded external inspections
KPI Value Formula= Total number of Safety related deficiencies
Total number of recorded external inspections
KPI Rating Formula= 100-(Z*KPI Value)
Rating Parameters: Z= 33,33
This KPI is part of a range of KPIs related to deficiencies that are identified during external inspections. These deficiencies
are categorized depending on their nature. An example of a safety deficiency can be misplaced life buoys or fire hoses.
The total number of recorded external inspection is used as a denominator in all these KPIs in order to enable
benchmarking between vessels that are subject to a uneven number of external inspection.
Copyright © InterManager, the International Ship Managers' Association 200[8]
InterManager, Page 61](https://image.slidesharecdn.com/intermanagerkpi-120217054340-phpapp01/85/Intermanager-kpi-87-320.jpg)
![KPI: Security deficiencies
Security related deficiencies, observations and non-conformances, recorded during external inspections and audits in a
calendar year. Made relative to the total number of external inspections in a calendar year.
Measured per vessel for internal improvement as well as external communication (input to SPIs)
Relevant PIs:
•Total number of Security related deficiencies
•Total number of recorded external inspections
KPI Value Formula= Total number of Security related deficiencies
Total number of recorded external inspections
KPI Rating Formula= 100-(Z*KPI Value)
Rating Parameters: Z= 33,33
This KPI is part of a range of KPIs related to deficiencies that are identified during external inspections. These deficiencies
are categorized depending on their nature. An example of a security deficiency can be lack of compliance to the ISPS
code.
The total number of recorded external inspection is used as a denominator in all these KPIs in order to enable
benchmarking between vessels that are subject to a uneven number of external inspection.
Copyright © InterManager, the International Ship Managers' Association 200[8]
InterManager, Page 62](https://image.slidesharecdn.com/intermanagerkpi-120217054340-phpapp01/85/Intermanager-kpi-88-320.jpg)
![KPI: SOx emissions
The estimated SOx efficiency in a calendar year. Measured per vessel for external communication (input to SPIs)
Relevant PIs:
•Emitted Mass SOx
•Transport Work
6
KPI Value Formula= Emitted Mass SOx*10
Transport Work
KPI Rating Formula= 100-(Z*KPI Value)
Rating Parameters: Z=500
This KPI compares emitted mass of SOx to the vessel’s total transport work, hereby stating the value achieved (transport
work) by the emission of SOx. Because the PI ’Emitted Mass SOx’ is measured in tons, the PI’s value is multiplied by 1
million in order to get the KPI value in g/ton mile (tonmile, passengermile, TEUmile, etc).
Copyright © InterManager, the International Ship Managers' Association 200[8]
InterManager, Page 63](https://image.slidesharecdn.com/intermanagerkpi-120217054340-phpapp01/85/Intermanager-kpi-89-320.jpg)
![KPI: SOx emissions
Calculation Example
Relevant PIs:
•Emitted Mass SOx 2000ton
•Transport Work 20.710.647.000 tonmile
6
KPI Value Formula= Emitted Mass SOx = 2000 *10 = 0,097 g / tonmile
Transport Work 20710647000
KPI Rating Formula= 100-(Z*KPI Value) = 100 – (500 *0,097) = 100 – 48,5 = 51,5
Rating Parameters: Z= 500
Some typical emission factors
Ship Type Index unit CO2 NOx SOx
LNG Tanker g/ tonmile 66,5 1,9 1,2
Z value to be updated (agreed), and need to be differentiated Chemical Tanker g/ tonmile 23,5 0,7 0,4
between ship size and other factors Crude Oil Tanker g/ tonmile 8 0,2 0,1
Bulk Dry g/ tonmile 7,6 0,2 0,1
Container g/ tonmile 96,5 2,7 1,7
Refrigerated Cargo g/ tonmile 124,3 3,5 2,2
RO-RO Cargo g/ tonmile 94,9 1,8 1,7
Copyright © InterManager, the International Ship Managers' Association 200[8]
InterManager, Page 64](https://image.slidesharecdn.com/intermanagerkpi-120217054340-phpapp01/85/Intermanager-kpi-90-320.jpg)
![KPI: Vessel availability
A percentage of the total utilization related to the total availability (subtracting planned off-hire) of a vessel in a calendar
year. Measured per vessel for internal improvement as well as external communication (input to SPIs).
Relevant PIs:
•Actual off-hire
•Planned off-hire
KPI Value Formula= (1 −
Actual offhire - Planned offhire
) *100
(365 ∗ 24) - Planned offhire
KPI Rating Formula= (Z*KPI Value)-100
Rating Parameters: Z=2
This KPI calculates the vessel utilization as a percentage of the total utilization time available. By subtracting hours of
planned off-hire from 365x24 (which would be the ’optimal utilization’) the 100% availability is found.
Copyright © InterManager, the International Ship Managers' Association 200[8]
InterManager, Page 65](https://image.slidesharecdn.com/intermanagerkpi-120217054340-phpapp01/85/Intermanager-kpi-91-320.jpg)
![KPI: Vessel availability
Calculation Example
Relevant PIs:
•Actual off-hire 23h
•Planned off-hire 18h
23 − 18
KPI Value Formula= (1 −
Actual offhire - Planned offhire
) *100 = (1 −
(365 * 24) − 18
) *100 = 99,94
(365 ∗ 24) - Planned offhire
KPI Rating Formula= Z*KPI Value – 100 = 2 * 99,94 - 100 = 99,88
Rating Parameters: Z=2
Copyright © InterManager, the International Ship Managers' Association 200[8]
InterManager, Page 66](https://image.slidesharecdn.com/intermanagerkpi-120217054340-phpapp01/85/Intermanager-kpi-92-320.jpg)
![The Shipping KPI Standard - PIs
• AAE (Additional Authorized Expense) • Lost Workday Cases • Total number of damaged or lost cargo
• AAE (Additional Authorized Expense) • Lost Workday Cases • Total number of damaged or lost cargo
• Absconded crew • No of crew not relieved on time units/passengers injured during cargo handling
• Absconded crew • No of crew not relieved on time units/passengers injured during cargo handling
• Actual drydocking costs • No of dismissed crew • Total number of damaged or lost cargo
• Actual drydocking costs • No of dismissed crew • Total number of damaged or lost cargo
• Actual drydocking duration • No of logged warnings units/passengers injured during voyage
• Actual drydocking duration • No of logged warnings units/passengers injured during voyage
• Actual off-hire • No of violations of MARPOL Annex 1-6 • Total number of Environmental related
• Actual off-hire • No of violations of MARPOL Annex 1-6 • Total number of Environmental related
deficiencies
• Actual running Costs and Accruals • Number of cases where a crew member is sick deficiencies
• Actual running Costs and Accruals • Number of cases where a crew member is sick • Total number of explosion incidents
• Agreed drydocking costs for more than 24 hours • Total number of explosion incidents
• Agreed drydocking costs for more than 24 hours • Total number of fire incidents
• Agreed drydocking duration • Number of new cadets • Total number of fire incidents
• Agreed drydocking duration • Number of new cadets • Total number of HR related deficiencies
• Allision • Officer working days • Total number of HR related deficiencies
• Allision • Officer working days • Total number of navigation related deficiencies
• Average number of vessels under management • Officers retention rate • Total number of navigation related deficiencies
• Average number of vessels under management • Officers retention rate • Total number of operational related deficiencies
• Ballast water discharge violations • Permanent Total Disabilities • Total number of operational related deficiencies
• Ballast water discharge violations • Permanent Total Disabilities • Total number of PSC inspections
• Collision • Permanent Partial Disabilities • Total number of PSC inspections
• Collision • Permanent Partial Disabilities • Total number of PSC deficiencies
• Condition of class • Planned off-hire • Total number of PSC deficiencies
• Condition of class • Planned off-hire • Total number of PSC inspections resulting in a
• Criminal offence • PSC inspections resulting in zero deficiencies • Total number of PSC inspections resulting in a
• Criminal offence • PSC inspections resulting in zero deficiencies detention
• Drug/alcohol abused • Severe spills of bulk liquid detention
• Drug/alcohol abused • Severe spills of bulk liquid • Total number of recorded external inspections
• Emitted Mass CO2 • Total Exposure Hours • Total number of recorded external inspections
• Emitted Mass CO2 • Total Exposure Hours • Total number of safety related deficiencies
• Emitted Mass NOx • Total no of contained spills of bulk liquid • Total number of safety related deficiencies
• Emitted Mass NOx • Total no of contained spills of bulk liquid • Total number of security related deficiencies
• Emitted Mass SOx • Total number of accidental releases of • Total number of security related deficiencies
• Emitted Mass SOx • Total number of accidental releases of • Training days
• Failure of critical equipment and systems substances covered by MARPOL, to the • Training days
• Failure of critical equipment and systems substances covered by MARPOL, to the • Transport Work
environment • Transport Work
• Fatalities due to injuries environment
• Fatalities due to injuries • Total number of cargo units/passengers • Vessel running cost budget
• Fatalities due to sickness • Total number of cargo units/passengers • Vessel running cost budget
• Fatalities due to sickness transported • Violation of rest hours
• Grounding transported • Violation of rest hours
• Grounding
Copyright © InterManager, the International Ship Managers' Association 200[8]
InterManager, Page 68](https://image.slidesharecdn.com/intermanagerkpi-120217054340-phpapp01/85/Intermanager-kpi-94-320.jpg)
![PI: AAE (Additional Authorized Expense)
The amount asked by the ship manager from the ship-owner (or charterer) for additional expenses related to agreed
exceptional items during a fiscal year
Used in KPI(s):
•Budget control pr vessel
PI Value:
Total AAE per vessel
AAE should be given in USD
Data Capture:
This PI is used in the calculation of deviation from the vessel's running cost budget as AAE should be withdrawn when
calculating a vessel's actual running costs and accruals as the AAE are in fact approved by the ship owner hence it can be
argued that they are in fact part of the vessel's running cost budget
Copyright © InterManager, the International Ship Managers' Association 200[8]
InterManager, Page 69](https://image.slidesharecdn.com/intermanagerkpi-120217054340-phpapp01/85/Intermanager-kpi-95-320.jpg)
![PI: Absconded crew
Number of crew absent without leave (AWOL) in a calendar year
Used in KPI(s):
•Crew behaviour
PI Value:
∑Crew AWOL
Data Capture:
Data concerning this PI is taken from internal reporting and is subject to manipulation and subjective interpretations
This PI is part of 5 PIs related to crew misbehaviour.
All incidents (all PIs) together are used in calculation of the KPI 'Crew behaviour' with the average number of crew
onboard vessel used as a denominator
Copyright © InterManager, the International Ship Managers' Association 200[8]
InterManager, Page 70](https://image.slidesharecdn.com/intermanagerkpi-120217054340-phpapp01/85/Intermanager-kpi-96-320.jpg)
![PI: Actual drydocking costs
The actual costs of the yard stay for drydocking. Summarized per 5 year rolling time period
Used in KPI(s):
•Drydocking planning performance
PI Value:
Actual costs
Costs should be given in USD
Data Capture:
This PI is used to be able to measure the deviation from a vessel's drydocking schedule (related to costs) by comparing
the value to the Agreed drydocking costs. Together with the PIs 'Actual drydocking duration and 'Agreed drydocking
duration' a KPI called 'Drydocking planning performance' is created
Copyright © InterManager, the International Ship Managers' Association 200[8]
InterManager, Page 71](https://image.slidesharecdn.com/intermanagerkpi-120217054340-phpapp01/85/Intermanager-kpi-97-320.jpg)
![PI: Actual drydocking duration
The actual duration of the yard stay for drydocking. Summarized per 5 year rolling time period
Used in KPI(s):
•Drydocking planning performance
PI Value:
Actual duration
Duration should be given in Days
Data Capture:
This PI is used to be able to measure the deviation from a vessel's drydocking schedule (related to duration) by comparing
the value to the Agreed drydocking duration. Together with the PIs 'Actual drydocking costs' and 'Agreed drydocking costs'
a KPI called 'Drydocking planning performance' is created
Copyright © InterManager, the International Ship Managers' Association 200[8]
InterManager, Page 72](https://image.slidesharecdn.com/intermanagerkpi-120217054340-phpapp01/85/Intermanager-kpi-98-320.jpg)
![PI: Actual off-hire
The actual number of hours lost in a calendar year due to (full details described in prevailing Charter Party); Interruption
of service level caused by; deficiency of personnel or stores, repairs, breakdowns and overhaul, neglect of duty of crew,
medical advice or treatment of crew, detention of vessel or quarantine, planned off-hire, reduction of vessel performance
regarding speed or cargo handling
Used in KPI(s):
•Vessel availability
PI Value:
∑Number of hours claimed by the Charterer through the principals
Data Capture:
This PI together with the PI 'Planned off-hire' provides a percentage of the vessel's actual availability in light of (365x24)
minus the planned off-hire=100%
Copyright © InterManager, the International Ship Managers' Association 200[8]
InterManager, Page 73](https://image.slidesharecdn.com/intermanagerkpi-120217054340-phpapp01/85/Intermanager-kpi-99-320.jpg)
![PI: Actual running costs and accruals
Total annual (fiscal year) cost per vessel including M&R, purchasing, operation, crewing, insurance and other vessel
operating costs. Capital expenses such as upgrades, drydockings and modifications are not taken into account.
Used in KPI(s):
•Budget control pr vessel
PI Value:
Total annual cost per vessel
Costs should be given in USD
Data Capture:
This PI is used to be able to measure the deviation from a vessel's running costs budget represented in percentage by
comparing it to the PI 'Vessel running costs budget'
Copyright © InterManager, the International Ship Managers' Association 200[8]
InterManager, Page 74](https://image.slidesharecdn.com/intermanagerkpi-120217054340-phpapp01/85/Intermanager-kpi-100-320.jpg)
![PI: Agreed drydocking costs
The agreed costs of the yard stay for drydocking. Summarized per 5 year rolling time period
Used in KPI(s):
•Drydocking planning performance
PI Value:
Agreed costs
Costs should be given in USD
Data Capture:
This PI is used to be able to measure the deviation from a vessel's drydocking schedule (related to costs) by comparing
the value to the Actual drydocking costs. Together with the PIs 'Actual drydocking duration and 'Agreed drydocking
duration' a KPI called 'Drydocking planning performance' is created
Copyright © InterManager, the International Ship Managers' Association 200[8]
InterManager, Page 75](https://image.slidesharecdn.com/intermanagerkpi-120217054340-phpapp01/85/Intermanager-kpi-101-320.jpg)
![PI: Agreed drydocking duration
The agreed duration of the yard stay for drydocking. Summarized per 5 year rolling time period
Used in KPI(s):
•Drydocking planning performance
PI Value:
Agreed duration
Duration should be given in Days
Data Capture:
This PI is used to be able to measure the deviation from a vessel's drydocking schedule (related to duration) by comparing
the value to the Actual drydocking duration. Together with the PIs 'Actual drydocking costs' and 'Agreed drydocking costs'
a KPI called 'Drydocking planning performance' is created
Copyright © InterManager, the International Ship Managers' Association 200[8]
InterManager, Page 76](https://image.slidesharecdn.com/intermanagerkpi-120217054340-phpapp01/85/Intermanager-kpi-102-320.jpg)
![PI: Allision
The act of unintentional striking a fixed objects. Summarized pr calendar year
Used in KPI(s):
•Navigational incidents
PI Value:
∑ Allisions
Data Capture:
This PI is one of three PIs used in the KPI 'Navigational incidents'. The two other PIs are Collision' and 'Grounding'. The
categorization of navigational incidents is used to be able to identify the different potential results of a navigational
incident
Copyright © InterManager, the International Ship Managers' Association 200[8]
InterManager, Page 77](https://image.slidesharecdn.com/intermanagerkpi-120217054340-phpapp01/85/Intermanager-kpi-103-320.jpg)
![PI: Average number of vessels under management
The average number of vessels under management in a calendar year
Used in KPI(s):
•Crew management
PI Value:
∑Average number of vessels under management
Data Capture:
All vessels within the fleet should be given the same value on this PI
This PI is one of 5 PIs related to the KPI 'Crew management' which reflects the ship manager's willingness and ability to
acquire and maintain the required competence/crew for their operations. This specific PI gives the average number of
vessels under management (in a calendar year) which is used as a (sub) denominator in the KPI
Copyright © InterManager, the International Ship Managers' Association 200[8]
InterManager, Page 78](https://image.slidesharecdn.com/intermanagerkpi-120217054340-phpapp01/85/Intermanager-kpi-104-320.jpg)
![PI: Ballast water discharge violations
Any discharge or exchange of ballast water (or lack of doing so) in a calendar year, not in compliance with applicable rules
and regulations
Used in KPI(s):
•Ballast water discharge violations
PI Value:
∑Violations
Data Capture:
This PI counts the total number of violations of applicable rules and regulations related to ballast water management.
The PI is the only PI in the KPI 'Ballast water discharge violations' as the potential denominator related to the total number
of ballast water operations is considered as non relevant
Copyright © InterManager, the International Ship Managers' Association 200[8]
InterManager, Page 79](https://image.slidesharecdn.com/intermanagerkpi-120217054340-phpapp01/85/Intermanager-kpi-105-320.jpg)
![PI: Collision
The total number of recorded collision incidents between two or more floating objects. Summarized pr calendar year
Used in KPI(s):
•Navigational incidents
PI Value:
∑ Collisions
Data Capture:
This PI is one of three PIs used in the KPI 'Navigational incidents'. The two other PIs are 'Allision' and 'Grounding'. The
categorization of navigational incidents is used to be able to identify the different potential results of a navigational
incident
Copyright © InterManager, the International Ship Managers' Association 200[8]
InterManager, Page 80](https://image.slidesharecdn.com/intermanagerkpi-120217054340-phpapp01/85/Intermanager-kpi-106-320.jpg)
![PI: Condition of class
Existing CoC at time of measurement. Condition of class is a written statement from class (ref. IACS)
Used in KPI(s):
•Condition of Class
PI Value:
∑ Condition of class
Data Capture:
Data concerning this PI can be taken from class inspection reports
This PI counts the total number of Conditions of class that are stated for the vessel in a calendar year. The PI is the only
PI in the KPI 'Condition of class' as there is no need for a common denominator (such as the total number of class
inspections) in the KPI for benchmarking purposes
Copyright © InterManager, the International Ship Managers' Association 200[8]
InterManager, Page 81](https://image.slidesharecdn.com/intermanagerkpi-120217054340-phpapp01/85/Intermanager-kpi-107-320.jpg)
![PI: Criminal offence
Crew (Officers and Ratings) charged with criminal offence in a calendar year
Used in KPI(s):
•Crew behaviour
PI Value:
∑Crew charged
Data Capture:
Data concerning this PI is taken from internal reporting and is subject to manipulation and subjective interpretations
This PI is part of 5 PIs related to crew misbehaviour.
All incidents (all PIs) together are used in calculation of the KPI 'Crew behaviour' with the average number of crew
onboard vessel used as a denominator
Copyright © InterManager, the International Ship Managers' Association 200[8]
InterManager, Page 82](https://image.slidesharecdn.com/intermanagerkpi-120217054340-phpapp01/85/Intermanager-kpi-108-320.jpg)
![PI: Drug/alcohol abused
Cases where crew (Officers and Ratings) are caught abusing drugs or alcohol in a calendar year
Used in KPI(s):
•Crew behaviour
PI Value:
∑Crew caught abusing
Data Capture:
Data concerning this PI is taken from internal reporting and is subject to manipulation and subjective interpretations
This PI is part of 5 PIs related to crew misbehaviour.
All incidents (all PIs) together are used in calculation of the KPI 'Crew behaviour' with the average number of crew
onboard vessel used as a denominator
Copyright © InterManager, the International Ship Managers' Association 200[8]
InterManager, Page 83](https://image.slidesharecdn.com/intermanagerkpi-120217054340-phpapp01/85/Intermanager-kpi-109-320.jpg)
![PI: Emitted mass CO2
The total qty of emitted tons of CO2 in laden and ballast condition in a calendar year
Used in KPI(s):
•CO2 emissions
PI Value:
Fuel Used * Fuel Quality Factor
Fuel Used to be given in ton
Fuel Quality Factor:
3.09 for Distillate fuels
3.02 for Residual Fuels
Data Capture:
Calculation is based on the fuel consumption and fuel quality, so to be accurate the emitted mass should be calculated for
each bunkering (or at least each change in fuel quality) and than aggregated for a year per vessel.
This PI is used in calculation of energy efficiency in the KPI ‘CO2 emissions’ by dividing the value on the PI ‘Transport
work’
Copyright © InterManager, the International Ship Managers' Association 200[8]
InterManager, Page 84](https://image.slidesharecdn.com/intermanagerkpi-120217054340-phpapp01/85/Intermanager-kpi-110-320.jpg)
![PI: Emitted mass NOx
The total qty of emitted kilos of NOx in laden and ballast condition in a calendar year
Used in KPI(s):
•NOx emissions
PI Value:
Fuel Used x Engine Speed Factor
Fuel Used to be given in ton
Engine Speed Factor:
93 for RPM < 200
60 for RPM 200-1000
50 for RPM > 1000
Data Capture:
This PI apply a rule of thumb to be generally applicable. A more accurate method exists for newer vessels which have
emission certificates, those who have this should use the more accurate method to calculate the emitted mass NOx.
This PI is used in calculation of value achieved by emitting NOx in the KPI ‘NOx emissions’ by dividing the value on the PI
‘Transport work’
Copyright © InterManager, the International Ship Managers' Association 200[8]
InterManager, Page 85](https://image.slidesharecdn.com/intermanagerkpi-120217054340-phpapp01/85/Intermanager-kpi-111-320.jpg)
![PI: Emitted mass SOx
The total qty of emitted kilos of SOx in laden and ballast condition in a calendar year
Used in KPI(s):
•SOx emissions
PI Value:
Fuel Used x Sulphur Content Factor
Fuel Used to be given in ton
Sulphur Content Factor = Sulphur Content in % x 20
Data Capture:
Calculation is based on the fuel consumption and fuel quality, so to be accurate the emitted mass should be calculated for
each bunkering (or at least each change in sulphur content) and than aggregated for a year per vessel. Sulphur content
should be taken from fuel quality reports.
This PI is used in calculation of value achieved by emitting SOx in the KPI ‘SOx emissions’ by dividing the value on the PI
‘Transport work’
Copyright © InterManager, the International Ship Managers' Association 200[8]
InterManager, Page 86](https://image.slidesharecdn.com/intermanagerkpi-120217054340-phpapp01/85/Intermanager-kpi-112-320.jpg)
![PI: Failure of critical equipment and systems
The total number of failures to equipment and systems in the critical list (as required by the ISM code 10.3 and defined in
the company SMS) resulting in whole or partial unavailability in a calendar year
Used in KPI(s):
•Failure to critical equipment and systems
PI Value:
∑ Failures to critical equipment and systems
Data Capture:
This PI is the only PI for the KPI ’Failure of critical equipment and systems’. As the vessels’ critical lists may vary in size it
could be argued that e.g. the number of items on the list could be used as a denominator for benchmarking purposes. In
any case, a failure to a critical equipment or system is a serious matter, regardless of the number of items in the vessel’s
critical list, and the KPI ’Failure to critical equipment and systems is kept without a denominator.
Copyright © InterManager, the International Ship Managers' Association 200[8]
InterManager, Page 87](https://image.slidesharecdn.com/intermanagerkpi-120217054340-phpapp01/85/Intermanager-kpi-113-320.jpg)
![PI: Fatalities due to injuries
Crew fatalities due to work-related injuries occurring (extension of OCIMF) in a calendar year
Used in KPI(s):
•Lost Time Injury Frequency
PI Value:
∑Fatalities
Data Capture:
This PI is part of 5 PIs that together form the KPI 'Lost Time Injury Frequency' by counting all lost workday cases,
fatalities due to injuries, permanent total disabilities and permanent partial disabilities and use the total exposure hours as
a denominator to get the frequency
Copyright © InterManager, the International Ship Managers' Association 200[8]
InterManager, Page 88](https://image.slidesharecdn.com/intermanagerkpi-120217054340-phpapp01/85/Intermanager-kpi-114-320.jpg)
![PI: Fatalities due to sickness
The number of crew fatalities other than injury related cases. Including suicide
Used in KPI(s):
•Lost Time Sickness Frequency
PI Value:
∑Cases
Data Capture:
This PI is part of 3 PIs that together form the KPI 'Lost Time Sickness Frequency' by counting cases of sickness over 24
hours as well as fatalities due to sickness and use the total exposure hours as a denominator to get the frequency
Copyright © InterManager, the International Ship Managers' Association 200[8]
InterManager, Page 89](https://image.slidesharecdn.com/intermanagerkpi-120217054340-phpapp01/85/Intermanager-kpi-115-320.jpg)
![PI: Grounding
Unintentional contact by a vessel with the sea bed. Summarized pr calendar year
Used in KPI(s):
•Navigational incidents
PI Value:
∑ Groundings
Data Capture:
This PI is one of three PIs used in the KPI 'Navigational incidents'. The two other PIs are ‘Collision' and ‘Allision'. The
categorization of navigational incidents is used to be able to identify the different potential results of a navigational
incident
Copyright © InterManager, the International Ship Managers' Association 200[8]
InterManager, Page 90](https://image.slidesharecdn.com/intermanagerkpi-120217054340-phpapp01/85/Intermanager-kpi-116-320.jpg)
![PI: Lost Workday Cases (LWC)
LWC is an injury resulting in an individual being unable to carry out any of his duties or to return to work on the next
scheduled work shift on the day following the injury, unless caused by delays in getting medical treatment ashore
(OCIMF).
Summarized per calendar year.
Used in KPI(s):
•Lost Time Injury Frequency
PI Value:
∑LostWorkdayCases
Data Capture:
This PI is part of 5 PIs that together form the KPI 'Lost Time Injury Frequency' by counting all lost workday cases,
fatalities due to injuries, permanent total disabilities and permanent partial disabilities and use the total exposure hours as
a denominator to get the frequency
Copyright © InterManager, the International Ship Managers' Association 200[8]
InterManager, Page 91](https://image.slidesharecdn.com/intermanagerkpi-120217054340-phpapp01/85/Intermanager-kpi-117-320.jpg)
![PI: No of crew not relieved on time
Number of crew not relieved within the agreed tenure of contract, excluding extensions initiated by crew measured over a
calendar year
Used in KPI(s):
•Crew planning
PI Value:
∑Crew not relieved within the agreed tenure of contract measured over a cal. year
Data Capture:
This PI is used in the KPI 'Crew planning which reflects the ship manager's ability to adhere to agreed tenure of contracts
as well as official requirements related to rest hours
Copyright © InterManager, the International Ship Managers' Association 200[8]
InterManager, Page 92](https://image.slidesharecdn.com/intermanagerkpi-120217054340-phpapp01/85/Intermanager-kpi-118-320.jpg)
![PI: No of dismissed crew
Cases where crew has been dismissed due to breach of discipline before end of contract, in a calendar year
Used in KPI(s):
•Crew behaviour
PI Value:
∑Crew dismissed
Data Capture:
Data concerning this PI is taken from internal reporting and is subject to manipulation and subjective interpretations
This PI is part of 5 PIs related to crew misbehaviour.
All incidents (all PIs) together are used in calculation of the KPI 'Crew behaviour' with the average number of crew
onboard vessel used as a denominator
Copyright © InterManager, the International Ship Managers' Association 200[8]
InterManager, Page 93](https://image.slidesharecdn.com/intermanagerkpi-120217054340-phpapp01/85/Intermanager-kpi-119-320.jpg)
![PI: No of logged warnings
Any logged warning given by superior to a member of the crew in a calendar year
Used in KPI(s):
•Crew behaviour
PI Value:
∑Logged warnings
Data Capture:
Data concerning this PI is taken from internal reporting and is subject to manipulation and subjective interpretations
This PI is part of 5 PIs related to crew misbehaviour.
All incidents (all PIs) together are used in calculation of the KPI 'Crew behaviour' with the average number of crew
onboard vessel used as a denominator
Copyright © InterManager, the International Ship Managers' Association 200[8]
InterManager, Page 94](https://image.slidesharecdn.com/intermanagerkpi-120217054340-phpapp01/85/Intermanager-kpi-120-320.jpg)
![PI: No of violations of MARPOL Annex 1-6
No of violations of MARPOL Annex 1-6
Used in KPI(s):
•No of violations of MARPOL Annex 1-6
PI Value:
∑Violations
Data Capture:
This PI counts the number of times where MARPOL Annex 1-6 has been violated and feeds data into the KPI with the same
name
Copyright © InterManager, the International Ship Managers' Association 200[8]
InterManager, Page 95](https://image.slidesharecdn.com/intermanagerkpi-120217054340-phpapp01/85/Intermanager-kpi-121-320.jpg)
![PI: Number of cases where a crew member is sick for more than 24 hours
The number of cases where crew members are sick for more than 24 hours,
only counted when the crew member has been onboard the vessel for a minimum of four days.
Summarized per calendar year
Used in KPI(s):
•Lost Time Sickness Frequency
PI Value:
∑Cases
Data Capture:
This PI is part of 3 PIs that together form the KPI 'Lost Time Sickness Frequency' by counting cases of sickness over 24
hours as well as fatalities due to sickness and use the total exposure hours as a denominator to get the frequency
Copyright © InterManager, the International Ship Managers' Association 200[8]
InterManager, Page 96](https://image.slidesharecdn.com/intermanagerkpi-120217054340-phpapp01/85/Intermanager-kpi-122-320.jpg)
![PI: Number of new cadets
The total no of cadets recruited in a calendar year for the overall organisation
Used in KPI(s):
•Crew management
PI Value:
∑New Cadets
Data Capture:
As the number of new cadets is calculated on a fleet level, all vessels within the fleet should be given the same value on
this PI
This PI is one of 5 PIs related to the KPI 'Crew management' which reflects the ship manager's willingness and ability to
acquire and maintain the required competence/crew for their operations. This specific PI reflects the total number of new
cadets assigned to the fleet
Copyright © InterManager, the International Ship Managers' Association 200[8]
InterManager, Page 97](https://image.slidesharecdn.com/intermanagerkpi-120217054340-phpapp01/85/Intermanager-kpi-123-320.jpg)
![PI: Officer working days
Total number of officer working days in a calendar year (fleet average)
Used in KPI(s):
•Crew management
PI Value:
∑Officer working days
Data Capture:
As Officer working days is calculated on a fleet level, all vessels within the fleet should be given the same value on this PI
This PI is one of 5 PIs related to the KPI 'Crew management' which reflects the ship manager's willingness and ability to
acquire and maintain the required competence/crew for their operations. This specific PI reflects the total number of
officer working days which is used as a (sub) denominator in the KPI
Copyright © InterManager, the International Ship Managers' Association 200[8]
InterManager, Page 98](https://image.slidesharecdn.com/intermanagerkpi-120217054340-phpapp01/85/Intermanager-kpi-124-320.jpg)
![PI: Officers retention rate
Percentage of officers staying with the organisation after a period, normally a year. Adjusted for unavoidable terminations.
The formula is defined by INTERTANKO Officer Retention Formula. (Corrected) Version 2 Dated 12th March 2008
Source: The above formula is modelled upon the Abelson adjusted turnover rate “Abelson M (1996) Turnover cultures and
turnover audits” in Human Resources Management. But is adjusted by INTERTANKO to create a retention rate formula, as
opposed to a turn over rate formula.
Used in KPI(s):
•Crew management
PI Value: S − (UT + BT )
RetentionRate(RR) = 100 − ∗100
AE
S = Total Number of terminations from what ever cause (In effect this means the total number employees that have left the company for what
ever reason)
UT = Unavoidable Terminations (i.e. retirements or long term illness)
BT = Beneficial Terminations (i.e. sometimes those staff that do leave provide benefit to the company by virtue of leaving, for example under
performers
AE = The average number of employees working for the company during the same period as calculated, this should be any period of 12 months.
Data Capture:
The officers retention rate is calculated on a fleet level, all vessels within the fleet should be given the same value on this
PI. Data is captured by analysing your employment database a years back and identifying how many of those in the data
base have left and for what reason. The average number of employed officers in the period take into account any
reduction in the officer-need (reduction in fleet size).
This PI is one of 5 PIs related to the KPI 'Crew management' which reflects the ship manager's willingness and ability to
acquire and maintain the required competence/crew for their operations. This specific PI reflects the ship manager's ability
to retain their officers (hence competence and experience).
Copyright © InterManager, the International Ship Managers' Association 200[8]
InterManager, Page 99](https://image.slidesharecdn.com/intermanagerkpi-120217054340-phpapp01/85/Intermanager-kpi-125-320.jpg)
![PI: Officers retention rate
Calculation Example
Percentage of officers staying with the organisation after a period, normally a year. Adjusted for unavoidable terminations.
Used in KPI(s):
•Crew management
Parameters:
S: Number of officers left in the period 96
UT: Unavoidable Terminations 10
BT: Beneficial Termination 2
AE: Total number of officers in the period 250
S − (UT + BT ) 96 − (10 + 2)
RetentionRate(RR ) = 100 − ∗ 100 = 100 − ∗100 = 100 - 33,6 = 66,4%
AE 250
Copyright © InterManager, the International Ship Managers' Association 200[8]
InterManager, Page 100](https://image.slidesharecdn.com/intermanagerkpi-120217054340-phpapp01/85/Intermanager-kpi-126-320.jpg)
![PI: Permanent Total Disabilities (PTD)
PTD is any work injury which incapacitates an employee permanently and results in termination of employment on medical
grounds (e.g. loss of limb(s) permanent brain damage, loss of sight) and precludes the individual from working either at
sea or ashore (OCIMF). Summarized per calendar year
Used in KPI(s):
•Lost Time Injury Frequency
PI Value:
∑PermanentTotalDisabilities
Data Capture:
This PI is part of 5 PIs that together form the KPI 'Lost Time Injury Frequency' by counting all lost workday cases,
fatalities due to injuries, permanent total disabilities and permanent partial disabilities and use the total exposure hours as
a denominator to get the frequency
Copyright © InterManager, the International Ship Managers' Association 200[8]
InterManager, Page 101](https://image.slidesharecdn.com/intermanagerkpi-120217054340-phpapp01/85/Intermanager-kpi-127-320.jpg)
![PI: Permanent Partial Disabilities (PPD)
PPD is any work injury which results in the complete loss, or permanent loss of use, of any member or part of the body, or
any impairment of functions of parts of the body, regardless of any pre-existing disability of the injured member or
impaired body function, that partially restricts or limits an employees basis to work on a permanent basis at sea. Such an
individual could be employed ashore but not at sea in line with industry guidelines (OCIMF).
Summarized per calendar year
Used in KPI(s):
•Lost Time Injury Frequency
PI Value:
∑PermanentPartialDisabilities
Data Capture:
This PI is part of 5 PIs that together form the KPI 'Lost Time Injury Frequency' by counting all lost workday cases,
fatalities due to injuries, permanent total disabilities and permanent partial disabilities and use the total exposure hours as
a denominator to get the frequency
Copyright © InterManager, the International Ship Managers' Association 200[8]
InterManager, Page 102](https://image.slidesharecdn.com/intermanagerkpi-120217054340-phpapp01/85/Intermanager-kpi-128-320.jpg)
![PI: Planned off-hire
The number of hours planned for repair and maintenance during a specific calendar year, including Class renewal surveys,
Intermediate surveys, Dry-dockings, and Modification jobs that are agreed with the charterer/vessel operator
Used in KPI(s):
•Vessel availability
PI Value:
∑ Hours planned off-hire
Data Capture:
To be able to measure a vessel's availability it is natural to subtract the planned off-hire from a total potential availability
(typically 365x24) as it is the unplanned unavailability that should be given focus
Copyright © InterManager, the International Ship Managers' Association 200[8]
InterManager, Page 103](https://image.slidesharecdn.com/intermanagerkpi-120217054340-phpapp01/85/Intermanager-kpi-129-320.jpg)
![PI: PSC inspections resulting in zero deficiencies
The total number of port state control inspections resulting in zero deficiencies (not counting observations - code99) in a
calendar year
Used in KPI(s):
•Flawless port state control performance
PI Value:
∑Port state control inspections resulting in zero deficiencies in a calendar year
Data Capture:
Data concerning this PI is captured by counting the number of Port state control inspections where no deficiencies are
reported.
This PI is used in the KPI, 'Flawless port state control performance' which measures the percentage of port state controls
resulting in zero deficiencies against the total number of port state control inspections conducted
Copyright © InterManager, the International Ship Managers' Association 200[8]
InterManager, Page 104](https://image.slidesharecdn.com/intermanagerkpi-120217054340-phpapp01/85/Intermanager-kpi-130-320.jpg)
![PI: Severe spills of bulk liquid
A severe spill is a spill above one barrel. Summarized per calendar year
Used in KPI(s):
•Accidental releases of substances as def by MARPOL
PI Value:
∑Cases
Data Capture:
This PI together with the PI ’Total no of accidental releases of substances covered by MARPOL, to the environment’ makes
the KPI ‘Accidental releases of substances as def by MARPOL’ by counting the total number of spills, liquid (this PI) or
solids (covered by the PI 'Total no of accidental releases of substances covered by MARPOL, to the environment')
Copyright © InterManager, the International Ship Managers' Association 200[8]
InterManager, Page 105](https://image.slidesharecdn.com/intermanagerkpi-120217054340-phpapp01/85/Intermanager-kpi-131-320.jpg)
![PI: Total Exposure Hours (TEH)
TEH is the total number of hours the crew stays on a given vessel in a given year. The number is an aggregate of all crew-
members on a given vessel in a given year. (OCIMF)
Used in KPI(s):
•Lost Time Sickness Frequency
•Lost Time Injury Frequency
•Crew behaviour
PI Value:
∑Crew days X 24
Data Capture:
Aggregate the number of crew days to be able to capture varying crew sizes over the year.
This PI is used as a denominator in several KPIs on basis of enabling benchmarking of vessels which vary regarding the
number of crew onboard
Copyright © InterManager, the International Ship Managers' Association 200[8]
InterManager, Page 106](https://image.slidesharecdn.com/intermanagerkpi-120217054340-phpapp01/85/Intermanager-kpi-132-320.jpg)
![PI: Total no of contained spills of bulk liquid
Total no of contained spills (nothing going overboard) in a calendar year
Used in KPI(s):
•Contained spills
PI Value:
∑Cases
Data Capture:
Some spills are contained but still represent an incident that should be recorded. This PI counts the total number of
contained spills and feeds into the KPI ’Contained spills’ as the only PI
Copyright © InterManager, the International Ship Managers' Association 200[8]
InterManager, Page 107](https://image.slidesharecdn.com/intermanagerkpi-120217054340-phpapp01/85/Intermanager-kpi-133-320.jpg)
![PI: Total number of accidental releases of substances
covered by MARPOL, to the environment
Total number of accidental releases of substances covered by MARPOL, to the environment
Used in KPI(s):
•Accidental releases of substances as def by MARPOL
PI Value:
∑Cases
Data Capture:
This PI together with the PI ’Severe spills of bulk liquid’ makes the KPI ’Accidental releases of substances as def by
MARPOL’ by counting the total number of spills, liquid (covered by the PI ’Severe spills of bulk liquid’) or solids (this PI)
Copyright © InterManager, the International Ship Managers' Association 200[8]
InterManager, Page 108](https://image.slidesharecdn.com/intermanagerkpi-120217054340-phpapp01/85/Intermanager-kpi-134-320.jpg)
![PI: Total number of cargo units/passengers transported
The total number of cargo units/passengers transported in a calendar year
Used in KPI(s):
•Cargo incidents during cargo operations
•Cargo incidents during voyage
PI Value:
∑ Number of cargo units/passenger transported
For Container Carriers use number of units
For Gas Carriers use cubic metres
For PCC/PCTC use units
For Bulk use metric tons
For Passenger use number of passengers
Data Capture:
Data concerning this PI is available from an aggregation of all consignments in a calendar year for the vessel in question.
It is vital that this PI's unit is in coherence with the unit chosen for the PI ‘Total number of damaged or lost cargo
units/passengers injured during cargo handling’ or PI ‘Total number of damaged or lost cargo units/passengers injured
during voyage’, depending on which KPI that is to be calculated
This PI is used as the denominator in two KPIs ('Cargo incidents during cargo operations' and 'Cargo incidents during
voyage') both related to cargo incidents or passenger injuries during handling/embarking and voyage.
Copyright © InterManager, the International Ship Managers' Association 200[8]
InterManager, Page 109](https://image.slidesharecdn.com/intermanagerkpi-120217054340-phpapp01/85/Intermanager-kpi-135-320.jpg)
![PI: Tot no of damaged or lost cargo units/passengers injured during cargo
handling
The total number of damaged or lost cargo units/passengers injured during cargo operations in a calendar year. The
number is taken from received claims
Used in KPI(s):
•Cargo incidents during cargo operations
PI Value:
∑Number of damaged or lost cargo units/passengers injured
For Container Carriers use number of units
For Gas Carriers use cubic metres
For PCC/PCTC use units
For Bulk use metric tons
For Passenger use number of passengers
Data Capture:
Data concerning this PI is taken from official claims reports received by the ship manager from the ship owner/operator
depending on who the cargo owner directs the claim to.
It is vital that this PI's unit is in coherence with the unit chosen for the PI 'Total number of cargo units/passengers
transported' which is the denominator when calculating the relevant KPI's value
This PI is used in the KPI 'Cargo incidents during handling' and captures data related to damaged or lost cargo as well as
injured passengers during cargo handling or embarking passengers
Copyright © InterManager, the International Ship Managers' Association 200[8]
InterManager, Page 110](https://image.slidesharecdn.com/intermanagerkpi-120217054340-phpapp01/85/Intermanager-kpi-136-320.jpg)
![PI: Tot no of damaged or lost cargo units/passengers injured during voyage
The total number of damaged or lost cargo units/passengers injured during voyage in a calendar year. The number is
taken from received claims
Used in KPI(s):
•Cargo incidents during voyage
PI Value:
∑Number of damaged or lost cargo units/passengers injured
For Container Carriers use number of units
For Gas Carriers use cubic metres
For PCC/PCTC use units
For Bulk use metric tons
For Passenger use number of passengers
Data Capture:
Data concerning this PI is taken from official claims reports received by the ship manager from the ship owner/operator
depending on who the cargo owner directs the claim to.
It is vital that this PI's unit is in coherence with the unit chosen for the PI 'Total number of cargo units/passengers
transported' which is the denominator when calculating the relevant KPI's value
This PI is used in the KPI 'Cargo incidents during voyage' and captures data related to damaged or lost cargo as well as
injured passengers during voyage
Copyright © InterManager, the International Ship Managers' Association 200[8]
InterManager, Page 111](https://image.slidesharecdn.com/intermanagerkpi-120217054340-phpapp01/85/Intermanager-kpi-137-320.jpg)
![PI: Total number of Environmental related deficiencies
Includes deficiencies, negative observations and non-conformances of an environmental consequence (local regulations
and MARPOL) as a result of recorded external inspections and audits in a calendar year
Used in KPI(s):
•Environmental deficiencies
PI Value:
∑ Environmental-related deficiencies
Data Capture:
Data concerning this PI can be taken from external inspection reports. In any case the categorization of deficiencies
(according to the PIs in the Shipping KPI hierarchy) must be done subjectively
This PI is one of several PIs that capture information concerning deficiencies. A system of 6 categories of deficiencies
(environmental, HR, security, operational, navigational and safety) are feeding values into 6 different KPIs (based on the
same categorization) with the PI 'Total number of external inspection) as the common denominator in all KPIs for
benchmarking purposes
Copyright © InterManager, the International Ship Managers' Association 200[8]
InterManager, Page 112](https://image.slidesharecdn.com/intermanagerkpi-120217054340-phpapp01/85/Intermanager-kpi-138-320.jpg)
![PI: Total number of explosion incidents
The total number of explosion incidents on a vessel in a calendar year
Used in KPI(s):
•Fire and Explosions
PI Value:
∑Incidents
Data Capture:
This PI counts the total number of explosion incidents onboard a vessel and together with the PI 'Total number of fire
incidents' form the KPI 'Fire and Explosions'
Copyright © InterManager, the International Ship Managers' Association 200[8]
InterManager, Page 113](https://image.slidesharecdn.com/intermanagerkpi-120217054340-phpapp01/85/Intermanager-kpi-139-320.jpg)
![PI: Total number of fire incidents
The total number of fire incidents on a vessel in a calendar year
Used in KPI(s):
•Fire and Explosions
PI Value:
∑Incidents
Data Capture:
This PI counts the total number of fire incidents onboard a vessel and together with the PI 'Total number of explosion
incidents' form the KPI 'Fire and Explosions'
Copyright © InterManager, the International Ship Managers' Association 200[8]
InterManager, Page 114](https://image.slidesharecdn.com/intermanagerkpi-120217054340-phpapp01/85/Intermanager-kpi-140-320.jpg)
![PI: Total number of HR related deficiencies
Includes deficiencies, negative observations and non-conformances with a HR consequence as a result of recorded
external inspections and audits in a calendar year
Used in KPI(s):
•HR deficiencies
PI Value:
∑ HR-related deficiencies
Data Capture:
Data concerning this PI can be obtained from external inspections by external bodies (class, port, flag, vetting, insurance,
charterers) also including external ISO/ISM/OHSAS. In any case the categorization of deficiencies (according to the PIs in
the Shipping KPI Performance Hierarchy) must be done subjectively
This PI is one of several PIs that capture information concerning deficiencies. A system of 6 categories of deficiencies
(environmental, HR, security, operational, navigational and safety) are feeding values into 6 different KPIs (based on the
same categorization) with the PI 'Total number of external inspection) as the common denominator in all KPIs for
benchmarking purposes
Copyright © InterManager, the International Ship Managers' Association 200[8]
InterManager, Page 115](https://image.slidesharecdn.com/intermanagerkpi-120217054340-phpapp01/85/Intermanager-kpi-141-320.jpg)
![PI: Total number of Navigation related deficiencies
Navigation-related deficiencies, negative observations and non-conformances, recorded during external inspections and
audits in a calendar year
Used in KPI(s):
•Navigational deficiencies
PI Value:
∑ Navigation-related deficiencies
Data Capture:
Data concerning this PI can be obtained from external inspections by external bodies (class, port, flag, vetting, insurance,
charterers) also including external ISO/ISM/OHSAS. In any case the categorization of deficiencies (according to the PIs in
the Shipping KPI Performance Hierarchy) must be done subjectively
This PI is one of several PIs that capture information concerning deficiencies. A system of 6 categories of deficiencies
(environmental, HR, security, operational, navigational and safety) are feeding values into 6 different KPIs (based on the
same categorization) with the PI 'Total number of external inspection) as the common denominator in all KPIs for
benchmarking purposes
Copyright © InterManager, the International Ship Managers' Association 200[8]
InterManager, Page 116](https://image.slidesharecdn.com/intermanagerkpi-120217054340-phpapp01/85/Intermanager-kpi-142-320.jpg)
![PI: Total number of Operational related deficiencies
Operational-related deficiencies, negative observations and non-conformances, recorded during external inspections and
audits in a calendar year, not including HR deficiencies, security deficiencies, safety deficiencies and environmental
deficiencies
Used in KPI(s):
•Operational deficiencies
PI Value:
∑ Operational-related deficiencies
Data Capture:
Data concerning this PI can be obtained from external inspections by external bodies (class, port, flag, vetting, insurance,
charterers) also including external ISO/ISM/OHSAS. In any case the categorization of deficiencies (according to the PIs in
the Shipping KPI Performance Hierarchy) must be done subjectively
This PI is one of several PIs that capture information concerning deficiencies. A system of 6 categories of deficiencies
(environmental, HR, security, operational, navigational and safety) are feeding values into 6 different KPIs (based on the
same categorization) with the PI 'Total number of external inspection) as the common denominator in all KPIs for
benchmarking purposes
Copyright © InterManager, the International Ship Managers' Association 200[8]
InterManager, Page 117](https://image.slidesharecdn.com/intermanagerkpi-120217054340-phpapp01/85/Intermanager-kpi-143-320.jpg)
![PI: Total number of PSC inspections
Total number of port state control inspections in a calendar year
Used in KPI(s):
•Port state control deficiencies
•Port state control detentions
PI Value:
∑ Port state control inspections pr calendar year
Data Capture:
Data concerning this PI is captured by counting the number of Port state control inspections
This PI is used as the denominator in two KPIs ('Port state control deficiencies' and Port state control detentions') to
enable benchmarking of vessels even with a different number of port state control inspections (hence a different risk for
receiving deficiencies/detentions in the first place)
Copyright © InterManager, the International Ship Managers' Association 200[8]
InterManager, Page 118](https://image.slidesharecdn.com/intermanagerkpi-120217054340-phpapp01/85/Intermanager-kpi-144-320.jpg)
![PI: Total number of PSC deficiencies
The total number of deficiencies including deficiencies resulting in detention, excluding observations (code99) from port
state control inspections in a calendar year
Used in KPI(s):
•Port state control deficiency rate
PI Value:
∑ Deficiencies
Data Capture:
Data concerning this PI can be taken from the Port state control inspection reports issued after each inspection
A comprehensive picture regarding port state control performance is considered as vital. This PI together with the PI 'Total
number of PSC inspections' provides a ratio of the total number of deficiencies over the total number of PSC inspections in
the KPI 'Port state control deficiency rate'.
Copyright © InterManager, the International Ship Managers' Association 200[8]
InterManager, Page 119](https://image.slidesharecdn.com/intermanagerkpi-120217054340-phpapp01/85/Intermanager-kpi-145-320.jpg)
![PI: Total number of PSC inspections resulting in a detention
The total number of port state control inspections, excluding verifications, resulting in a detention in a calendar year.
Multiple reasons for detention in one inspection count as ONE
Used in KPI(s):
•Port state control detention
PI Value:
∑Number of inspections resulting in a detention
Data Capture:
Data concerning this PI can be taken from counting all port state control inspection reports that contains a detention
This PI counts the number of port state control inspections resulting in a detention. This is because a comprehensive
picture regarding port state control performance is considered as vital
Copyright © InterManager, the International Ship Managers' Association 200[8]
InterManager, Page 120](https://image.slidesharecdn.com/intermanagerkpi-120217054340-phpapp01/85/Intermanager-kpi-146-320.jpg)
![PI: Total number of recorded external inspections
Total number of recorded external inspections by external bodies (class, port, flag, vetting, insurance, charterers) also
including external ISO/ISM/OHSAS audits in a calendar year (excluding voluntary inspections made for the purpose of
quality improvement)
Used in KPI(s):
•Environmental deficiencies
•HR deficiencies
•Security deficiencies
•Operational deficiencies
•Safety deficiencies
•Navigational deficiencies
PI Value:
∑ External inspections
Data Capture:
Data concerning this PI can be taken from summing up all external inspections for the vessel in question in a calendar
year
This PI serves as a common denominator in 6 different KPIs (for benchmarking purposes) related to deficiencies identified
during external inspections
Copyright © InterManager, the International Ship Managers' Association 200[8]
InterManager, Page 121](https://image.slidesharecdn.com/intermanagerkpi-120217054340-phpapp01/85/Intermanager-kpi-147-320.jpg)
![PI: Total number of Safety related deficiencies
Safety-related deficiencies, negative observations and non-conformances, recorded during external inspections and audits
in a calendar year
Used in KPI(s):
•Safety deficiencies
PI Value:
∑ Safety-related deficiencies
Data Capture:
Data concerning this PI can be obtained from external inspections by external bodies (class, port, flag, vetting, insurance,
charterers) also including external ISO/ISM/OHSAS. In any case the categorization of deficiencies (according to the PIs in
the Shipping KPI Performance Hierarchy) must be done subjectively
This PI is one of several PIs that capture information concerning deficiencies. A system of 6 categories of deficiencies
(environmental, HR, security, operational, navigational and safety) are feeding values into 6 different KPIs (based on the
same categorization) with the PI 'Total number of external inspection) as the common denominator in all KPIs for
benchmarking purposes
Copyright © InterManager, the International Ship Managers' Association 200[8]
InterManager, Page 122](https://image.slidesharecdn.com/intermanagerkpi-120217054340-phpapp01/85/Intermanager-kpi-148-320.jpg)
![PI: Total number of Security related deficiencies
Total number of security related deficiencies, including negative observations and non-conformances as a result of
recorded external inspections and audits in a calendar year. A security related deficiency is a result of violation of the ISPS
code
Used in KPI(s):
•Security deficiencies
PI Value:
∑ Security-related deficiencies
Data Capture:
Data concerning this PI can be obtained from external inspections by external bodies (class, port, flag, vetting, insurance,
charterers) also including external ISO/ISM/OHSAS. In any case the categorization of deficiencies (according to the PIs in
the Shipping KPI Performance Hierarchy) must be done subjectively
This PI is one of several PIs that capture information concerning deficiencies. A system of 6 categories of deficiencies
(environmental, HR, security, operational, navigational and safety) are feeding values into 6 different KPIs (based on the
same categorization) with the PI 'Total number of external inspection) as the common denominator in all KPIs for
benchmarking purposes
Copyright © InterManager, the International Ship Managers' Association 200[8]
InterManager, Page 123](https://image.slidesharecdn.com/intermanagerkpi-120217054340-phpapp01/85/Intermanager-kpi-149-320.jpg)
![PI: Training days
Total number of training days in a calendar year (fleet average)
Training = Training exceeding statutory requirements performed by formal trainer (excluding computer-based)
Used in KPI(s):
•Crew management
PI Value:
∑Training days
Data Capture:
As Training days is calculated on a fleet level, all vessels within the fleet should be given the same value on this PI
This PI is one of 5 PIs related to the KPI 'Crew management' which reflects the ship manager's willingness and ability to
acquire and maintain the required competence/crew for their operations. This specific PI reflects the ship manager's
willingness to invest in crew training.
Copyright © InterManager, the International Ship Managers' Association 200[8]
InterManager, Page 124](https://image.slidesharecdn.com/intermanagerkpi-120217054340-phpapp01/85/Intermanager-kpi-150-320.jpg)
![PI: Transport Work
Transport work is a product of the cargo transported and the laden distance sailed for a specific vessel in a calendar year.
Used in KPI(s):
•CO2 emissions
•NOx emissions
•SOx emissions
PI Value:
=∑Loaded Cargo * Laden Distance Sailed
Data Capture:
Transport work is given as ton-mile i.e. Loaded cargo is measured in metric tons and laden distance is measured in
nautical miles. For some shipping segments, the metric ton may not be considered applicable as cargo measure and IMO
opens for the usage of different units of measure for different segments. [Container Ships: TEU (empty or full), Passenger
vessels: passengers, Car carriers: car units or occupied lane meters]
NOTE: This is not suitable for the KPI if it is to enable comparison between modes (e.g. bulk vs. containers)
This PI is used as a denominator in KPIs related to emissions in order to be able to say something about the energy
efficiency (related to CO2) and value achieved by emissions (related to NOx and SOx)
Copyright © InterManager, the International Ship Managers' Association 200[8]
InterManager, Page 125](https://image.slidesharecdn.com/intermanagerkpi-120217054340-phpapp01/85/Intermanager-kpi-151-320.jpg)
![PI: Vessel running cost budget
Total annual (fiscal year) budget per vessel including M&R, purchasing, operation, crewing, insurance and other vessel
operating costs.
Capital expenses such as upgrades, drydockings and modifications are not taken into account
Used in KPI(s):
•Budget control pr vessel
PI Value:
Total budget per vessel
Budget should be given in USD
Data Capture:
This PI is used to be able to measure the deviation from a vessel's running costs budget represented in percentage by
comparing
it to the PI 'Actual running costs and accruals'
Copyright © InterManager, the International Ship Managers' Association 200[8]
InterManager, Page 126](https://image.slidesharecdn.com/intermanagerkpi-120217054340-phpapp01/85/Intermanager-kpi-152-320.jpg)
![PI: Violation of rest hours
This PI measures the number of cases of STCW or ILO violations regarding rest or work hours
Used in KPI(s):
•Crew planning
PI Value:
∑Number of cases of work hours violations in a calendar year
Data Capture:
This PI is used in the KPI 'Crew planning' which reflects the ship manager's ability to adhere to official requirements
related to rest hours as well as agreed tenure of contracts
Copyright © InterManager, the International Ship Managers' Association 200[8]
InterManager, Page 127](https://image.slidesharecdn.com/intermanagerkpi-120217054340-phpapp01/85/Intermanager-kpi-153-320.jpg)


