Downloaded 16 times

![52
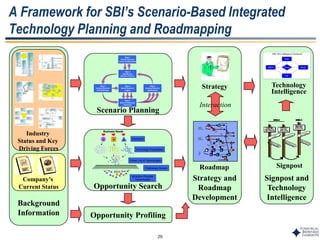
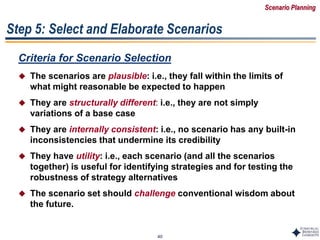
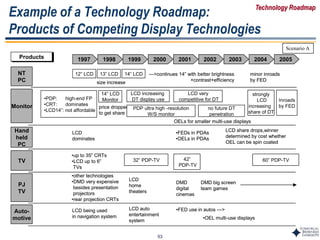
Example of a Technology Roadmap:
Competing Display Technologies
TechnologyTechnology 1997 1998 1999 2000 2001 2002 2003 2004 2005
LCD
FED
PDP
OEL
DMD
12.1” 14” 15” 17” 20”
$50~60/in < 14” $15~20/in
< 16” $25~30/in
> 17” $30 ~ 35/in
matches CRT
•Largest size
•Cost-effective
increasing gradually
~ $35/in $20~25/in•OEM cost/in
•Readability
•Cost-eff size
•OEM cost/in
4” mono 6” color 15” color
end of 2005
gradual
milestone
high-end military/
avionics
accelerating
military use easier to increase size
than for LCD
cost/inch drops rapidly
•Cost-eff size
•OEM cost
•Selling below cost
to gain market
share
21”
@$8000
32”
@$5000
42”
@$4200
60”
@$5000
nothing yet
commercialized
multicolor,
low information
content
6”
hand-held
PC
full color
full color displays
[normal up to 10”]
•Cost is uncertain
very
expensive
low yields
60”
large
screen
yield improvements
&
resolution
improvements
focus research needed
$5~10/inch
passive matrix
CRT
•Largest cost
effective size 35”~40”
Flat CRTs >2005
(not in Digital TV)
Scenario A
Technology Roadmap](https://image.slidesharecdn.com/tmitpprocess-180312074601/85/Integrated-Technology-Planning-Process-52-320.jpg)
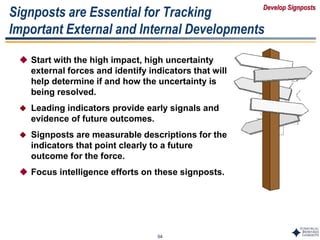

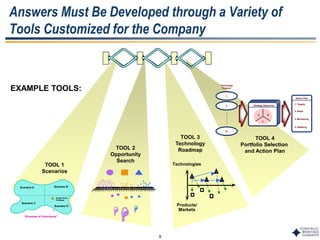
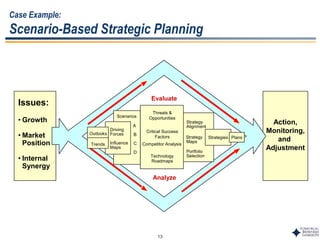
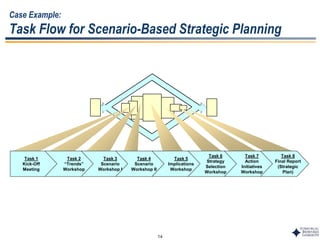
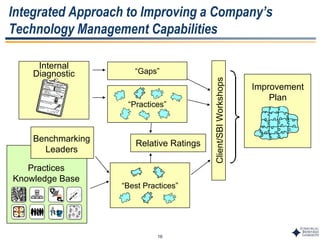
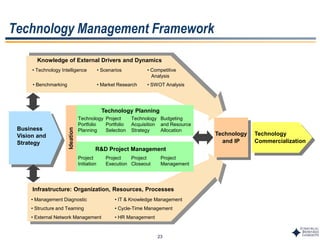
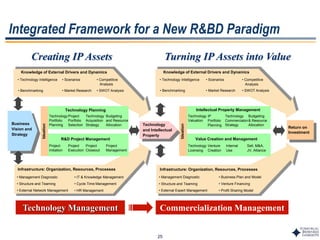
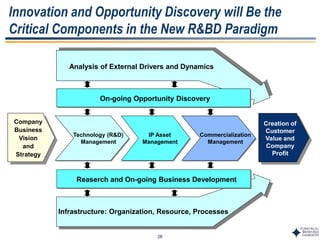
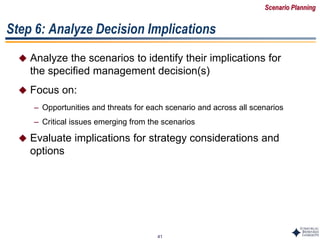
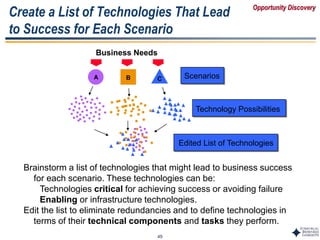
This document outlines Dr. Chulho Park's integrated technology planning process. It discusses (1) conducting background research on a company's current status and key industry driving forces, (2) using scenario planning to develop potential future scenarios, and (3) identifying attractive technology opportunities through scenario analysis and an opportunity search. The process aims to provide companies with tools and frameworks to strategically manage their technology and integrate it with business planning.


