Download as PDF, PPTX

![4
References:
Accenture. (2010). Improve Customer Service and Fraud Detection to Deliver High Performance
Through Claims. [pdf]. Retrieved from http://www.accenture.com/us-en/Pages/insight-insurance-consumer-fraud-survey-summary.aspx
Federal Insurance Office. (2013). Annual report on the insurance industry. [pdf]. Retrieved from
http://www.treasury.gov/initiatives/fio/reports-and-notices/Documents/FIO%20Annual%20Report%202013.pdf](https://image.slidesharecdn.com/insurancemetricsoverview-160412165625/75/Insurance-metrics-overview-5-2048.jpg)

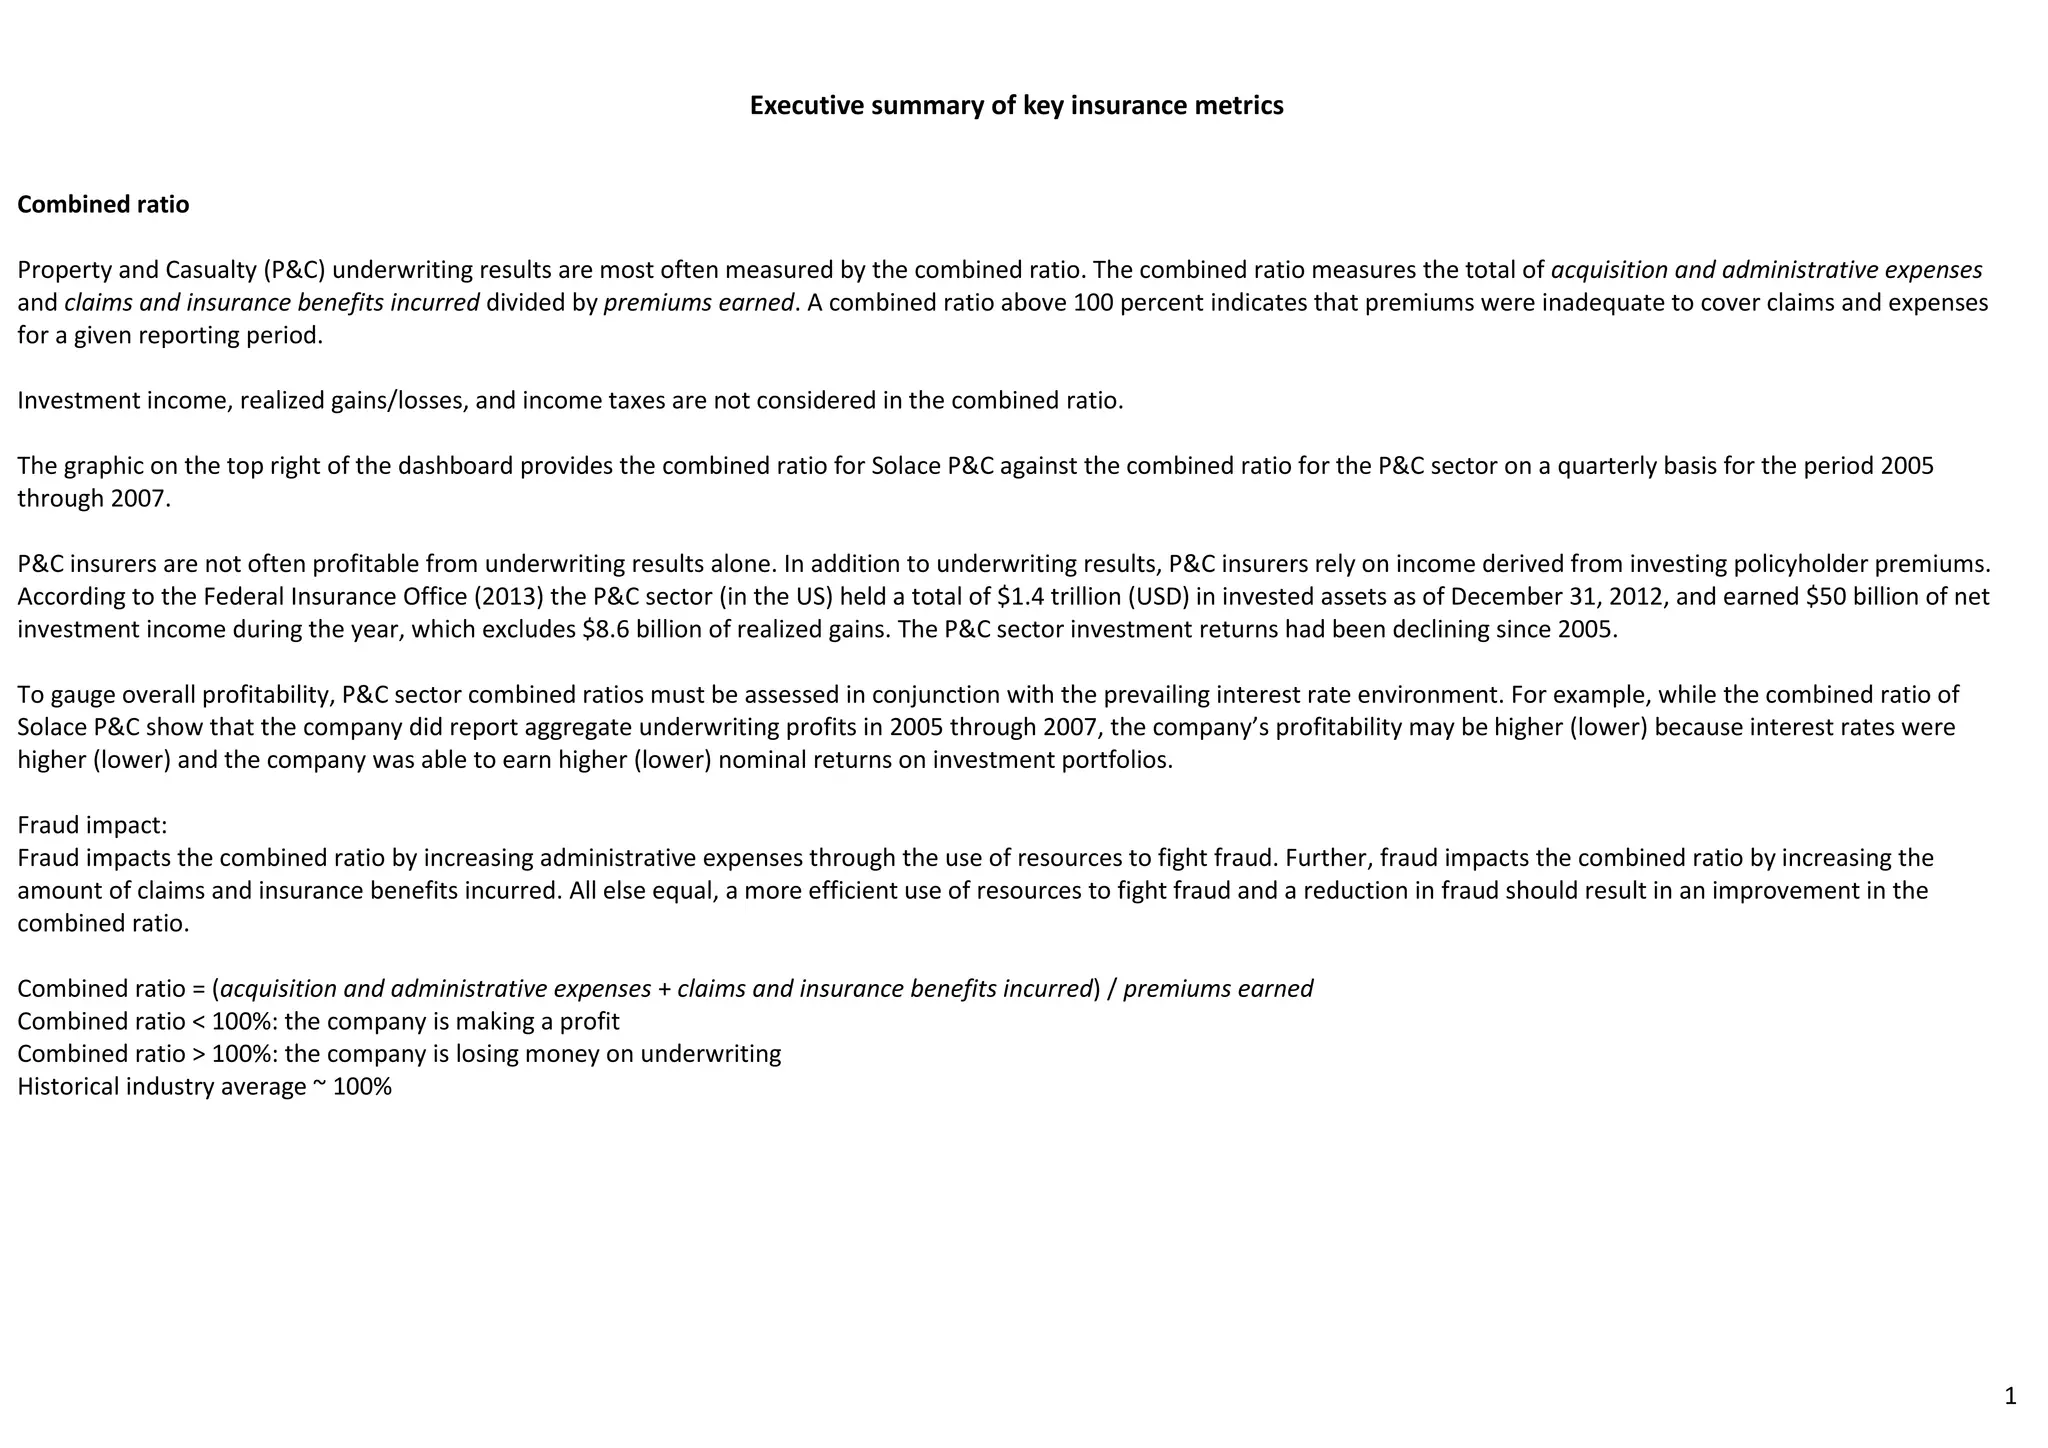
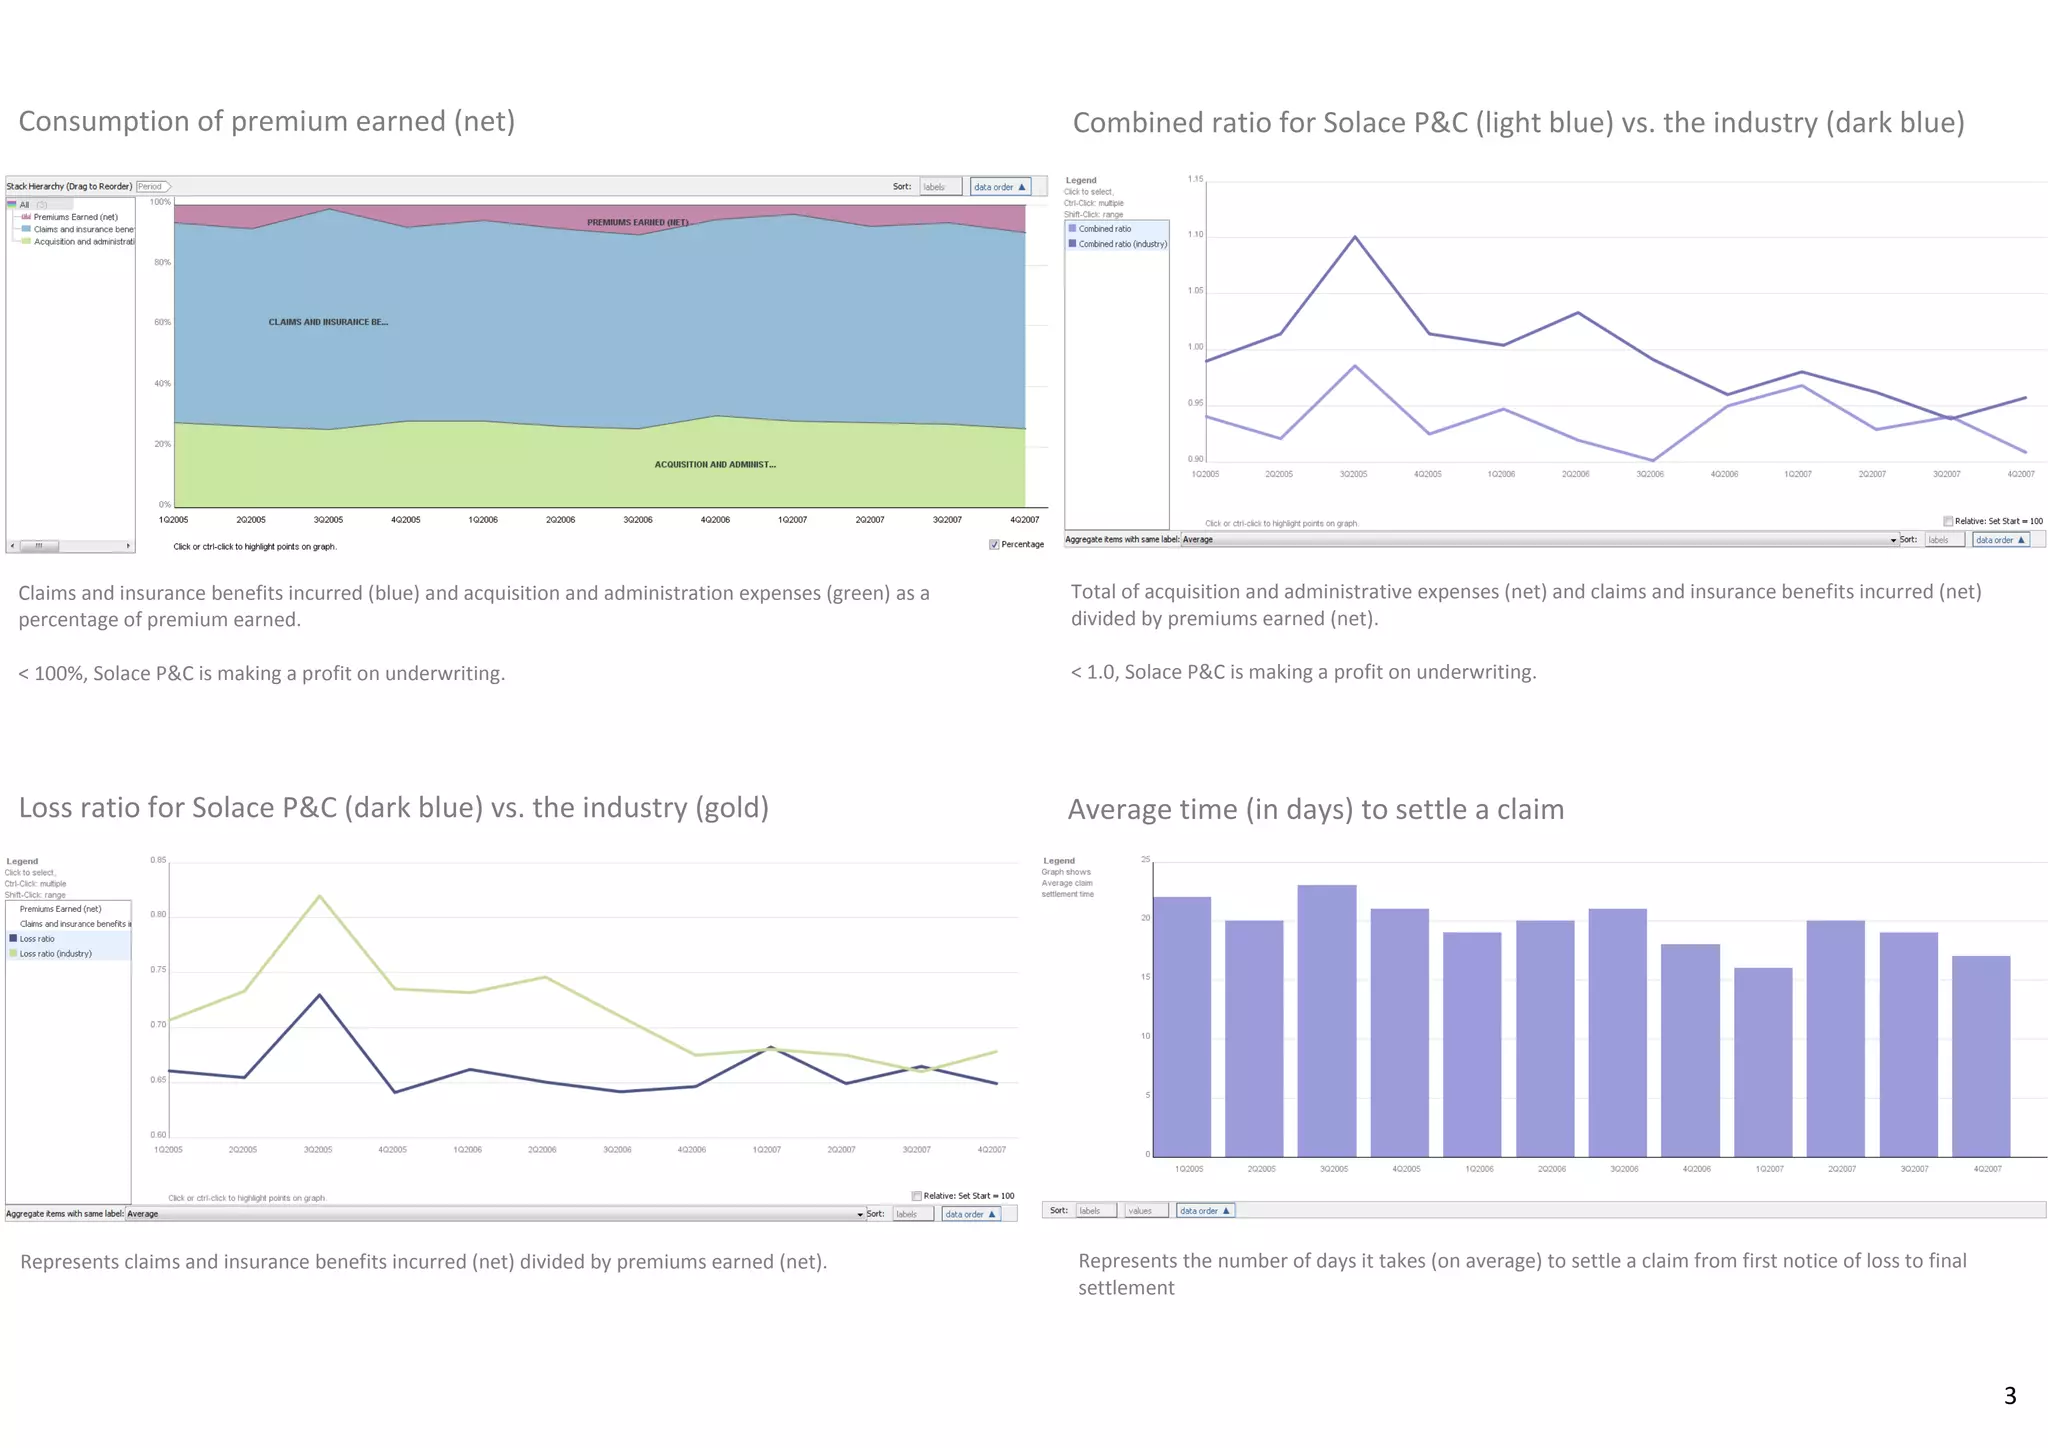
The document discusses key property and casualty (P&C) insurance metrics including the combined ratio, loss ratio, and expense ratio. The combined ratio measures total claims expenses and administrative costs relative to premiums earned, and a ratio over 100% indicates losses. The loss ratio and expense ratio are components of the combined ratio. Other metrics discussed include investment returns, average claim settlement time, and how fraud impacts various ratios by increasing costs. Historical industry averages for ratios are provided for context.


![PPB SURVIVAL GUIDE [89790]](https://cdn.slidesharecdn.com/ss_thumbnails/02582383-2a3b-4812-8ee4-06ec8fd4a970-160415015325-thumbnail.jpg?width=640&height=640&fit=bounds)


![Vibe Coding vs. Spec-Driven Development [Free Meetup]](https://cdn.slidesharecdn.com/ss_thumbnails/vibecodingvsspecdrivendevelopment-251209105622-43f455e7-thumbnail.jpg?width=640&height=640&fit=bounds)


