SlideShare a Scribd company logo
June 2018
Most countries experienced a positive premium growth in
life and/or non-life insurance in 2017
Preliminary data for 2017 show an increase in life and/or non-life gross premiums of domestic insurance
companies in 40 out of the 43 reporting countries, compared to 2016 (see full list of participants in the
methodological notes at the end of this note). Gross premiums of domestic insurance companies rose in real
terms in 15 countries in both life and non-life sectors (e.g. in the United States), in 10 other countries in the life
sector only and in 15 other countries in the non-life sector only (Figure 1). Belgium, Finland and Norway were
the only three countries in the sample where premiums declined in both sectors in real terms. The downward
trend in non-life premiums in Finland is due to a change in the reporting population as a major non-life
insurance company became a branch of its parent company in Sweden (and is therefore not considered a
domestic company anymore in 2017).
Insurance Markets in Figures
Insurance Markets in Figures provides a short preview of the latest trends in the insurance sector in a selection of OECD and non-OECD
countries. This second issue shows indicators based on preliminary data and early estimates for 2017. An Excel file of the underlying data is
available at http://www.oecd.org/finance/insurance/globalinsurancemarkettrends.htm. This factsheet was made possible by close co-
operation between the OECD, the Association of Latin American Insurance Supervisors (ASSAL) and the various national bodies that provided
data and comments.
A more developed analysis based on the final data collected for 2017 will be published in the 2018 edition of Global Insurance Market Trends
(forthcoming).
For more information, please contact Romain Despalins (romain.despalins@oecd.org) or Mamiko Yokoi-Arai (mamiko.yokoi-arai@oecd.org).
© OECD – 2018
Figure 1. Annual real growth rates (%) of direct gross premiums of domestic insurance companies by sector, 2017
(preliminary)
Notes: The circles show the size of total direct gross premiums (in the life and non-life sectors combined) of domestic insurance
companies in US dollar in 2017. See the end of this factsheet for more methodological notes.
Source: OECD Global Insurance Statistics.
POL
PRT
USA
HUN
HND
SVN
CRI
DNK
ISL
NIC
SVK
LVA
ISR
TUN
LUX
BRA
PER
MYS
GRC COL
IDN TUR
BOL
SGP
RUS
AUS
ESP
LTU
AUT
CZE
ITA
NLD
IND
CHE
CHL
MEX
EST
SLV
DEU
FRA
BEL
NOR
FIN
-20
-10
0
10
20
-20 -10 0 10 20 30 40
Increase in both sectors Increase in life sector only
Increase in non-life sector only Decline in both sectors
Life
Non-life
INSURANCE MARKETS IN FIGURES
Real growth rates of life premiums varied widely across countries. The largest increase occurred in Russia
(40.7%), followed by Singapore (22.2%) and Bolivia (21.2%). Five additional countries experienced a real
growth rate above 10%: Indonesia, Israel, Luxembourg, Tunisia and Turkey. By contrast, life gross premiums
declined the most in Australia in 2017 (-16.1%), as a result of a fall in deposits for investment-linked products.
Likewise, trends were diverse in the non-life sector. Lithuania recorded the strongest growth of non-life gross
premiums in real terms in 2017 (24.1%), driven by prices of motor third-party liability policies rising. By
contrast, non-life gross premiums decreased the most in Bolivia in 2017 among reporting countries (-9.8%).
The largest amounts of premiums were recorded in France, Germany (USD 0.2 trillion each) and the United
States (USD 2.8 trillion). However, the highest growth rates were achieved by countries with lower total
premiums (e.g. Costa Rica, Honduras, Israel, Latvia).
Diverse trends in claims payments in 2017
Insurers engaged in life insurance activities paid more claims in 2017 than in 2016 in 28 out of the 42 reporting
countries (Figure 2). The largest increase in gross claims payments in the life sector occurred in two European
countries: Lithuania (33.4%) and Latvia (29.5%). In both countries, this trend may be attributed to the
expiration of insurance contracts (e.g. expiration of 15-year contracts concluded in 2002 in Lithuania).
Conversely, two other European countries experienced the largest decline in gross claims payments: Portugal
(-33.8%) and Germany (-17.9%). In Germany, life insurance policies that were contracted in 2004, as a result of
the Retirement Income Act, usually had a 12-year maturity, to be acceptable for tax purposes, and expired in
2016, leading to larger amount of claims paid that year. The trend observed in Portugal may partly be due to a
decline in surrenders.
Figure 2. Annual real growth rates (%) of direct gross claims paid by domestic insurance companies by sector,
2017 (preliminary)
CHE
SVK
ESP
ISL
PER
HND
EST
MEX
HUN
FRA
POL
ITA
SVN
ISR
NLD LVA
LTU
MYS
NOR
BOL
TUN
SGP
COL
RUS
CHL
CRI
LUX
IDN
PRT DEU
USA AUT
CZE
IND
GRC
DNK
NIC
TUR
BEL
SLVFIN
BRA
-40
-20
0
20
40
60
80
-40 -30 -20 -10 0 10 20 30 40
Increase in both sectors Increase in life sector only
Increase in non-life sector only Decline in both sectors
Life
Non-life
Notes: The circles show the size of total direct gross claims paid (in the life and non-life sectors combined) by domestic insurance
companies in US dollar in 2017. The larger the circle, the larger the amount of direct gross claims paid in the reporting country. The size
of the circles in this chart is not comparable with the circles in Figure 1. See the end of this factsheet for more methodological notes.
Source: OECD Global Insurance Statistics.
INSURANCE MARKETS IN FIGURES
Almost two thirds of the reporting countries recorded an increase in gross claims paid in the non-life sector.
This increase was the largest in Peru (over 85%), as a result of heavy rains and floods in 2017. Claims payments
increased by more than 20% in real terms in 2017 in three additional countries: Honduras, Lithuania and
Nicaragua. In 23 other reporting countries, gross claims payments increased, but by less than 10%. In 15
countries, claims payments declined in real terms, especially in Bolivia (-26.0%) and Luxembourg (-21.3%).
The United States was the country with the largest amount of gross claims paid in 2017 (USD 1.6 trillion, all
sectors combined).
Bills and bonds represented the largest proportion of investments of insurers
Bills and bonds accounted for more than half of the investments of insurance companies in 34 out of the 42
reporting countries in 2017 (Figure 3). They exceeded 80% of the investments in Brazil (83.5%), Hungary
(82.2%), Mexico (82.0%) and Greece (81.1%).
Insurers in a few countries have however favoured investments in equities, such as in Denmark and Indonesia
where equities represented 40.8% and 29.8% of investments respectively (compared to 34.5% and 20.7% for
bills and bonds respectively).
Figure 3. Asset allocation of domestic insurance companies (all sectors), 2017 (preliminary)
As a percentage of total investment
0 20 40 60 80 100
Brazil
Hungary
Mexico
Greece
Czech Republic
Colombia
Nicaragua
Spain
Portugal
El Salvador
Estonia
Lithuania
Norway
Belgium
India
Italy
Costa Rica
Peru
Poland
Slovenia
Latvia
Australia
Bolivia
France
United States
Israel
Austria
Chile
Germany
Singapore
Tunisia
Malaysia
Netherlands
Switzerland
Iceland
Finland
Luxembourg
Denmark
Russia
United Kingdom
Honduras
Indonesia
Bills and bonds Equity
Cash and deposits CIS (when look-through unavailable)
Others
Notes: See the end of this factsheet for methodological notes.
Source: OECD Global Insurance Statistics.
INSURANCE MARKETS IN FIGURES
Positive real investment rates of return in 2017 in most reporting countries
Insurers experienced positive real positive investment rates of return in 2017 - irrespective of whether they
engaged in life insurance activities only (i.e. life insurers), non-life insurance only (i.e. non-life insurers) or both
(i.e. composite companies) – in 13 out of the 19 reporting countries (Figure 4). Life insurers in Malaysia
achieved the highest real investment rate of return (17.8%) thanks to the strong performance of the Malaysian
equity market in 2017.
By contrast, all types of insurer failed to achieve positive real returns in Lithuania (where the share of
investments in equities is relatively low) and in Russia.
Figure 4. Average annual real net investment return by type of domestic insurer in 2017 (preliminary) (%)
Notes: See the end of this factsheet for methodological notes.
Source: OECD Global Insurance Statistics.
-5
0
5
10
15
20
Life Non-Life Composite
INSURANCE MARKETS IN FIGURES
METHODOLOGICAL NOTES TO BE TAKEN INTO CONSIDERATION WHEN INTERPRETING THE DATA
General: Data are collected within the framework of the OECD Global Insurance Statistics (GIS) project. Data in this
note are preliminary and may be revised in the 2018 edition of the report Global Insurance Market Trends
(forthcoming). This note focuses mainly on the direct insurance business of domestically incorporated undertakings (i.e.
incorporated under national law) in reporting countries, and includes data for the following participating countries
among:
● OECD Members: Australia, Austria, Belgium, Chile, Czech Republic, Denmark, Estonia, Finland, France,
Germany, Greece, Hungary, Iceland, Israel, Italy, Latvia, Luxembourg, Mexico, Netherlands, Norway, Poland,
Portugal, Slovak Republic, Slovenia, Spain, Switzerland, Turkey, United Kingdom, United States;
● ASSAL (non-OECD) Members: Bolivia, Brazil, Colombia, Costa Rica, El Salvador, Honduras, Nicaragua, Peru;
● Other countries: India, Indonesia, Lithuania, Malaysia, Russia, Singapore and Tunisia.
Insurance companies may carry out life insurance activities only (i.e. life insurers), non-life insurance activities (i.e. non-
life insurers) or both (i.e. composite insurers). In some countries, some insurance companies that are considered as life
insurers (respectively non-life insurers) can carry out some specific non-life (respectively life) activities on an ancillary
basis.
Data for Estonia include business abroad from branches of Estonian insurance companies. Data for Iceland do not cover
the State Natural Catastrophe insurance undertaking. Data for Indonesia cover conventional and sharia insurance. Data
on premiums, claims and investment performance for Lithuania are based on IFRS while data on asset allocation follow
the Solvency II reporting template. Data for Lithuania include business abroad. Data for Luxembourg exclude marine
insurers but include business abroad from branches of Luxembourg companies. Data for Malaysia cover both
traditional insurance and Takaful insurance. Data for Mexico cover insurance and surety institutions. Data for the
Netherlands include basic health insurance.
For some countries, data cover insurance companies subject to Solvency II quarterly reporting requirements and
exclude the smallest insurance companies (e.g. France, the Netherlands). Data for the Netherlands also exclude one
insurance undertaking with the end of financial year in April.
Countries in some charts are labelled with their ISO code. ISO codes are available on the United Nation Statistics
Division internet page at the following address: http://unstats.un.org/unsd/methods/m49/m49alpha.htm.
Figure 1: Life premiums for Belgium include some elements that are reported as non-life insurance in the statutory
accounts (e.g. health). Calculations of growth rates do not take into account composite companies for El Salvador.
Annual growth rates for India, Israel and Spain are OECD estimates based on the amount of premiums reported for the
period April - Dec 2017 for India, and Jan - Sept 2017 for Israel and Spain.
Figure 2: Australia recorded a high level of claims in the life sector in 2016 due to a transfer of insurance policies from
the Universal Super Scheme to the MLC Super Fund, distorting the trend between 2016 and 2017 (not shown in the
chart). Real gross claims paid in the non-life sector in Australia increased by 5.7% in 2017. The overall amount of gross
claims paid in Australia in 2017 (life and non-life insurance combined) was worth USD 54,253 million. Calculations of
growth rates do not take into account composite companies for El Salvador. Data for Estonia and Greece refer to
growth rates of claims incurred. Annual growth rates for India, Israel and Spain are OECD estimates based on the
amount of gross claims paid reported for the period April - Dec 2017 for India, and Jan - Sept 2017 for Israel and Spain.
Figure 3: Data refer to end-2017 for all countries, except Spain (end Q3 2017). The GIS database gathers information on
investments of insurance companies in collective investment schemes (CIS) and the look-through of these investments
in equities, bills and bonds, cash and deposits and other. Data on asset allocation in this figure show both direct
investments of insurance companies in equities, bills and bonds and cash and deposits, and their indirect investments
in these categories through CIS when the look-through of CIS investments is available. When the look-through is not
available, investments by insurance companies in CIS are shown in a separate category and data in the figure for the
countries in this case only show direct investments of insurance companies in equities, bills and bonds and cash and
deposits. Investments of insurance companies related to unit-linked products are excluded from the calculations of the
asset allocation, except for Indonesia and the United Kingdom where they are combined with investments from non-
unit-linked insurance in the main investment categories. The category “equity” includes holdings in related
undertakings for the Czech Republic. Data for Germany are estimates; the breakdown of investments of insurance
companies through CIS has not been approved by external auditors. The category “equity” includes investments in
shares of subsidiary companies for Peru.
Figure 4: Average annual real net investment rates of return are calculated based on the nominal annual net
investment rates of return reported by countries for the period Dec 2016 - Dec 2017 and the variation of the consumer
price index over the same period.
This work is published under the responsibility of the Secretary-General of the OECD. The opinions expressed and arguments employed herein do not necessarily
reflect the official views of the OECD or the governments of its member countries. This document and any map included herein are without prejudice to the status of or
sovereignty over any territory, to the delimitation of international frontiers and boundaries and to the name of any territory, city or area.
The statistical data for Israel are supplied by and under the responsibility of the relevant Israeli authorities. The use of such data by the OECD is without prejudice to
the status of the Golan Heights, East Jerusalem and Israeli settlements in the West Bank under the terms of international law.

More Related Content

What's hot

Working conditions in Trentino co-operatives - Chiara Carini
Working conditions in Trentino co-operatives - Chiara CariniWorking conditions in Trentino co-operatives - Chiara Carini
Working conditions in Trentino co-operatives - Chiara CariniOECD CFE
 
Presentation on sovereign borrowing
Presentation on sovereign borrowingPresentation on sovereign borrowing
Presentation on sovereign borrowingSebastian Schich
 
Corporation Tax and Brexit
Corporation Tax and BrexitCorporation Tax and Brexit
Corporation Tax and BrexitIpsos UK
 
Productivity growth and fiscal adjustment
Productivity growth and fiscal adjustmentProductivity growth and fiscal adjustment
Productivity growth and fiscal adjustmentRyan Saxby Hill
 
News of the week from 25th oct to
News of the week from 25th oct toNews of the week from 25th oct to
News of the week from 25th oct topuja
 
Prof. dr. Yves Stevens, ocin22
Prof.  dr.  Yves  Stevens, ocin22Prof.  dr.  Yves  Stevens, ocin22
Prof. dr. Yves Stevens, ocin22Starttech Ventures
 
Labour demand trends in TAA - Alexandra Tsvetkova
Labour demand trends in TAA - Alexandra TsvetkovaLabour demand trends in TAA - Alexandra Tsvetkova
Labour demand trends in TAA - Alexandra TsvetkovaOECD CFE
 
Estonia ranks 1st in the Tax Competitiveness Index
Estonia ranks 1st in the Tax Competitiveness IndexEstonia ranks 1st in the Tax Competitiveness Index
Estonia ranks 1st in the Tax Competitiveness IndexMartin Koch
 
The spatial dimension of productivity in Italian co-operatives- Wessel Vermeulen
The spatial dimension of productivity in Italian co-operatives- Wessel VermeulenThe spatial dimension of productivity in Italian co-operatives- Wessel Vermeulen
The spatial dimension of productivity in Italian co-operatives- Wessel VermeulenOECD CFE
 

What's hot (15)

Year-Ahead Predictions 2019
 Year-Ahead Predictions 2019 Year-Ahead Predictions 2019
Year-Ahead Predictions 2019
 
05182015
0518201505182015
05182015
 
Working conditions in Trentino co-operatives - Chiara Carini
Working conditions in Trentino co-operatives - Chiara CariniWorking conditions in Trentino co-operatives - Chiara Carini
Working conditions in Trentino co-operatives - Chiara Carini
 
Presentation on sovereign borrowing
Presentation on sovereign borrowingPresentation on sovereign borrowing
Presentation on sovereign borrowing
 
Corporation Tax and Brexit
Corporation Tax and BrexitCorporation Tax and Brexit
Corporation Tax and Brexit
 
Productivity growth and fiscal adjustment
Productivity growth and fiscal adjustmentProductivity growth and fiscal adjustment
Productivity growth and fiscal adjustment
 
Gilbert Cette - Comments on three papers
Gilbert Cette - Comments on three papersGilbert Cette - Comments on three papers
Gilbert Cette - Comments on three papers
 
News of the week from 25th oct to
News of the week from 25th oct toNews of the week from 25th oct to
News of the week from 25th oct to
 
OECD Corporate Tax Statistics
OECD Corporate Tax StatisticsOECD Corporate Tax Statistics
OECD Corporate Tax Statistics
 
Prof. dr. Yves Stevens, ocin22
Prof.  dr.  Yves  Stevens, ocin22Prof.  dr.  Yves  Stevens, ocin22
Prof. dr. Yves Stevens, ocin22
 
Labour demand trends in TAA - Alexandra Tsvetkova
Labour demand trends in TAA - Alexandra TsvetkovaLabour demand trends in TAA - Alexandra Tsvetkova
Labour demand trends in TAA - Alexandra Tsvetkova
 
Estonia ranks 1st in the Tax Competitiveness Index
Estonia ranks 1st in the Tax Competitiveness IndexEstonia ranks 1st in the Tax Competitiveness Index
Estonia ranks 1st in the Tax Competitiveness Index
 
The spatial dimension of productivity in Italian co-operatives- Wessel Vermeulen
The spatial dimension of productivity in Italian co-operatives- Wessel VermeulenThe spatial dimension of productivity in Italian co-operatives- Wessel Vermeulen
The spatial dimension of productivity in Italian co-operatives- Wessel Vermeulen
 
Oecd Competition Trends 2020
Oecd Competition Trends 2020Oecd Competition Trends 2020
Oecd Competition Trends 2020
 
Racial Equity Impacts of the Economic Recovery
Racial Equity Impacts of the Economic RecoveryRacial Equity Impacts of the Economic Recovery
Racial Equity Impacts of the Economic Recovery
 

Similar to Insurance Markets in Figures 2017

Swiss Re sigma 3/2019: World insurance: the great pivot east continues
Swiss Re sigma 3/2019: World insurance: the great pivot east continuesSwiss Re sigma 3/2019: World insurance: the great pivot east continues
Swiss Re sigma 3/2019: World insurance: the great pivot east continuesΔρ. Γιώργος K. Κασάπης
 
Vietnam Insurance Market Report 2018
Vietnam Insurance Market Report 2018 Vietnam Insurance Market Report 2018
Vietnam Insurance Market Report 2018 FiinGroup JSC
 
Will risks-derail-the-modest-recovery-oecd-interim-economic-outlook-march-2017
Will risks-derail-the-modest-recovery-oecd-interim-economic-outlook-march-2017Will risks-derail-the-modest-recovery-oecd-interim-economic-outlook-march-2017
Will risks-derail-the-modest-recovery-oecd-interim-economic-outlook-march-2017OECD, Economics Department
 
Medef - La France peut-elle retrouver le chemin d'une croissance forte ?
Medef  - La France peut-elle retrouver le chemin d'une croissance forte ?Medef  - La France peut-elle retrouver le chemin d'une croissance forte ?
Medef - La France peut-elle retrouver le chemin d'une croissance forte ?Lionel Sanchez ✔
 
OECD-Wirtschaftsausblick November 2017
OECD-Wirtschaftsausblick November 2017OECD-Wirtschaftsausblick November 2017
OECD-Wirtschaftsausblick November 2017OECD Berlin Centre
 
THE PRESENT SCENARIO IN THE LIFE INSURANCE SECTOR IN INDIA PERIOD OF STUDY- F...
THE PRESENT SCENARIO IN THE LIFE INSURANCE SECTOR IN INDIA PERIOD OF STUDY- F...THE PRESENT SCENARIO IN THE LIFE INSURANCE SECTOR IN INDIA PERIOD OF STUDY- F...
THE PRESENT SCENARIO IN THE LIFE INSURANCE SECTOR IN INDIA PERIOD OF STUDY- F...Amit Dumka
 
Economic and policy implications of greater global integration OECD Economic ...
Economic and policy implications of greater global integration OECD Economic ...Economic and policy implications of greater global integration OECD Economic ...
Economic and policy implications of greater global integration OECD Economic ...OECD, Economics Department
 
World insurancereport 2015
World insurancereport 2015World insurancereport 2015
World insurancereport 2015Mark Dunne
 
World Insurance Report 2015 from Capgemini and Efma
World Insurance Report 2015 from Capgemini and EfmaWorld Insurance Report 2015 from Capgemini and Efma
World Insurance Report 2015 from Capgemini and EfmaCapgemini
 
Short-term momentum: will it be sustained? OECD Economic Outlook presentation...
Short-term momentum: will it be sustained? OECD Economic Outlook presentation...Short-term momentum: will it be sustained? OECD Economic Outlook presentation...
Short-term momentum: will it be sustained? OECD Economic Outlook presentation...OECD, Economics Department
 
OECD Economic Outlook - Christian Kastrop, OECD
OECD Economic Outlook - Christian Kastrop, OECDOECD Economic Outlook - Christian Kastrop, OECD
OECD Economic Outlook - Christian Kastrop, OECDOECD Governance
 
Life insurance market samy hazan-btg_pactual_meeting_04_2014
Life insurance market samy hazan-btg_pactual_meeting_04_2014Life insurance market samy hazan-btg_pactual_meeting_04_2014
Life insurance market samy hazan-btg_pactual_meeting_04_2014samyseg
 
Getting stronger but tensions are rising presentation OECD interim economic o...
Getting stronger but tensions are rising presentation OECD interim economic o...Getting stronger but tensions are rising presentation OECD interim economic o...
Getting stronger but tensions are rising presentation OECD interim economic o...OECD, Economics Department
 
OECD Economic Outlook June 2016 Policymakers: act now to keep promises!
OECD Economic Outlook June 2016 Policymakers: act now to keep promises!OECD Economic Outlook June 2016 Policymakers: act now to keep promises!
OECD Economic Outlook June 2016 Policymakers: act now to keep promises!OECD, Economics Department
 
Christian KASTROP: Economics and Policy Advice – A Farewell Seminar for Mr. A...
Christian KASTROP: Economics and Policy Advice – A Farewell Seminar for Mr. A...Christian KASTROP: Economics and Policy Advice – A Farewell Seminar for Mr. A...
Christian KASTROP: Economics and Policy Advice – A Farewell Seminar for Mr. A...Suomen Pankki
 
Insurance Providers Global Market Report 2018
Insurance Providers Global Market Report 2018Insurance Providers Global Market Report 2018
Insurance Providers Global Market Report 2018lakshmipraneethganti
 
Reinsurance in Portugal, Key Trends and Opportunities to 2016
Reinsurance in Portugal, Key Trends and Opportunities to 2016Reinsurance in Portugal, Key Trends and Opportunities to 2016
Reinsurance in Portugal, Key Trends and Opportunities to 2016ReportsnReports
 
Capital Markets Insights Winter 2018
Capital Markets Insights Winter 2018Capital Markets Insights Winter 2018
Capital Markets Insights Winter 2018Duff & Phelps
 
Global growth warning weak trade financial distortions OECD Interim Economic ...
Global growth warning weak trade financial distortions OECD Interim Economic ...Global growth warning weak trade financial distortions OECD Interim Economic ...
Global growth warning weak trade financial distortions OECD Interim Economic ...OECD, Economics Department
 

Similar to Insurance Markets in Figures 2017 (20)

Swiss Re sigma 3/2019: World insurance: the great pivot east continues
Swiss Re sigma 3/2019: World insurance: the great pivot east continuesSwiss Re sigma 3/2019: World insurance: the great pivot east continues
Swiss Re sigma 3/2019: World insurance: the great pivot east continues
 
Vietnam Insurance Market Report 2018
Vietnam Insurance Market Report 2018 Vietnam Insurance Market Report 2018
Vietnam Insurance Market Report 2018
 
Global insurance market trends 2020
Global insurance market trends 2020Global insurance market trends 2020
Global insurance market trends 2020
 
Will risks-derail-the-modest-recovery-oecd-interim-economic-outlook-march-2017
Will risks-derail-the-modest-recovery-oecd-interim-economic-outlook-march-2017Will risks-derail-the-modest-recovery-oecd-interim-economic-outlook-march-2017
Will risks-derail-the-modest-recovery-oecd-interim-economic-outlook-march-2017
 
Medef - La France peut-elle retrouver le chemin d'une croissance forte ?
Medef  - La France peut-elle retrouver le chemin d'une croissance forte ?Medef  - La France peut-elle retrouver le chemin d'une croissance forte ?
Medef - La France peut-elle retrouver le chemin d'une croissance forte ?
 
OECD-Wirtschaftsausblick November 2017
OECD-Wirtschaftsausblick November 2017OECD-Wirtschaftsausblick November 2017
OECD-Wirtschaftsausblick November 2017
 
THE PRESENT SCENARIO IN THE LIFE INSURANCE SECTOR IN INDIA PERIOD OF STUDY- F...
THE PRESENT SCENARIO IN THE LIFE INSURANCE SECTOR IN INDIA PERIOD OF STUDY- F...THE PRESENT SCENARIO IN THE LIFE INSURANCE SECTOR IN INDIA PERIOD OF STUDY- F...
THE PRESENT SCENARIO IN THE LIFE INSURANCE SECTOR IN INDIA PERIOD OF STUDY- F...
 
Economic and policy implications of greater global integration OECD Economic ...
Economic and policy implications of greater global integration OECD Economic ...Economic and policy implications of greater global integration OECD Economic ...
Economic and policy implications of greater global integration OECD Economic ...
 
World insurancereport 2015
World insurancereport 2015World insurancereport 2015
World insurancereport 2015
 
World Insurance Report 2015 from Capgemini and Efma
World Insurance Report 2015 from Capgemini and EfmaWorld Insurance Report 2015 from Capgemini and Efma
World Insurance Report 2015 from Capgemini and Efma
 
Short-term momentum: will it be sustained? OECD Economic Outlook presentation...
Short-term momentum: will it be sustained? OECD Economic Outlook presentation...Short-term momentum: will it be sustained? OECD Economic Outlook presentation...
Short-term momentum: will it be sustained? OECD Economic Outlook presentation...
 
OECD Economic Outlook - Christian Kastrop, OECD
OECD Economic Outlook - Christian Kastrop, OECDOECD Economic Outlook - Christian Kastrop, OECD
OECD Economic Outlook - Christian Kastrop, OECD
 
Life insurance market samy hazan-btg_pactual_meeting_04_2014
Life insurance market samy hazan-btg_pactual_meeting_04_2014Life insurance market samy hazan-btg_pactual_meeting_04_2014
Life insurance market samy hazan-btg_pactual_meeting_04_2014
 
Getting stronger but tensions are rising presentation OECD interim economic o...
Getting stronger but tensions are rising presentation OECD interim economic o...Getting stronger but tensions are rising presentation OECD interim economic o...
Getting stronger but tensions are rising presentation OECD interim economic o...
 
OECD Economic Outlook June 2016 Policymakers: act now to keep promises!
OECD Economic Outlook June 2016 Policymakers: act now to keep promises!OECD Economic Outlook June 2016 Policymakers: act now to keep promises!
OECD Economic Outlook June 2016 Policymakers: act now to keep promises!
 
Christian KASTROP: Economics and Policy Advice – A Farewell Seminar for Mr. A...
Christian KASTROP: Economics and Policy Advice – A Farewell Seminar for Mr. A...Christian KASTROP: Economics and Policy Advice – A Farewell Seminar for Mr. A...
Christian KASTROP: Economics and Policy Advice – A Farewell Seminar for Mr. A...
 
Insurance Providers Global Market Report 2018
Insurance Providers Global Market Report 2018Insurance Providers Global Market Report 2018
Insurance Providers Global Market Report 2018
 
Reinsurance in Portugal, Key Trends and Opportunities to 2016
Reinsurance in Portugal, Key Trends and Opportunities to 2016Reinsurance in Portugal, Key Trends and Opportunities to 2016
Reinsurance in Portugal, Key Trends and Opportunities to 2016
 
Capital Markets Insights Winter 2018
Capital Markets Insights Winter 2018Capital Markets Insights Winter 2018
Capital Markets Insights Winter 2018
 
Global growth warning weak trade financial distortions OECD Interim Economic ...
Global growth warning weak trade financial distortions OECD Interim Economic ...Global growth warning weak trade financial distortions OECD Interim Economic ...
Global growth warning weak trade financial distortions OECD Interim Economic ...
 

More from Δρ. Γιώργος K. Κασάπης

Promise and peril: How artificial intelligence is transforming health care
Promise and peril: How artificial intelligence is transforming health carePromise and peril: How artificial intelligence is transforming health care
Promise and peril: How artificial intelligence is transforming health careΔρ. Γιώργος K. Κασάπης
 
What North America’s top finance executives are thinking - and doing
What North America’s top finance  executives are thinking - and doingWhat North America’s top finance  executives are thinking - and doing
What North America’s top finance executives are thinking - and doingΔρ. Γιώργος K. Κασάπης
 
Prescription drug prices in U.S. more than 2.5 times higher than in other cou...
Prescription drug prices in U.S. more than 2.5 times higher than in other cou...Prescription drug prices in U.S. more than 2.5 times higher than in other cou...
Prescription drug prices in U.S. more than 2.5 times higher than in other cou...Δρ. Γιώργος K. Κασάπης
 
‘A circular nightmare’: Short-staffed nursing homes spark Covid-19 outbreaks,...
‘A circular nightmare’: Short-staffed nursing homes spark Covid-19 outbreaks,...‘A circular nightmare’: Short-staffed nursing homes spark Covid-19 outbreaks,...
‘A circular nightmare’: Short-staffed nursing homes spark Covid-19 outbreaks,...Δρ. Γιώργος K. Κασάπης
 

More from Δρ. Γιώργος K. Κασάπης (20)

The economics of climate change: no action not an option
The economics of climate change: no action not an optionThe economics of climate change: no action not an option
The economics of climate change: no action not an option
 
Promise and peril: How artificial intelligence is transforming health care
Promise and peril: How artificial intelligence is transforming health carePromise and peril: How artificial intelligence is transforming health care
Promise and peril: How artificial intelligence is transforming health care
 
Amnesty International: Death sentences and executions 2020
Amnesty International: Death sentences and executions 2020 Amnesty International: Death sentences and executions 2020
Amnesty International: Death sentences and executions 2020
 
Aviva: How we live
Aviva: How we liveAviva: How we live
Aviva: How we live
 
Policyholder behavior to close the protection gap
Policyholder behavior to close the protection gap Policyholder behavior to close the protection gap
Policyholder behavior to close the protection gap
 
Regulatory Considerations for Digital Insurance Business Models
Regulatory Considerations for Digital Insurance Business ModelsRegulatory Considerations for Digital Insurance Business Models
Regulatory Considerations for Digital Insurance Business Models
 
Interner of Things Iinsurance gateway
Interner of Things Iinsurance gateway Interner of Things Iinsurance gateway
Interner of Things Iinsurance gateway
 
Transpareny international 2021 report: paying for views
Transpareny international 2021 report: paying for views Transpareny international 2021 report: paying for views
Transpareny international 2021 report: paying for views
 
2020 IIS global concerns report
2020 IIS global concerns report2020 IIS global concerns report
2020 IIS global concerns report
 
What North America’s top finance executives are thinking - and doing
What North America’s top finance  executives are thinking - and doingWhat North America’s top finance  executives are thinking - and doing
What North America’s top finance executives are thinking - and doing
 
/freedom in thw World 2020
/freedom in thw World 2020/freedom in thw World 2020
/freedom in thw World 2020
 
Women, Business and the Law 2021
Women, Business and the Law 2021Women, Business and the Law 2021
Women, Business and the Law 2021
 
Long-erm Care and Health Care Insurance in OECD and Other Countries
Long-erm Care and Health Care Insurance in OECD and Other CountriesLong-erm Care and Health Care Insurance in OECD and Other Countries
Long-erm Care and Health Care Insurance in OECD and Other Countries
 
OECD: Artificial Intelligence's impact on the labour market
OECD: Artificial Intelligence's impact on the labour marketOECD: Artificial Intelligence's impact on the labour market
OECD: Artificial Intelligence's impact on the labour market
 
What happened to jobs at high risk of automation?
What happened to jobs at high risk of automation?What happened to jobs at high risk of automation?
What happened to jobs at high risk of automation?
 
Prescription drug prices in U.S. more than 2.5 times higher than in other cou...
Prescription drug prices in U.S. more than 2.5 times higher than in other cou...Prescription drug prices in U.S. more than 2.5 times higher than in other cou...
Prescription drug prices in U.S. more than 2.5 times higher than in other cou...
 
‘A circular nightmare’: Short-staffed nursing homes spark Covid-19 outbreaks,...
‘A circular nightmare’: Short-staffed nursing homes spark Covid-19 outbreaks,...‘A circular nightmare’: Short-staffed nursing homes spark Covid-19 outbreaks,...
‘A circular nightmare’: Short-staffed nursing homes spark Covid-19 outbreaks,...
 
Helping people stay in their homes tied to fewer Covid-19 cases
Helping people stay in their homes tied to fewer Covid-19 casesHelping people stay in their homes tied to fewer Covid-19 cases
Helping people stay in their homes tied to fewer Covid-19 cases
 
AGCS: Allianz Risk Barometer 2021
AGCS: Allianz Risk Barometer 2021AGCS: Allianz Risk Barometer 2021
AGCS: Allianz Risk Barometer 2021
 
OECD: The role of online platforms during the COVID-19 crisis
OECD: The role of online platforms during the COVID-19 crisisOECD: The role of online platforms during the COVID-19 crisis
OECD: The role of online platforms during the COVID-19 crisis
 

Recently uploaded

一比一原版(UofM毕业证)明尼苏达大学毕业证成绩单
一比一原版(UofM毕业证)明尼苏达大学毕业证成绩单一比一原版(UofM毕业证)明尼苏达大学毕业证成绩单
一比一原版(UofM毕业证)明尼苏达大学毕业证成绩单ewymefz
 
Innovative Methods in Media and Communication Research by Sebastian Kubitschk...
Innovative Methods in Media and Communication Research by Sebastian Kubitschk...Innovative Methods in Media and Communication Research by Sebastian Kubitschk...
Innovative Methods in Media and Communication Research by Sebastian Kubitschk...correoyaya
 
Computer Presentation.pptx ecommerce advantage s
Computer Presentation.pptx ecommerce advantage sComputer Presentation.pptx ecommerce advantage s
Computer Presentation.pptx ecommerce advantage sMAQIB18
 
Criminal IP - Threat Hunting Webinar.pdf
Criminal IP - Threat Hunting Webinar.pdfCriminal IP - Threat Hunting Webinar.pdf
Criminal IP - Threat Hunting Webinar.pdfCriminal IP
 
一比一原版(QU毕业证)皇后大学毕业证成绩单
一比一原版(QU毕业证)皇后大学毕业证成绩单一比一原版(QU毕业证)皇后大学毕业证成绩单
一比一原版(QU毕业证)皇后大学毕业证成绩单enxupq
 
Professional Data Engineer Certification Exam Guide  _  Learn  _  Google Clou...
Professional Data Engineer Certification Exam Guide  _  Learn  _  Google Clou...Professional Data Engineer Certification Exam Guide  _  Learn  _  Google Clou...
Professional Data Engineer Certification Exam Guide  _  Learn  _  Google Clou...Domenico Conte
 
一比一原版(UPenn毕业证)宾夕法尼亚大学毕业证成绩单
一比一原版(UPenn毕业证)宾夕法尼亚大学毕业证成绩单一比一原版(UPenn毕业证)宾夕法尼亚大学毕业证成绩单
一比一原版(UPenn毕业证)宾夕法尼亚大学毕业证成绩单ewymefz
 
Tabula.io Cheatsheet: automate your data workflows
Tabula.io Cheatsheet: automate your data workflowsTabula.io Cheatsheet: automate your data workflows
Tabula.io Cheatsheet: automate your data workflowsalex933524
 
一比一原版(CU毕业证)卡尔顿大学毕业证成绩单
一比一原版(CU毕业证)卡尔顿大学毕业证成绩单一比一原版(CU毕业证)卡尔顿大学毕业证成绩单
一比一原版(CU毕业证)卡尔顿大学毕业证成绩单yhkoc
 
社内勉強会資料_LLM Agents                              .
社内勉強会資料_LLM Agents                              .社内勉強会資料_LLM Agents                              .
社内勉強会資料_LLM Agents                              .NABLAS株式会社
 
Criminal IP - Threat Hunting Webinar.pdf
Criminal IP - Threat Hunting Webinar.pdfCriminal IP - Threat Hunting Webinar.pdf
Criminal IP - Threat Hunting Webinar.pdfCriminal IP
 
standardisation of garbhpala offhgfffghh
standardisation of garbhpala offhgfffghhstandardisation of garbhpala offhgfffghh
standardisation of garbhpala offhgfffghhArpitMalhotra16
 
一比一原版(TWU毕业证)西三一大学毕业证成绩单
一比一原版(TWU毕业证)西三一大学毕业证成绩单一比一原版(TWU毕业证)西三一大学毕业证成绩单
一比一原版(TWU毕业证)西三一大学毕业证成绩单ocavb
 
tapal brand analysis PPT slide for comptetive data
tapal brand analysis PPT slide for comptetive datatapal brand analysis PPT slide for comptetive data
tapal brand analysis PPT slide for comptetive datatheahmadsaood
 
How can I successfully sell my pi coins in Philippines?
How can I successfully sell my pi coins in Philippines?How can I successfully sell my pi coins in Philippines?
How can I successfully sell my pi coins in Philippines?DOT TECH
 
Webinar One View, Multiple Systems No-Code Integration of Salesforce and ERPs
Webinar One View, Multiple Systems No-Code Integration of Salesforce and ERPsWebinar One View, Multiple Systems No-Code Integration of Salesforce and ERPs
Webinar One View, Multiple Systems No-Code Integration of Salesforce and ERPsCEPTES Software Inc
 
Business update Q1 2024 Lar España Real Estate SOCIMI
Business update Q1 2024 Lar España Real Estate SOCIMIBusiness update Q1 2024 Lar España Real Estate SOCIMI
Business update Q1 2024 Lar España Real Estate SOCIMIAlejandraGmez176757
 
2024-05-14 - Tableau User Group - TC24 Hot Topics - Tableau Pulse and Einstei...
2024-05-14 - Tableau User Group - TC24 Hot Topics - Tableau Pulse and Einstei...2024-05-14 - Tableau User Group - TC24 Hot Topics - Tableau Pulse and Einstei...
2024-05-14 - Tableau User Group - TC24 Hot Topics - Tableau Pulse and Einstei...elinavihriala
 
Empowering Data Analytics Ecosystem.pptx
Empowering Data Analytics Ecosystem.pptxEmpowering Data Analytics Ecosystem.pptx
Empowering Data Analytics Ecosystem.pptxbenishzehra469
 
一比一原版(NYU毕业证)纽约大学毕业证成绩单
一比一原版(NYU毕业证)纽约大学毕业证成绩单一比一原版(NYU毕业证)纽约大学毕业证成绩单
一比一原版(NYU毕业证)纽约大学毕业证成绩单ewymefz
 

Recently uploaded (20)

一比一原版(UofM毕业证)明尼苏达大学毕业证成绩单
一比一原版(UofM毕业证)明尼苏达大学毕业证成绩单一比一原版(UofM毕业证)明尼苏达大学毕业证成绩单
一比一原版(UofM毕业证)明尼苏达大学毕业证成绩单
 
Innovative Methods in Media and Communication Research by Sebastian Kubitschk...
Innovative Methods in Media and Communication Research by Sebastian Kubitschk...Innovative Methods in Media and Communication Research by Sebastian Kubitschk...
Innovative Methods in Media and Communication Research by Sebastian Kubitschk...
 
Computer Presentation.pptx ecommerce advantage s
Computer Presentation.pptx ecommerce advantage sComputer Presentation.pptx ecommerce advantage s
Computer Presentation.pptx ecommerce advantage s
 
Criminal IP - Threat Hunting Webinar.pdf
Criminal IP - Threat Hunting Webinar.pdfCriminal IP - Threat Hunting Webinar.pdf
Criminal IP - Threat Hunting Webinar.pdf
 
一比一原版(QU毕业证)皇后大学毕业证成绩单
一比一原版(QU毕业证)皇后大学毕业证成绩单一比一原版(QU毕业证)皇后大学毕业证成绩单
一比一原版(QU毕业证)皇后大学毕业证成绩单
 
Professional Data Engineer Certification Exam Guide  _  Learn  _  Google Clou...
Professional Data Engineer Certification Exam Guide  _  Learn  _  Google Clou...Professional Data Engineer Certification Exam Guide  _  Learn  _  Google Clou...
Professional Data Engineer Certification Exam Guide  _  Learn  _  Google Clou...
 
一比一原版(UPenn毕业证)宾夕法尼亚大学毕业证成绩单
一比一原版(UPenn毕业证)宾夕法尼亚大学毕业证成绩单一比一原版(UPenn毕业证)宾夕法尼亚大学毕业证成绩单
一比一原版(UPenn毕业证)宾夕法尼亚大学毕业证成绩单
 
Tabula.io Cheatsheet: automate your data workflows
Tabula.io Cheatsheet: automate your data workflowsTabula.io Cheatsheet: automate your data workflows
Tabula.io Cheatsheet: automate your data workflows
 
一比一原版(CU毕业证)卡尔顿大学毕业证成绩单
一比一原版(CU毕业证)卡尔顿大学毕业证成绩单一比一原版(CU毕业证)卡尔顿大学毕业证成绩单
一比一原版(CU毕业证)卡尔顿大学毕业证成绩单
 
社内勉強会資料_LLM Agents                              .
社内勉強会資料_LLM Agents                              .社内勉強会資料_LLM Agents                              .
社内勉強会資料_LLM Agents                              .
 
Criminal IP - Threat Hunting Webinar.pdf
Criminal IP - Threat Hunting Webinar.pdfCriminal IP - Threat Hunting Webinar.pdf
Criminal IP - Threat Hunting Webinar.pdf
 
standardisation of garbhpala offhgfffghh
standardisation of garbhpala offhgfffghhstandardisation of garbhpala offhgfffghh
standardisation of garbhpala offhgfffghh
 
一比一原版(TWU毕业证)西三一大学毕业证成绩单
一比一原版(TWU毕业证)西三一大学毕业证成绩单一比一原版(TWU毕业证)西三一大学毕业证成绩单
一比一原版(TWU毕业证)西三一大学毕业证成绩单
 
tapal brand analysis PPT slide for comptetive data
tapal brand analysis PPT slide for comptetive datatapal brand analysis PPT slide for comptetive data
tapal brand analysis PPT slide for comptetive data
 
How can I successfully sell my pi coins in Philippines?
How can I successfully sell my pi coins in Philippines?How can I successfully sell my pi coins in Philippines?
How can I successfully sell my pi coins in Philippines?
 
Webinar One View, Multiple Systems No-Code Integration of Salesforce and ERPs
Webinar One View, Multiple Systems No-Code Integration of Salesforce and ERPsWebinar One View, Multiple Systems No-Code Integration of Salesforce and ERPs
Webinar One View, Multiple Systems No-Code Integration of Salesforce and ERPs
 
Business update Q1 2024 Lar España Real Estate SOCIMI
Business update Q1 2024 Lar España Real Estate SOCIMIBusiness update Q1 2024 Lar España Real Estate SOCIMI
Business update Q1 2024 Lar España Real Estate SOCIMI
 
2024-05-14 - Tableau User Group - TC24 Hot Topics - Tableau Pulse and Einstei...
2024-05-14 - Tableau User Group - TC24 Hot Topics - Tableau Pulse and Einstei...2024-05-14 - Tableau User Group - TC24 Hot Topics - Tableau Pulse and Einstei...
2024-05-14 - Tableau User Group - TC24 Hot Topics - Tableau Pulse and Einstei...
 
Empowering Data Analytics Ecosystem.pptx
Empowering Data Analytics Ecosystem.pptxEmpowering Data Analytics Ecosystem.pptx
Empowering Data Analytics Ecosystem.pptx
 
一比一原版(NYU毕业证)纽约大学毕业证成绩单
一比一原版(NYU毕业证)纽约大学毕业证成绩单一比一原版(NYU毕业证)纽约大学毕业证成绩单
一比一原版(NYU毕业证)纽约大学毕业证成绩单
 

Insurance Markets in Figures 2017

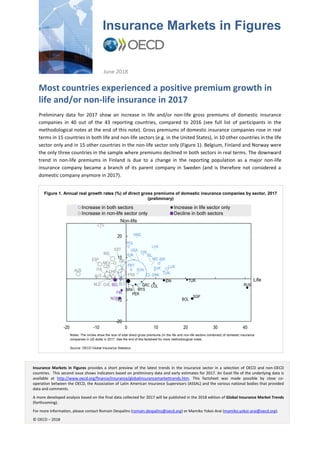
  • 1. June 2018 Most countries experienced a positive premium growth in life and/or non-life insurance in 2017 Preliminary data for 2017 show an increase in life and/or non-life gross premiums of domestic insurance companies in 40 out of the 43 reporting countries, compared to 2016 (see full list of participants in the methodological notes at the end of this note). Gross premiums of domestic insurance companies rose in real terms in 15 countries in both life and non-life sectors (e.g. in the United States), in 10 other countries in the life sector only and in 15 other countries in the non-life sector only (Figure 1). Belgium, Finland and Norway were the only three countries in the sample where premiums declined in both sectors in real terms. The downward trend in non-life premiums in Finland is due to a change in the reporting population as a major non-life insurance company became a branch of its parent company in Sweden (and is therefore not considered a domestic company anymore in 2017). Insurance Markets in Figures Insurance Markets in Figures provides a short preview of the latest trends in the insurance sector in a selection of OECD and non-OECD countries. This second issue shows indicators based on preliminary data and early estimates for 2017. An Excel file of the underlying data is available at http://www.oecd.org/finance/insurance/globalinsurancemarkettrends.htm. This factsheet was made possible by close co- operation between the OECD, the Association of Latin American Insurance Supervisors (ASSAL) and the various national bodies that provided data and comments. A more developed analysis based on the final data collected for 2017 will be published in the 2018 edition of Global Insurance Market Trends (forthcoming). For more information, please contact Romain Despalins (romain.despalins@oecd.org) or Mamiko Yokoi-Arai (mamiko.yokoi-arai@oecd.org). © OECD – 2018 Figure 1. Annual real growth rates (%) of direct gross premiums of domestic insurance companies by sector, 2017 (preliminary) Notes: The circles show the size of total direct gross premiums (in the life and non-life sectors combined) of domestic insurance companies in US dollar in 2017. See the end of this factsheet for more methodological notes. Source: OECD Global Insurance Statistics. POL PRT USA HUN HND SVN CRI DNK ISL NIC SVK LVA ISR TUN LUX BRA PER MYS GRC COL IDN TUR BOL SGP RUS AUS ESP LTU AUT CZE ITA NLD IND CHE CHL MEX EST SLV DEU FRA BEL NOR FIN -20 -10 0 10 20 -20 -10 0 10 20 30 40 Increase in both sectors Increase in life sector only Increase in non-life sector only Decline in both sectors Life Non-life
  • 2. INSURANCE MARKETS IN FIGURES Real growth rates of life premiums varied widely across countries. The largest increase occurred in Russia (40.7%), followed by Singapore (22.2%) and Bolivia (21.2%). Five additional countries experienced a real growth rate above 10%: Indonesia, Israel, Luxembourg, Tunisia and Turkey. By contrast, life gross premiums declined the most in Australia in 2017 (-16.1%), as a result of a fall in deposits for investment-linked products. Likewise, trends were diverse in the non-life sector. Lithuania recorded the strongest growth of non-life gross premiums in real terms in 2017 (24.1%), driven by prices of motor third-party liability policies rising. By contrast, non-life gross premiums decreased the most in Bolivia in 2017 among reporting countries (-9.8%). The largest amounts of premiums were recorded in France, Germany (USD 0.2 trillion each) and the United States (USD 2.8 trillion). However, the highest growth rates were achieved by countries with lower total premiums (e.g. Costa Rica, Honduras, Israel, Latvia). Diverse trends in claims payments in 2017 Insurers engaged in life insurance activities paid more claims in 2017 than in 2016 in 28 out of the 42 reporting countries (Figure 2). The largest increase in gross claims payments in the life sector occurred in two European countries: Lithuania (33.4%) and Latvia (29.5%). In both countries, this trend may be attributed to the expiration of insurance contracts (e.g. expiration of 15-year contracts concluded in 2002 in Lithuania). Conversely, two other European countries experienced the largest decline in gross claims payments: Portugal (-33.8%) and Germany (-17.9%). In Germany, life insurance policies that were contracted in 2004, as a result of the Retirement Income Act, usually had a 12-year maturity, to be acceptable for tax purposes, and expired in 2016, leading to larger amount of claims paid that year. The trend observed in Portugal may partly be due to a decline in surrenders. Figure 2. Annual real growth rates (%) of direct gross claims paid by domestic insurance companies by sector, 2017 (preliminary) CHE SVK ESP ISL PER HND EST MEX HUN FRA POL ITA SVN ISR NLD LVA LTU MYS NOR BOL TUN SGP COL RUS CHL CRI LUX IDN PRT DEU USA AUT CZE IND GRC DNK NIC TUR BEL SLVFIN BRA -40 -20 0 20 40 60 80 -40 -30 -20 -10 0 10 20 30 40 Increase in both sectors Increase in life sector only Increase in non-life sector only Decline in both sectors Life Non-life Notes: The circles show the size of total direct gross claims paid (in the life and non-life sectors combined) by domestic insurance companies in US dollar in 2017. The larger the circle, the larger the amount of direct gross claims paid in the reporting country. The size of the circles in this chart is not comparable with the circles in Figure 1. See the end of this factsheet for more methodological notes. Source: OECD Global Insurance Statistics.
  • 3. INSURANCE MARKETS IN FIGURES Almost two thirds of the reporting countries recorded an increase in gross claims paid in the non-life sector. This increase was the largest in Peru (over 85%), as a result of heavy rains and floods in 2017. Claims payments increased by more than 20% in real terms in 2017 in three additional countries: Honduras, Lithuania and Nicaragua. In 23 other reporting countries, gross claims payments increased, but by less than 10%. In 15 countries, claims payments declined in real terms, especially in Bolivia (-26.0%) and Luxembourg (-21.3%). The United States was the country with the largest amount of gross claims paid in 2017 (USD 1.6 trillion, all sectors combined). Bills and bonds represented the largest proportion of investments of insurers Bills and bonds accounted for more than half of the investments of insurance companies in 34 out of the 42 reporting countries in 2017 (Figure 3). They exceeded 80% of the investments in Brazil (83.5%), Hungary (82.2%), Mexico (82.0%) and Greece (81.1%). Insurers in a few countries have however favoured investments in equities, such as in Denmark and Indonesia where equities represented 40.8% and 29.8% of investments respectively (compared to 34.5% and 20.7% for bills and bonds respectively). Figure 3. Asset allocation of domestic insurance companies (all sectors), 2017 (preliminary) As a percentage of total investment 0 20 40 60 80 100 Brazil Hungary Mexico Greece Czech Republic Colombia Nicaragua Spain Portugal El Salvador Estonia Lithuania Norway Belgium India Italy Costa Rica Peru Poland Slovenia Latvia Australia Bolivia France United States Israel Austria Chile Germany Singapore Tunisia Malaysia Netherlands Switzerland Iceland Finland Luxembourg Denmark Russia United Kingdom Honduras Indonesia Bills and bonds Equity Cash and deposits CIS (when look-through unavailable) Others Notes: See the end of this factsheet for methodological notes. Source: OECD Global Insurance Statistics.
  • 4. INSURANCE MARKETS IN FIGURES Positive real investment rates of return in 2017 in most reporting countries Insurers experienced positive real positive investment rates of return in 2017 - irrespective of whether they engaged in life insurance activities only (i.e. life insurers), non-life insurance only (i.e. non-life insurers) or both (i.e. composite companies) – in 13 out of the 19 reporting countries (Figure 4). Life insurers in Malaysia achieved the highest real investment rate of return (17.8%) thanks to the strong performance of the Malaysian equity market in 2017. By contrast, all types of insurer failed to achieve positive real returns in Lithuania (where the share of investments in equities is relatively low) and in Russia. Figure 4. Average annual real net investment return by type of domestic insurer in 2017 (preliminary) (%) Notes: See the end of this factsheet for methodological notes. Source: OECD Global Insurance Statistics. -5 0 5 10 15 20 Life Non-Life Composite
  • 5. INSURANCE MARKETS IN FIGURES METHODOLOGICAL NOTES TO BE TAKEN INTO CONSIDERATION WHEN INTERPRETING THE DATA General: Data are collected within the framework of the OECD Global Insurance Statistics (GIS) project. Data in this note are preliminary and may be revised in the 2018 edition of the report Global Insurance Market Trends (forthcoming). This note focuses mainly on the direct insurance business of domestically incorporated undertakings (i.e. incorporated under national law) in reporting countries, and includes data for the following participating countries among: ● OECD Members: Australia, Austria, Belgium, Chile, Czech Republic, Denmark, Estonia, Finland, France, Germany, Greece, Hungary, Iceland, Israel, Italy, Latvia, Luxembourg, Mexico, Netherlands, Norway, Poland, Portugal, Slovak Republic, Slovenia, Spain, Switzerland, Turkey, United Kingdom, United States; ● ASSAL (non-OECD) Members: Bolivia, Brazil, Colombia, Costa Rica, El Salvador, Honduras, Nicaragua, Peru; ● Other countries: India, Indonesia, Lithuania, Malaysia, Russia, Singapore and Tunisia. Insurance companies may carry out life insurance activities only (i.e. life insurers), non-life insurance activities (i.e. non- life insurers) or both (i.e. composite insurers). In some countries, some insurance companies that are considered as life insurers (respectively non-life insurers) can carry out some specific non-life (respectively life) activities on an ancillary basis. Data for Estonia include business abroad from branches of Estonian insurance companies. Data for Iceland do not cover the State Natural Catastrophe insurance undertaking. Data for Indonesia cover conventional and sharia insurance. Data on premiums, claims and investment performance for Lithuania are based on IFRS while data on asset allocation follow the Solvency II reporting template. Data for Lithuania include business abroad. Data for Luxembourg exclude marine insurers but include business abroad from branches of Luxembourg companies. Data for Malaysia cover both traditional insurance and Takaful insurance. Data for Mexico cover insurance and surety institutions. Data for the Netherlands include basic health insurance. For some countries, data cover insurance companies subject to Solvency II quarterly reporting requirements and exclude the smallest insurance companies (e.g. France, the Netherlands). Data for the Netherlands also exclude one insurance undertaking with the end of financial year in April. Countries in some charts are labelled with their ISO code. ISO codes are available on the United Nation Statistics Division internet page at the following address: http://unstats.un.org/unsd/methods/m49/m49alpha.htm. Figure 1: Life premiums for Belgium include some elements that are reported as non-life insurance in the statutory accounts (e.g. health). Calculations of growth rates do not take into account composite companies for El Salvador. Annual growth rates for India, Israel and Spain are OECD estimates based on the amount of premiums reported for the period April - Dec 2017 for India, and Jan - Sept 2017 for Israel and Spain. Figure 2: Australia recorded a high level of claims in the life sector in 2016 due to a transfer of insurance policies from the Universal Super Scheme to the MLC Super Fund, distorting the trend between 2016 and 2017 (not shown in the chart). Real gross claims paid in the non-life sector in Australia increased by 5.7% in 2017. The overall amount of gross claims paid in Australia in 2017 (life and non-life insurance combined) was worth USD 54,253 million. Calculations of growth rates do not take into account composite companies for El Salvador. Data for Estonia and Greece refer to growth rates of claims incurred. Annual growth rates for India, Israel and Spain are OECD estimates based on the amount of gross claims paid reported for the period April - Dec 2017 for India, and Jan - Sept 2017 for Israel and Spain. Figure 3: Data refer to end-2017 for all countries, except Spain (end Q3 2017). The GIS database gathers information on investments of insurance companies in collective investment schemes (CIS) and the look-through of these investments in equities, bills and bonds, cash and deposits and other. Data on asset allocation in this figure show both direct investments of insurance companies in equities, bills and bonds and cash and deposits, and their indirect investments in these categories through CIS when the look-through of CIS investments is available. When the look-through is not available, investments by insurance companies in CIS are shown in a separate category and data in the figure for the countries in this case only show direct investments of insurance companies in equities, bills and bonds and cash and deposits. Investments of insurance companies related to unit-linked products are excluded from the calculations of the asset allocation, except for Indonesia and the United Kingdom where they are combined with investments from non- unit-linked insurance in the main investment categories. The category “equity” includes holdings in related undertakings for the Czech Republic. Data for Germany are estimates; the breakdown of investments of insurance companies through CIS has not been approved by external auditors. The category “equity” includes investments in shares of subsidiary companies for Peru. Figure 4: Average annual real net investment rates of return are calculated based on the nominal annual net investment rates of return reported by countries for the period Dec 2016 - Dec 2017 and the variation of the consumer price index over the same period. This work is published under the responsibility of the Secretary-General of the OECD. The opinions expressed and arguments employed herein do not necessarily reflect the official views of the OECD or the governments of its member countries. This document and any map included herein are without prejudice to the status of or sovereignty over any territory, to the delimitation of international frontiers and boundaries and to the name of any territory, city or area. The statistical data for Israel are supplied by and under the responsibility of the relevant Israeli authorities. The use of such data by the OECD is without prejudice to the status of the Golan Heights, East Jerusalem and Israeli settlements in the West Bank under the terms of international law.