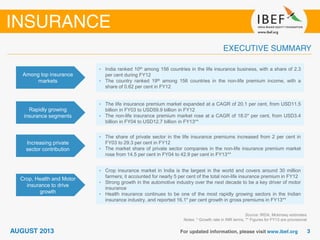
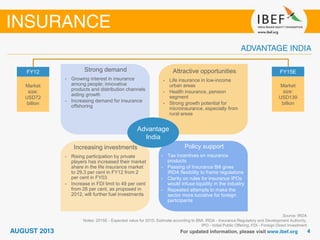
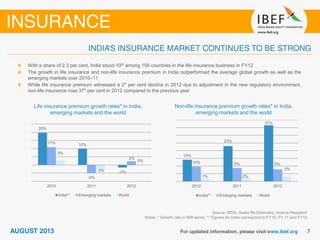
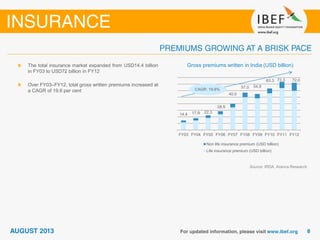
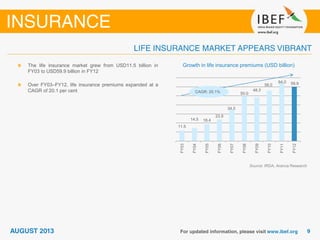
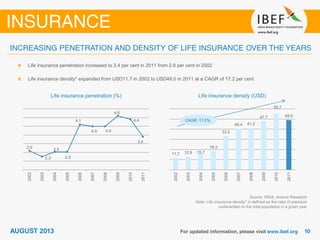
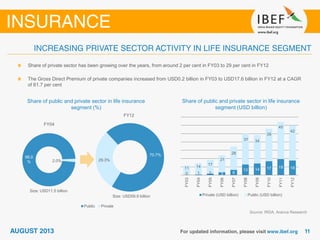
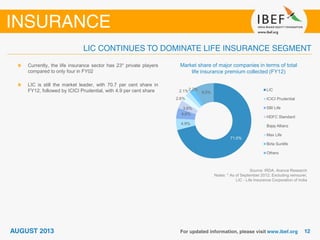
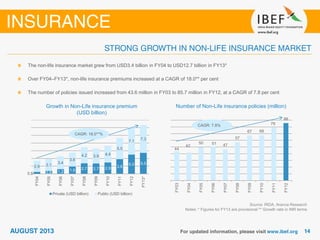
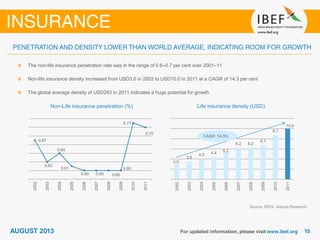
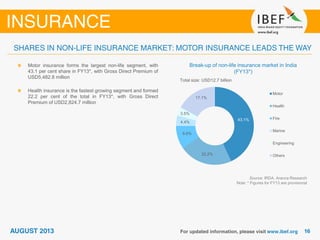
The insurance industry in India has grown rapidly in recent years. Life insurance premiums grew at a CAGR of 20.1% from 2003-2012, while non-life premiums increased at 18%. Private sector participation also increased substantially over this period. Key growth areas for the insurance industry include health, motor, and crop insurance. The government has introduced several policies to support the development of the insurance industry in India.
For full text artical go to: http://www.educorporatebridge.com/insurance/insurance-sector-in-india/Insurance sector in India is considered as a huge market due to its momentous untapped potential. This sector is said to improve the standard of living of the people in an economy as it leads to risk free lives, promotes entrepreneurship, mobilizes savings and leads to protection of trade and industry which contributes in human progress.
Insurance, Sector History, FDI in Insurance, Government Role in Insurance, Industry Growth Pattern, Challenges of Insurance Market, Foreign Direct Investment in Insurance
The Report is a brief overview of Healthcare Insurance Market in India. It covers Market Size and Forecasts, Competitive Structure, Growth Analysis, Impact Analysis and Recommendations.
Indian Insurance Industry - Key Issues and Challenges - Part - 2Resurgent India
While a range of economic and financial reforms have helped the insurance sector grow, there remains a host of challenges which need to be addressed for harnessing the full potential of the sector:
Easy Ways to Segment Your Customers and Create Actionsimagine.GO
Health care reform created millions of new health care shoppers. Many of whom visited your website for the first time. You've did the work to support the new health care consumer on your site, but did you converting visitors into shoppers, and shoppers into repeated customers? You can find the deck associated with this presentation here.
During this session we discussed:
1. How do you create and execute an effective segmentation strategy for health insurance shoppers?
2. Why Segment?
3. What Models?
4. What Methods?
5. What Results?
6. What Next?
Indian Insurance Industry: Reaching out to Exponential Growth Resurgent India
From Insurance being seen as a basic protection instrument against expected losses, the Indian Insurance industry has surely come a long way to become an absolute critical driver of economic prosperity and growth. The sector has helped account for risks; provide funds for capital intensive national building efforts besides lending social security to the citizens. Over a period of decade and a half, the industry has witnessed phases of spurt growth and moderation, intensifying competition and expansion of customer and geographic coverage.
Even tho Pi network is not listed on any exchange yet.
Buying/Selling or investing in pi network coins is highly possible through the help of vendors. You can buy from vendors[ buy directly from the pi network miners and resell it]. I will leave the telegram contact of my personal vendor.
@Pi_vendor_247
how can I sell my pi coins for cash in a pi APPDOT TECH
You can't sell your pi coins in the pi network app. because it is not listed yet on any exchange.
The only way you can sell is by trading your pi coins with an investor (a person looking forward to hold massive amounts of pi coins before mainnet launch) .
You don't need to meet the investor directly all the trades are done with a pi vendor/merchant (a person that buys the pi coins from miners and resell it to investors)
I Will leave The telegram contact of my personal pi vendor, if you are finding a legitimate one.
@Pi_vendor_247
#pi network
#pi coins
#money
Introduction to Indian Financial System ()Avanish Goel
The financial system of a country is an important tool for economic development of the country, as it helps in creation of wealth by linking savings with investments.
It facilitates the flow of funds form the households (savers) to business firms (investors) to aid in wealth creation and development of both the parties
Poonawalla Fincorp and IndusInd Bank Introduce New Co-Branded Credit Cardnickysharmasucks
The unveiling of the IndusInd Bank Poonawalla Fincorp eLITE RuPay Platinum Credit Card marks a notable milestone in the Indian financial landscape, showcasing a successful partnership between two leading institutions, Poonawalla Fincorp and IndusInd Bank. This co-branded credit card not only offers users a plethora of benefits but also reflects a commitment to innovation and adaptation. With a focus on providing value-driven and customer-centric solutions, this launch represents more than just a new product—it signifies a step towards redefining the banking experience for millions. Promising convenience, rewards, and a touch of luxury in everyday financial transactions, this collaboration aims to cater to the evolving needs of customers and set new standards in the industry.
how to sell pi coins in all Africa Countries.DOT TECH
Yes. You can sell your pi network for other cryptocurrencies like Bitcoin, usdt , Ethereum and other currencies And this is done easily with the help from a pi merchant.
What is a pi merchant ?
Since pi is not launched yet in any exchange. The only way you can sell right now is through merchants.
A verified Pi merchant is someone who buys pi network coins from miners and resell them to investors looking forward to hold massive quantities of pi coins before mainnet launch in 2026.
I will leave the telegram contact of my personal pi merchant to trade with.
@Pi_vendor_247
Latino Buying Power - May 2024 Presentation for Latino CaucusDanay Escanaverino
Unlock the potential of Latino Buying Power with this in-depth SlideShare presentation. Explore how the Latino consumer market is transforming the American economy, driven by their significant buying power, entrepreneurial contributions, and growing influence across various sectors.
**Key Sections Covered:**
1. **Economic Impact:** Understand the profound economic impact of Latino consumers on the U.S. economy. Discover how their increasing purchasing power is fueling growth in key industries and contributing to national economic prosperity.
2. **Buying Power:** Dive into detailed analyses of Latino buying power, including its growth trends, key drivers, and projections for the future. Learn how this influential group’s spending habits are shaping market dynamics and creating opportunities for businesses.
3. **Entrepreneurial Contributions:** Explore the entrepreneurial spirit within the Latino community. Examine how Latino-owned businesses are thriving and contributing to job creation, innovation, and economic diversification.
4. **Workforce Statistics:** Gain insights into the role of Latino workers in the American labor market. Review statistics on employment rates, occupational distribution, and the economic contributions of Latino professionals across various industries.
5. **Media Consumption:** Understand the media consumption habits of Latino audiences. Discover their preferences for digital platforms, television, radio, and social media. Learn how these consumption patterns are influencing advertising strategies and media content.
6. **Education:** Examine the educational achievements and challenges within the Latino community. Review statistics on enrollment, graduation rates, and fields of study. Understand the implications of education on economic mobility and workforce readiness.
7. **Home Ownership:** Explore trends in Latino home ownership. Understand the factors driving home buying decisions, the challenges faced by Latino homeowners, and the impact of home ownership on community stability and economic growth.
This SlideShare provides valuable insights for marketers, business owners, policymakers, and anyone interested in the economic influence of the Latino community. By understanding the various facets of Latino buying power, you can effectively engage with this dynamic and growing market segment.
Equip yourself with the knowledge to leverage Latino buying power, tap into their entrepreneurial spirit, and connect with their unique cultural and consumer preferences. Drive your business success by embracing the economic potential of Latino consumers.
**Keywords:** Latino buying power, economic impact, entrepreneurial contributions, workforce statistics, media consumption, education, home ownership, Latino market, Hispanic buying power, Latino purchasing power.
Falcon stands out as a top-tier P2P Invoice Discounting platform in India, bridging esteemed blue-chip companies and eager investors. Our goal is to transform the investment landscape in India by establishing a comprehensive destination for borrowers and investors with diverse profiles and needs, all while minimizing risk. What sets Falcon apart is the elimination of intermediaries such as commercial banks and depository institutions, allowing investors to enjoy higher yields.
how to swap pi coins to foreign currency withdrawable.DOT TECH
As of my last update, Pi is still in the testing phase and is not tradable on any exchanges.
However, Pi Network has announced plans to launch its Testnet and Mainnet in the future, which may include listing Pi on exchanges.
The current method for selling pi coins involves exchanging them with a pi vendor who purchases pi coins for investment reasons.
If you want to sell your pi coins, reach out to a pi vendor and sell them to anyone looking to sell pi coins from any country around the globe.
Below is the contact information for my personal pi vendor.
Telegram: @Pi_vendor_247
Resume
• Real GDP growth slowed down due to problems with access to electricity caused by the destruction of manoeuvrable electricity generation by Russian drones and missiles.
• Exports and imports continued growing due to better logistics through the Ukrainian sea corridor and road. Polish farmers and drivers stopped blocking borders at the end of April.
• In April, both the Tax and Customs Services over-executed the revenue plan. Moreover, the NBU transferred twice the planned profit to the budget.
• The European side approved the Ukraine Plan, which the government adopted to determine indicators for the Ukraine Facility. That approval will allow Ukraine to receive a EUR 1.9 bn loan from the EU in May. At the same time, the EU provided Ukraine with a EUR 1.5 bn loan in April, as the government fulfilled five indicators under the Ukraine Plan.
• The USA has finally approved an aid package for Ukraine, which includes USD 7.8 bn of budget support; however, the conditions and timing of the assistance are still unknown.
• As in March, annual consumer inflation amounted to 3.2% yoy in April.
• At the April monetary policy meeting, the NBU again reduced the key policy rate from 14.5% to 13.5% per annum.
• Over the past four weeks, the hryvnia exchange rate has stabilized in the UAH 39-40 per USD range.
Falcon stands out as a top-tier P2P Invoice Discounting platform in India, bridging esteemed blue-chip companies and eager investors. Our goal is to transform the investment landscape in India by establishing a comprehensive destination for borrowers and investors with diverse profiles and needs, all while minimizing risk. What sets Falcon apart is the elimination of intermediaries such as commercial banks and depository institutions, allowing investors to enjoy higher yields.
Currently pi network is not tradable on binance or any other exchange because we are still in the enclosed mainnet.
Right now the only way to sell pi coins is by trading with a verified merchant.
What is a pi merchant?
A pi merchant is someone verified by pi network team and allowed to barter pi coins for goods and services.
Since pi network is not doing any pre-sale The only way exchanges like binance/huobi or crypto whales can get pi is by buying from miners. And a merchant stands in between the exchanges and the miners.
I will leave the telegram contact of my personal pi merchant. I and my friends has traded more than 6000pi coins successfully
Tele-gram
@Pi_vendor_247
What price will pi network be listed on exchangesDOT TECH
The rate at which pi will be listed is practically unknown. But due to speculations surrounding it the predicted rate is tends to be from 30$ — 50$.
So if you are interested in selling your pi network coins at a high rate tho. Or you can't wait till the mainnet launch in 2026. You can easily trade your pi coins with a merchant.
A merchant is someone who buys pi coins from miners and resell them to Investors looking forward to hold massive quantities till mainnet launch.
I will leave the telegram contact of my personal pi vendor to trade with.
@Pi_vendor_247
Turin Startup Ecosystem 2024 - Ricerca sulle Startup e il Sistema dell'Innov...Quotidiano Piemontese
Turin Startup Ecosystem 2024
Una ricerca de il Club degli Investitori, in collaborazione con ToTeM Torino Tech Map e con il supporto della ESCP Business School e di Growth Capital
The secret way to sell pi coins effortlessly.DOT TECH
Well as we all know pi isn't launched yet. But you can still sell your pi coins effortlessly because some whales in China are interested in holding massive pi coins. And they are willing to pay good money for it. If you are interested in selling I will leave a contact for you. Just telegram this number below. I sold about 3000 pi coins to him and he paid me immediately.
Telegram: @Pi_vendor_247
US Economic Outlook - Being Decided - M Capital Group August 2021.pdfpchutichetpong
The U.S. economy is continuing its impressive recovery from the COVID-19 pandemic and not slowing down despite re-occurring bumps. The U.S. savings rate reached its highest ever recorded level at 34% in April 2020 and Americans seem ready to spend. The sectors that had been hurt the most by the pandemic specifically reduced consumer spending, like retail, leisure, hospitality, and travel, are now experiencing massive growth in revenue and job openings.
Could this growth lead to a “Roaring Twenties”? As quickly as the U.S. economy contracted, experiencing a 9.1% drop in economic output relative to the business cycle in Q2 2020, the largest in recorded history, it has rebounded beyond expectations. This surprising growth seems to be fueled by the U.S. government’s aggressive fiscal and monetary policies, and an increase in consumer spending as mobility restrictions are lifted. Unemployment rates between June 2020 and June 2021 decreased by 5.2%, while the demand for labor is increasing, coupled with increasing wages to incentivize Americans to rejoin the labor force. Schools and businesses are expected to fully reopen soon. In parallel, vaccination rates across the country and the world continue to rise, with full vaccination rates of 50% and 14.8% respectively.
However, it is not completely smooth sailing from here. According to M Capital Group, the main risks that threaten the continued growth of the U.S. economy are inflation, unsettled trade relations, and another wave of Covid-19 mutations that could shut down the world again. Have we learned from the past year of COVID-19 and adapted our economy accordingly?
“In order for the U.S. economy to continue growing, whether there is another wave or not, the U.S. needs to focus on diversifying supply chains, supporting business investment, and maintaining consumer spending,” says Grace Feeley, a research analyst at M Capital Group.
While the economic indicators are positive, the risks are coming closer to manifesting and threatening such growth. The new variants spreading throughout the world, Delta, Lambda, and Gamma, are vaccine-resistant and muddy the predictions made about the economy and health of the country. These variants bring back the feeling of uncertainty that has wreaked havoc not only on the stock market but the mindset of people around the world. MCG provides unique insight on how to mitigate these risks to possibly ensure a bright economic future.
3. Among top insurance
markets
• India ranked 10th among 156 countries in the life insurance business, with a share of 2.3
per cent during FY12
• The country ranked 19th among 156 countries in the non-life premium income, with a
share of 0.62 per cent in FY12
Rapidly growing
insurance segments
• The life insurance premium market expanded at a CAGR of 20.1 per cent, from USD11.5
billion in FY03 to USD59.9 billion in FY12
• The non-life insurance premium market rose at a CAGR of 18.0* per cent, from USD3.4
billion in FY04 to USD12.7 billion in FY13**
Source: IRDA, Mckinsey estimates
Notes: * Growth rate in INR terms, ** Figures for FY13 are provisional
Increasing private
sector contribution
• The share of private sector in the life insurance premiums increased from 2 per cent in
FY03 to 29.3 per cent in FY12
• The market share of private sector companies in the non-life insurance premium market
rose from 14.5 per cent in FY04 to 42.9 per cent in FY13**
Crop, Health and Motor
insurance to drive
growth
• Crop insurance market in India is the largest in the world and covers around 30 million
farmers; it accounted for nearly 5 per cent of the total non-life insurance premium in FY12
• Strong growth in the automotive industry over the next decade to be a key driver of motor
insurance
• Health insurance continues to be one of the most rapidly growing sectors in the Indian
insurance industry, and reported 16.1* per cent growth in gross premiums in FY13**
4. • The engineering sector is delicensed;
100 per cent FDI is allowed in the
sector
• Due to policy support, there was
cumulative FDI of USD14.0 billion into
the sector over April 2000 – February
2012, making up 8.6 per cent of total
FDI into the country in that period
Growing demand
Source: IRDA
Notes: 2015E - Expected value for 2015; Estimate according to BMI, IRDA - Insurance Regulatory and Development Authority,
IPO - Initial Public Offering, FDI - Foreign Direct Investment
Strong demand
• Growing interest in insurance
among people; innovative
products and distribution channels
aiding growth
• Increasing demand for insurance
offshoring
Attractive opportunities
• Life insurance in low-income
urban areas
• Health insurance, pension
segment
• Strong growth potential for
microinsurance, especially from
rural areas
Policy support
• Tax incentives on insurance
products
• Passing of Insurance Bill gives
IRDA flexibility to frame regulations
• Clarity on rules for insurance IPOs
would infuse liquidity in the industry
• Repeated attempts to make the
sector more lucrative for foreign
participants
Increasing investments
• Rising participation by private
players has increased their market
share in the life insurance market
to 29.3 per cent in FY12 from 2
per cent in FY03
• Increase in FDI limit to 49 per cent
from 26 per cent, as proposed in
2012, will further fuel investments
FY12
Market
size:
USD72
billion
FY15E
Market
size:
USD139
billion
Advantage
India
5. Source: IRDA
Notes: * As of September 2012, LIC - Life Insurance Corporation of India, GIC - General Insurance Corporation of India,
IRDA - Insurance Regulatory and Development Authority
• The life insurance
sector was made up
of 154 domestic life
insurers, 16 foreign
life insurers and 75
provident funds
• All life insurance
companies were
nationalised to form
LIC in 1956 to increase
penetration and protect
policy holders from
mismanagement
• The non-life insurance
business was
nationalised to form
GIC in 1972
• Malhotra Committee
recommended opening
up the insurance sector
to private players
• IRDA, LIC and GIC
Acts were passed in
1999, making IRDA the
statutory regulatory
body for insurance and
ending the monopoly of
LIC and GIC
• Post liberalisation, the
insurance industry
recorded significant
growth; the number of
private players increased
to 44 in 2012*
• Customers are more
conscious of the benefits
of insurance and its
importance for a secure
future
Before 1956
1956–72
1993–99
2000 onwards
6. Source: IRDA, Aranca Research
Note: Data as of September 2012
Insurance Regulatory and Development Authority (IRDA)
Established in 1999 under the IRDA Act
Responsible for regulating, promoting and ensuring orderly growth of the insurance and re-insurance business in India
Insurance
Regulatory and
Development
Authority
(IRDA)
Life
Insurance (24
players)
Non-Life
Insurance (27
players)
Public (1)
Private (23)
Public (6)
Private (21)
Ministry of
Finance
(Government
of India)
Re-insurance
(1 player)
Public (1)
7. Source: IRDA, Swiss Re Estimates, Aranca Research
Notes: * Growth rate in INR terms, ** Figures for India correspond to FY10, FY 11 and FY12
With a share of 2.3 per cent, India stood 10th among 156 countries in the life insurance business in FY12
The growth in life insurance and non-life insurance premium in India outperformed the average global growth as well as the
emerging markets over 2010–11
While life insurance premium witnessed a 2* per cent decline in 2012 due to adjustment in the new regulatory environment,
non-life insurance rose 37* per cent in 2012 compared to the previous year
Life insurance premium growth rates* in India,
emerging markets and the world
Non-life insurance premium growth rates* in India,
emerging markets and the world
20%
10%
-2%
11%
-5%
2%
3%
-3%
0%
2010 2011 2012
India** Emerging markets World
14%
23%
37%
10% 9% 8%
1% 2%
3%
2010 2011 2012
India** Emerging markets World
8. 14.4 17.9 22.3
28.5
40.0
57.0 54.9
63.3 73.3 72.0
FY03 FY04 FY05 FY06 FY07 FY08 FY09 FY10 FY11 FY12
Non life insurance premium (USD billion)
Life insurance premium (USD billion)
Gross premiums written in India (USD billion)
Source: IRDA, Aranca Research
The total insurance market expanded from USD14.4 billion
in FY03 to USD72 billion in FY12
Over FY03–FY12, total gross written premiums increased at
a CAGR of 19.6 per cent CAGR: 19.6%
10. Source: IRDA, Aranca Research
Note: Life insurance density* is defined as the ratio of premium
underwritten to the total population in a given year
Life insurance penetration increased to 3.4 per cent in 2011 from 2.6 per cent in 2002
Life insurance density* expanded from USD11.7 in 2002 to USD49.0 in 2011 at a CAGR of 17.2 per cent
Life insurance penetration (%) Life insurance density (USD)
2.6
2.3
2.5
2.5
4.1
4.0 4.0
4.6
4.4
3.4
2002
2003
2004
2005
2006
2007
2008
2009
2010
2011
11.7 12.9 15.7
18.3
33.2
40.4 41.2
47.7
55.7
49.0
2002
2003
2004
2005
2006
2007
2008
2009
2010
2011
CAGR: 17.2%
11. Source: IRDA, Aranca Research
Share of private sector has been growing over the years, from around 2 per cent in FY03 to 29 per cent in FY12
The Gross Direct Premium of private companies increased from USD0.2 billion in FY03 to USD17.6 billion in FY12 at a CAGR
of 61.7 per cent
Share of public and private sector in life insurance
segment (%)
Share of public and private sector in life insurance
segment (USD billion)
0 1 2 3 6
13 14 17 19 1811 14
17
21
28
37 34
39
45
42
FY03
FY04
FY05
FY06
FY07
FY08
FY09
FY10
FY11
FY12
Private (USD billion) Public (USD billion)
98.0
% 2.0%
FY04
70.7%
29.3%
FY12
Public Private
Size: USD11.5 billion
Size: USD59.9 billion
12. Market share of major companies in terms of total
life insurance premium collected (FY12)
Source: IRDA, Aranca Research
Notes: * As of September 2012; Excluding reinsurer,
LIC - Life Insurance Corporation of India
Currently, the life insurance sector has 23* private players
compared to only four in FY02
LIC is still the market leader, with 70.7 per cent share in
FY12, followed by ICICI Prudential, with 4.9 per cent share
71.0%
4.9%
4.6%
3.6%
2.6%
2.2%2.1% 9.0%
LIC
ICICI Prudential
SBI Life
HDFC Standard
Bajaj Allianz
Max Life
Birla Sunlife
Others
13. Share of linked and non-linked insurance premium
Source: IRDA, KPMG analysis
Note: *Growth rate in INR terms, Linked Plans - In linked plans, a part of the investment goes towards providing you life cover while the residual portion is
invested in a fund which in turn invests in stocks or bonds; the value of investments alters with the performance of the underlying fund
In Non-Linked plans, a major chunk of investible funds are in debt instruments, giving steady and almost assured returns over the long term
The industry is witnessing a shift towards the traditional
non-linked insurance plans
The share of non-linked insurance increased from 59.1* per
cent in FY09 to 75.7 per cent in FY12
The non-linked premiums expanded at a CAGR of 16.7* per
cent to USD45.4 billion during FY09–FY12
59.1% 56.5% 62.6%
75.7%
40.9% 43.5% 37.4%
24.3%
FY09 FY10 FY11 FY12
Linked Premium Non-Linked Premium
14. Source: IRDA, Aranca Research
Notes: * Figures for FY13 are provisional ** Growth rate in INR terms
The non-life insurance market grew from USD3.4 billion in FY04 to USD12.7 billion in FY13*
Over FY04–FY13*, non-life insurance premiums increased at a CAGR of 18.0** per cent
The number of policies issued increased from 43.6 million in FY03 to 85.7 million in FY12, at a CAGR of 7.8 per cent
Growth in Non-Life insurance premium
(USD billion)
Number of Non-Life insurance policies (million)
44
42
50 51 47
57
67 68
79
86
FY03
FY04
FY05
FY06
FY07
FY08
FY09
FY10
FY11
FY12
0.5 0.8 1.2 1.9 2.7 2.7 2.9 3.8
5.0 5.5
2.9 3.1
3.4
3.6
4.2 3.9 4.4
5.5
7.1
7.3
FY04
FY05
FY06
FY07
FY08
FY09
FY10
FY11
FY12
FY13*
Private (USD billion) Public (USD billion)
CAGR: 18.0**%
CAGR: 7.8%
15. Source: IRDA, Aranca Research
The non-life insurance penetration rate was in the range of 0.6–0.7 per cent over 2001–11
Non-life insurance density increased from USD3.0 in 2002 to USD10.0 in 2011 at a CAGR of 14.3 per cent
The global average density of USD283 in 2011 indicates a huge potential for growth
Non-Life insurance penetration (%) Life insurance density (USD)
0.67
0.62
0.64
0.61
0.60 0.60 0.60
0.60
0.71
0.70
2002
2003
2004
2005
2006
2007
2008
2009
2010
2011
3.0
3.5
4.0
4.4 5.2
6.2 6.2
6.7
8.7
10.0
2002
2003
2004
2005
2006
2007
2008
2009
2010
2011
CAGR: 14.3%
16. Break-up of non-life insurance market in India
(FY13*)
Source: IRDA, Aranca Research
Note: * Figures for FY13 are provisional
Motor insurance forms the largest non-life segment, with
43.1 per cent share in FY13*, with Gross Direct Premium of
USD5,482.8 million
Health insurance is the fastest growing segment and formed
22.2 per cent of the total in FY13*, with Gross Direct
Premium of USD2,824.7 million
43.1%
22.2%
9.6%
4.4%
3.5%
17.1%
Motor
Health
Fire
Marine
Engineering
Others
Total size: USD12.7 billion
17. 0.5 0.8
1.2
1.9
2.7
2.7
2.9
3.8
5.0
5.5
FY04
FY05
FY06
FY07
FY08
FY09
FY10
FY11
FY12
FY13*
Source: IRDA, Aranca Research
Notes: * Figures for FY13 are provisional, ** Growth rate in INR terms
The market share of private sector companies rose from 14.5 per cent in FY04 to 42.9 per cent in FY13*
The Gross Direct Premium of private companies increased from USD0.5 billion in FY04 to USD5.5 billion in FY13* at a CAGR
of 33.1** per cent
Growing share of private sector Non-life insurance premium of private sector
(USD billion)
CAGR: 33.1**%
57.1%42.9%
FY13*
Public Private
98% 2%
FY04
Size: USD12.7 billion
Size: USD3.4 billion
18. Market share of major companies in terms of
Gross Direct Premium collected (FY13*)
Source: IRDA, Aranca Research
Notes: * Figures for FY13 are provisional
** As of September 2012; Excluding reinsurer
The number of companies increased from 15 in FY04 to
27** in FY13; six of these companies are in the public sector
The public sector companies together accounted for about
57 per cent of the total Gross Direct Premium in the non-life
insurance segment
New India leads the market with 14.5 per cent market share
Private players are not far behind and compete better in the
non-life insurance segment
Total size: USD12.7 billion
14.5%
13.5%
13.3%
9.5%8.9%
5.8%
4.7%
29.9%
New India
United India
National
Oriental
ICICI Lombard
Bajaj Allianz
AIC
Others
19. Emergence of new
distribution channels
• New distribution channels like bancassurance, online distribution and NBFCs have
widened the reach and reduced costs
• Firms have tied up with local NGOs to target lucrative rural markets
Growing market share
of private players
• In the life insurance segment, share of the private sector in total premiums increased to
29.3 per cent in FY12 from 2.0 per cent in FY03
• In the non-life insurance segment, share of the private sector increased to 42.9 per cent in
FY13* from 14.5 per cent in FY04
Launch of innovative
products
• The life insurance sector has witnessed the launch of innovative products such as Unit
Linked Insurance Plans (ULIPs)
• Other traditional products have also been customised to meet specific needs of Indian
consumers
* Figures for FY13 are provisional
Notes: NBFC - Non Banking Financial Company, NGO - Non-governmental Organisation, EV - Embedded Value
Mounting focus on EV
over profitability
• Large insurers continue to expand, focussing on cost rationalisation and aligning business
models to realise reported embedded value (EV), and generate value from future business
rather than focus on present profits
20. Household and financial savings projections
Source: ICICI, Aranca Research
Note: Financial savings denote investment in
equity and debt instruments, E - Estimates
India’s robust economy is expected to sustain the growth in
insurance premiums written
Higher personal disposable incomes would result in higher
household savings that will be channeled into different
financial savings instruments like insurance and pension
policies
Household savings are expected to grow to USD540 billion
by 2015E from USD89 billion in 2000
Financial savings are expected to grow to USD248 billion by
2015E from USD45 billion in 2000
89
306
540
2000
2010
2015E
Household savings
(USD billion)
45
141
248
2000
2010
2015E
Financial savings
(USD billion)
21. Indian residents shifting from low-income to high-
income groups
Source: McKinsey Quarterly, Aranca Research
Growing affluence of the middle class
The emergence of an affluent middle class is triggering
demand for both life and non-life personal insurance lines
A rising number of young professionals are opting for health
insurance, motor insurance and ULIPs
1 3 7
2 6
17
12
25
29
35
40
32
50
26
15
2008 2020 2030
Deprived (<1657)
Aspirers (1657-
3682.5)
Seekers (3682.5 -
9206.4)
Strivers (9206.4-
18412.8)
Globals (>18412.8)
Million Household, 100%
Income segment
22. Tax incentives
• Insurance products are covered under the exempt, exempt, exempt (EEE) method of
taxation. This translates to an effective tax benefit of approximately 30 per cent on select
investments (including life insurance premiums) every financial year
Union Budget
2013–14
• The proposed Insurance (Amendment) Bill is expected to empower IRDA to introduce
regulations for promoting sustainable growth, providing the flexibility to frame regulations
and increase the FDI limit to 49 per cent
• The government has also extended Rashtriya Swasthya Bima Yojana (RSBY) to cover
unorganised sector workers in hazardous mining and associated industries
Life insurance
companies allowed to
go public
• IRDA recently allowed life insurance companies that have completed 10 years of
operations to raise capital through initial public offerings (IPOs)
• Companies will be able to raise capital if they have embedded value of twice the paid up
equity capital
Notes: RSBY - Rashtriya Swasthya Bima Yojana, FDI - Foreign Direct Investment
Approval of increase in
FDI limit and revival
package
• Increase in FDI limit will help companies raise capital and fund their expansion plans
• Revival package by government will help companies get faster product clearances, tax
incentives and ease in investment norms
23. The IRDA Act, 1999 allowed an FDI of up to 26 per cent in the insurance sector on an automatic route subject to obtaining
license from IRDA
Cabinet has approved an increase of FDI limit to 49 per cent through the Insurance Laws Amendment Bill (2008). The increase
in FDI limit will take effect following approval from the Parliament
Top Life Insurance Co Foreign Partner Domestic Partner Year of Incorporation
Prudential plc (26%) ICICI Bank Ltd (74%) 2000
Allianz SE (26%) Bajaj Finserv Ltd (74%) 2001
BNP Paribas Cardif (26%) SBI (74%) 2000
Standard Life (26%) HDFC Bank (72.4%) 2000
Sun Life Financial, Inc (26%) Aditya Birla Group (74%) 2000
Nippon Life Insurance (26%) Reliance Capital (74%) 2005
Mitsui Sumitomo Insurance (26%) Max India (74%) 2000
24. Top Life Insurance Co Foreign Partner Domestic Partner Year of Incorporation
Fairfax Financial Holdings Ltd
(26%)
ICICI Bank Ltd (74%) 2000
Allianz SE (26%) Bajaj Finserv Ltd (74%) 2001
Tokio Marine & Nichido Fire
Insurance Group (26%)
IFFCO (74%) 2000
Source: Aranca Research
25. Religare Health Insurance • USD 110.4 million by 2016
IndiaFirst Life Insurance • USD28 million in 2010; plans to invest USD45 million in 2011
Aviva Life • USD26 million in 2010
Reliance Life • USD58 million in 2011
Canara HSBC Life • USD22 million in 2011
Bharti AXA Life • Plans to inject USD100 million in 2011
AEGON Religare Life • USD71 million in 2010; plans to invest USD445 million through 2016
ING Vysya Life • USD53 million in 2010
HDFC Life • Going public by FY14
Source: Towers Watson; Assorted News Articles; Aranca Research
Most of the existing players are tying up with banks to expand their distribution network
Few players like HDFC Life are planning to go public; others are selling stakes to generate funds
Investments from the private sector are increasing, as they see a huge opportunity in the growing insurance sector of
the country
26. Source: KPMG, Aranca Research
Note: TPA - Third Part Administrator
1999 2001 2006
CHANGEIMPACT
IRDA cleared bill
Liberalisation of
sector and
formation of an
independent
regulator
IRDA issues TPA regulations
Foreign players allowed to
enter with 26% FDI cap
Entry of TPAs specifically
focussed o n servicing health
insurance business
Entry of foreign players infusing
capital and technical expertise
IRDA insurance
brokers and
corporate agent
regulation
Thrust on
insurance
distribution
through corporate
intermediaries
Entry of stand-
alone health
insurance players
allowed
Entry of stand-
alone health
insurance players
2002
27. Source: KPMG, Aranca Research
Note: CVTP - Commercial Vehicle Third Party, TP - Third Party, CV - Commercial Vehicle
2007 2011 2012
Creation of Indian Motor
Third Party Insurance Pool
Mechanism to equitably
share CVTP losses
Merger and
Acquisition
guidelines
Enabled
consolidation,
inorganic
transactions in
the industry
Introduction of
Declined Risk
pool, TP
premium
increase
Improvement in
overall
profitability of
the CV
segment
Price detariffication
Significant change in the
premium rates for the
commercial lines
CHANGEIMPACT
28. 8.4
39.2
58.2
80.3
116.0
121.9
FY08
FY09
FY10
FY11
FY12
FY13
Source: SBI Life Annual Report, IRDA, Company website, Aranca Analysis
Note: * Growth rate in INR terms
SBI Life Insurance is a joint venture between Indian banking giant State Bank of India (74 per cent) and France headquartered
BNP Paribas Assurance (26 per cent)
The company primarily deals in life insurance and pension plans with 714 offices across India. In FY12, it issued around 8.8
lakh insurance policies
Between FY08 and FY13, SBI Life’s profits increased at a CAGR of 81.1* per cent; in FY13, its annual profits increased to
USD121.9 million. It had second largest market share (15.6 per cent among all private sector companies in FY12) in the life
insurance premium
Total premium collected (USD billion) Net profit (USD million)
CAGR: 81.1*%
1.4
1.6
2.1
2.8 2.7
FY08
FY09
FY10
FY11
FY12
CAGR: 23.6*%
29. 3.5
9.3 9.0
9.6
11.4
13.3
12.3
FY06
FY07
FY08
FY09
FY10
FY11
FY12
198.8
301.9
508.5
598.5
736.9
874.5
757.3
FY06
FY07
FY08
FY09
FY10
FY11
FY12
Source: IRDA, Aranca Research
Note: * Growth rate in INR terms
Tata AIA Life Insurance Company Limited (Tata AIA Life) is a joint venture between Tata Sons (74 per cent) and AIA Group
Limited (26 per cent)
The life insurance premium increased from USD198.8 million in FY06 to USD757.3 million in FY12 at a CAGR of 26.6* per
cent
The sum assured increased from USD3.5 billion in FY06 to USD12.3 billion in FY12, rising at a CAGR of 24.9* per cent
Total life insurance premium (USD million) Total sum assured (USD billion)
CAGR: 24.9*%
CAGR: 26.6*%
30. Objective for establishing microinsurance
• Fulfilment of corporate social responsibility
• Increase brand recognition to boost market entry –
today’s micro clients maybe tomorrow’s high-premium
clients
• To target untapped markets and income groups of
rural India
The microinsurance business model
Source: Company website, Aranca Analysis
Key strategic decisions
• The microinsurance business model must be
separated from business model
• Selling microinsurance would require new, alternative
distribution mechanisms
New business unit
• A special
microinsurance
team called the
Rural & Social
Team is formed
Partnering with
NGOs
• Identify and partner
with credible NGOs
operating in the
local community
• NGO suggests
good agents for
microinsurance
policies (micro-
agents)
Forming CRIGs
• A group of micro-
agents called a
community rural
insurance group
(CRIG) is formed; it
relies on direct
marketing of
microinsurance
policies to local
community
members
Local operations
managed by NGOs
• Local operations
like collecting and
aggregating the
premiums, training
micro-agents, and
helping to
distribute benefits
looked after by the
NGO; this saves
administrative
costs for Tata-AIG
31. Source: Company website, Aranca Analysis
Robust growth in microinsurance expected
Number of policies Premium – First year (FYP) and Renewals (RYP)
100,000
190,000
300,000
380,000 410,000
2008 2009 2010 2011 2012
400
900
1,800
2,400
2,800
0
300
800
1,900
3,200
2008 2009 2010 2011 2012
FYP RYP
Source: Company website, Aranca Analysis
32. Gross Direct Premium (USD million)
Source: IRDA, Company website, New India Assurance Annual report
Notes: * Growth rate in INR terms, ** Figures for FY13 are provisional,
A.M. Best Europe Ltd, Alfred Magilton Best Company Limited
New India Assurance a wholly owned subsidiary of
Government of India; it is the largest non-life insurance
company in India with a market share of 14.5 per cent in
FY13** in the non-life insurance segment
It is the largest non-life insurer in Afro-Asia, excluding Japan
It serves the Indian subcontinent with a network of 1,068
offices, comprising 28 Regional offices, 393 Divisional
offices and 648 branches, with nearly 21,000 employees
The company has overseas presence in 20 countries:
Japan, UK, Middle East, Fiji and Australia
It has been rated as "A-" (Excellent) for six consecutive
years, indicating its excellent risk-adjusted capitalisation,
prospective improvement in underwriting performance and
leading business profile in the direct insurance market in
India
Its Gross Direct Premium increased from USD1,406.2
million in FY09 to USD2,101.4 million in FY12, at a CAGR
of 16.0* per cent
217 256 297 329
111 111 133 159
528 538
621
778
295 331
443
494
254
263
311
341
FY09 FY10 FY11 FY12
Fire Marine Motor Health Miscellaneous and others
CAGR: 16.0*%
33. 4.0
4.5
5.6
7.6
9.2
FY09
FY10
FY11
FY12
FY13
816.6
723.8
967.4
1,117.7 1,182.1
FY09
FY10
FY11
FY12
FY13
Source: ICICI Lombard Annual Report, IRDA, Company website, Aranca Analysis
Notes: * Growth rate in INR terms, ** Figures for FY13 are provisional
ICICI Lombard GIC Ltd is a 74:26 joint venture between ICICI Bank Limited, India’s second largest bank, and Fairfax Financial
Holdings Limited, a Canada-based diversified financial services company
It is the largest private sector general insurance company, with a market share of 8.9 per cent in the non-life insurance sector
in FY13**
As of FY13, it has 2,757 pan India branches with an employee strength of 7,289
Its Gross Direct Premium increased from USD816.6 million in FY09 to USD1,182.1 million in FY13 at a CAGR of 14.4* per
cent
Gross Direct Premium (USD million) Number of policies issued (million)
CAGR: 23.4%
CAGR: 14.4*%
34. Source: Aranca Research
Opportunities
for Indian
insurance
market
Crop
insurance
Micro-
insurance
Health
insurance
markets
Motor
insurance
markets
Low-income
urban and
pension
markets
35. Urban low-income insurance penetration in India
Source: IRDA, Asia Insurance Review, Aranca Research
Note: E in the axis for the figures above refer to estimates
Urban low-income insurance penetration in India is
expected to have increased to 40 per cent in 2012 from 30
per cent in 2007
Rapid development in Tier II and Tier III cities and growth in
new bankable households have led to the emergence of a
large insurable class with an appetite for sophisticated life
insurance products
Insurance density and penetration remain at very low levels
compared to that in developed countries; this indicates a
strong potential for growth in future
Business models need to be customised accordingly to
maintain cost-effectiveness, as most low-income customers
would be small-ticket accounts, though huge in numbers
30%
40%
2007 2012E
36. Opportunity in the Indian pension and annuity
market
Source: McKinsey Quarterly, Aranca Research
Notes: PFRDA - Pension Fund Regulatory and Development Authority
* Expected value, at 2009-10 rates
Increasing life expectancy, favourable savings and
greater employment in the private sector will fuel
demand for pension plans
The opening of pension market with the passing of the
PFRDA Bill 2011 will make the pension market more
conducive for private life insurers
Proposed new pension bill by government will further
provide new opportunities to insurers
There is scope to introduce new-generation pension
products such as Variable Annuity and Inflation Indexed
Annuity
42
84
2010 2025E*
Indian retirement market (USD billion)
13%
87%
Formal pension system
penetration (2010)
Workers
covered
Workers not
covered
CAGR: 7%
37. Source: IRDA, Aranca Research
Notes: E in the axis for the figures above refer to estimates, * ACMA Estimates, ** Figures for FY13 are provisional, GDP - Gross Domestic Product
The number of new policies issued increased at a CAGR of 7.8 per cent from FY03 to FY12, from 43.6 million to 85.7 million
Despite strong growth, non-life insurance sector remains far from tapped, with penetration rates (premium to GDP ratios)
remaining low at 0.7 per cent in 2012 compared to an average of 4.5 per cent in the US and global average of 2.8 per cent
Strong growth in the automotive industry over the next decade will be a key driver of motor insurance
Proposed IRDA draft envisages a 10–80 per cent rise in premium rates for the erstwhile loss-making third-party motor
insurance
Breakup of non-life insurance market in India
(FY13**)
Vehicle production in India* (million units)
2.8
0.7
9.09.2
2.3
32.0
Car
Production
Commercial 2&3
wheelers
2010 2020E
43.1%
22.2%
9.6%
4.4%
3.5%
17.1%
Motor
Health
Fire
Marine
Engineering
Others
38. Health insurance penetration (million policies)
Source: McKinsey Quarterly, Annual Report IRDA, Aranca Research
Notes: * Growth rate in INR terms
** Figures for FY13 are provisional
Only 1.5–2 per cent of total healthcare expenditure in India
is currently covered by insurance providers
From 13.3 per cent of the total non-life insurance premium
in FY07, health insurance currently contributes 22.2** per
cent
Total health insurance premiums increased from USD733.1
million in FY07 to USD2,824.7 million in FY13** at a CAGR
of 29.1* per cent
Health insurance continues to be one of the most rapidly
growing sectors in the Indian insurance industry; it reported
16.1* per cent growth in gross premiums in FY13**
Absence of a government-funded health insurance makes
the market attractive for private players
IRDA recommended the government to reduce capital
requirements for stand-alone health insurance companies
from USD21 million to USD10 million
110
220
2005 2015E
CAGR: 8%
39. Population covered by health insurance (in million)
Source: Mckinsey estimates, Aranca Research
Notes: RSBY - Rashtriya Swasthya Bima Yojna
ESIC - Employees State Insurance Corporation
Introduction of health insurance portability expected to boost
the orderly growth of the health insurance sector
Penetration of health insurance is expected to more than
double by 2020
Increasing penetration of health insurance likely to be driven
by government-sponsored initiatives such as RSBY and
ESIC
Government-sponsored programmes expected to provide
coverage to nearly 380 million people by 2020
Private insurance coverage is estimated to grow by nearly
15 per cent annually till 2020
35
13020
25
55
120
80
240
110
140
2010 2020E
Private insurance Govt employee insurance
ESIC RSBY
State insurance
40. The business environment in India’s microinsurance sector supports healthy growth
Source: IRDA, McKinsey, Aranca Research
Macro level
(The enabling environment)
Intermediate level
(Support infrastructure)
Micro level
(Policy holders)
• IRDA drafted microinsurance guidelines in 2010, which contain
numerous favourable measures such as
• Lower threshold limits for agents’ commissions
• Rural areas must account for 7 per cent of new life insurance
policies in the first year of firm’s operation and rise to 20 per cent
over the next 10 years
• In order to reduce microinsurance distribution costs, IRDA proposed
microinsurance schemes to supplement existing government
insurance schemes
• The number of regional rural banks and NGOs operating in the rural
sector will aid distribution of microinsurance products
• The annual income growth rate in rural India is expected to increase
to 3.6 per cent over 2010–30 from 2.8 per cent during 1990–2010
• About 5 million people currently have microinsurance, while the entire
market is expected to be in the range of 140–300 million
41. Number of Micro-insurance policies (in millions) New business premium (USD million)
Source: IRDA, McKinsey, Aranca Research
2.1 3.0 2.6 1.5
12.6
16.8 16.3
13.3
14.7
19.8 18.9
14.8
FY09 FY10 FY11 FY12
Private Public Total
8.4 5.1 5.7 4.3
43.9
79.3
57.9
43.7
52.3
84.4
63.6
48.0
FY09 FY10 FY11 FY12
Private Public
42. Crop insurance coverage
Source: Agricultural Insurance Company of India Annual report,
Department of Agriculture and Cooperation, IRDA, Aranca Research
Notes: * Growth rate in INR terms
Crop insurance market in India is the largest in the world,
covering around 30 million farmers
Crop insurance accounted for nearly 5 per cent of the total
non-life insurance premium in FY12
To provide crop insurance to farmers, Government has
launched various schemes like National Agriculture
Insurance Scheme (NAIS), Modified National Agriculture
Insurance Scheme (MNAIS) and Weather-based Crop
Insurance Scheme (WBCIS)
The number of farmers covered increased at a CAGR of
11.5 per cent from FY08 to FY12, while the sum insured
rose at a CAGR of 22.0* per cent from USD6.5 billion to
USD12.1 billion over the same period
There is huge scope for increasing coverage, as only 30
million farmers out of 120 million are insured under crop
insurance schemes
Government of India plans to increase the coverage to 50
million during the 12th Five-Year Plan
18.4 19.2
23.9
17.6 16.7
0.4 1.2
0.7 0.4
2.4
9.3 11.7
FY08 FY09 FY10 FY11 FY12
Number of farmers covered (million)
NAIS MNAIS WBCIS
6.1 5.8
8.1 7.5 7.1
0.2 0.70.4 0.2
1.0
3.1
4.4
FY08 FY09 FY10 FY11 FY12
Sum insured (USD billion)
NAIS MNAIS WBCIS
43. Insurance Regulatory and Development Authority (IRDA)
3rd Floor, Parisrama Bhavan, Basheer Bagh, Hyderabad–500 004
Phone: 91-040-23381100
Fax: 91-040-66823334
E-mail: irda@irda.gov.in
Life Insurance Council
4th Floor, Jeevan Seva Annexe Bldg. S. V. Road, Santacruz (W),
Mumbai–400054
Phone: 91-22-26103303, 26103306
E-mail: ninad.narwilkar@lifeinscouncil.org
General Insurance Council
5th Floor, Royal Insurance Building, 14, Jamshedji TATA Road, Churchgate,
Mumbai–400020
Phone: 91-22-22817511, 22817512
Fax: 91-22-22817515
E-mail: gicouncil@gicouncil.in
44. CAGR: Compound Annual Growth Rate
IRDA: Insurance Regulatory and Development Authority
IPO: Initial Public Offering
FDI: Foreign Direct Investment
LIC: Life Insurance Corporation of India
GIC: General Insurance Corporation of India
NBFC: Non-Banking Financial Company
NGO: Non-governmental Organisation
RSBY: Rashtriya Swasthya Bima Yojana
PFRDA: Pension Fund Regulatory and Development Authority
GDP: Gross Domestic Product
ESIC: Employees State Insurance Corporation
45. FY: Indian financial year (April to March)
So, FY12 implies April 2011 to March 2012
GOI: Government of India
INR: Indian Rupee
USD: US Dollar
Where applicable, numbers have been rounded off to the nearest whole number
46. Year INR equivalent of one USD
2004-05 44.95
2005-06 44.28
2006-07 45.28
2007-08 40.24
2008-09 45.91
2009-10 47.41
2010-11 45.57
2011-12 47.94
2012-13 54.31
Exchange Rates (Fiscal Year)
Year INR equivalent of one USD
2005 45.55
2006 44.34
2007 39.45
2008 49.21
2009 46.76
2010 45.32
2011 45.64
2012 54.69
2013 54.45
Exchange Rates (Calendar Year)
Average for the year
47. India Brand Equity Foundation (“IBEF”) engaged Aranca to prepare this presentation and the same has been prepared
by Aranca in consultation with IBEF.
All rights reserved. All copyright in this presentation and related works is solely and exclusively owned by IBEF. The
same may not be reproduced, wholly or in part in any material form (including photocopying or storing it in any medium
by electronic means and whether or not transiently or incidentally to some other use of this presentation), modified or in
any manner communicated to any third party except with the written approval of IBEF.
This presentation is for information purposes only. While due care has been taken during the compilation of this
presentation to ensure that the information is accurate to the best of Aranca and IBEF’s knowledge and belief, the
content is not to be construed in any manner whatsoever as a substitute for professional advice.
Aranca and IBEF neither recommend nor endorse any specific products or services that may have been mentioned in
this presentation and nor do they assume any liability or responsibility for the outcome of decisions taken as a result of
any reliance placed on this presentation.
Neither Aranca nor IBEF shall be liable for any direct or indirect damages that may arise due to any act or omission on
the part of the user due to any reliance placed or guidance taken from any portion of this presentation.