Download as PDF, PPTX
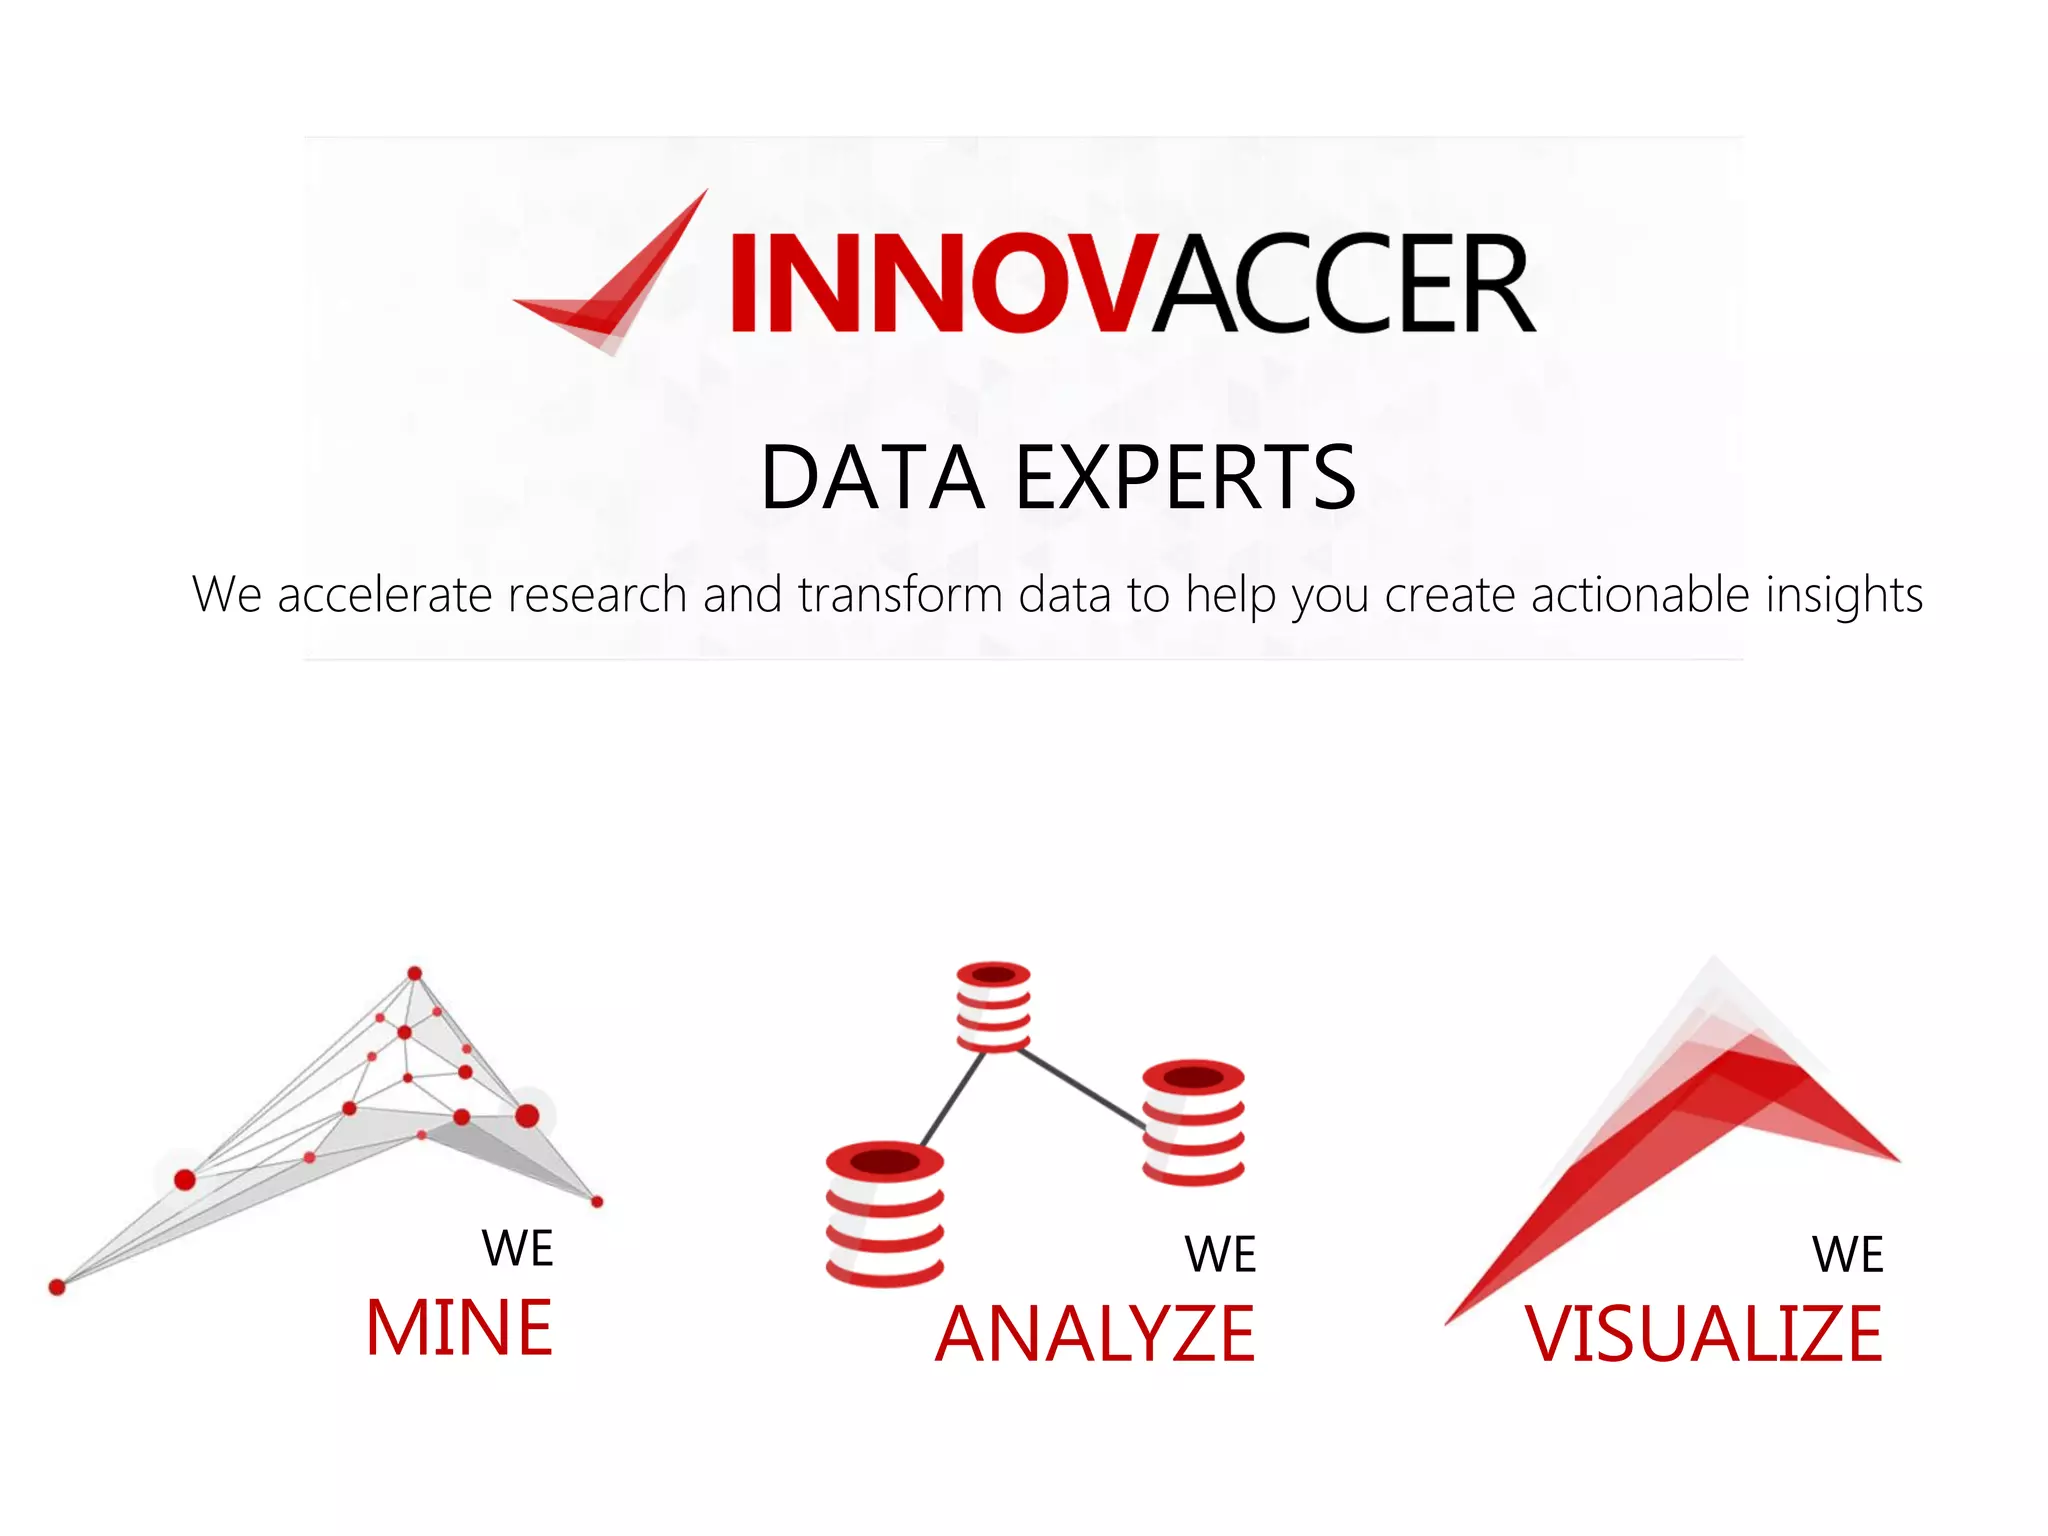
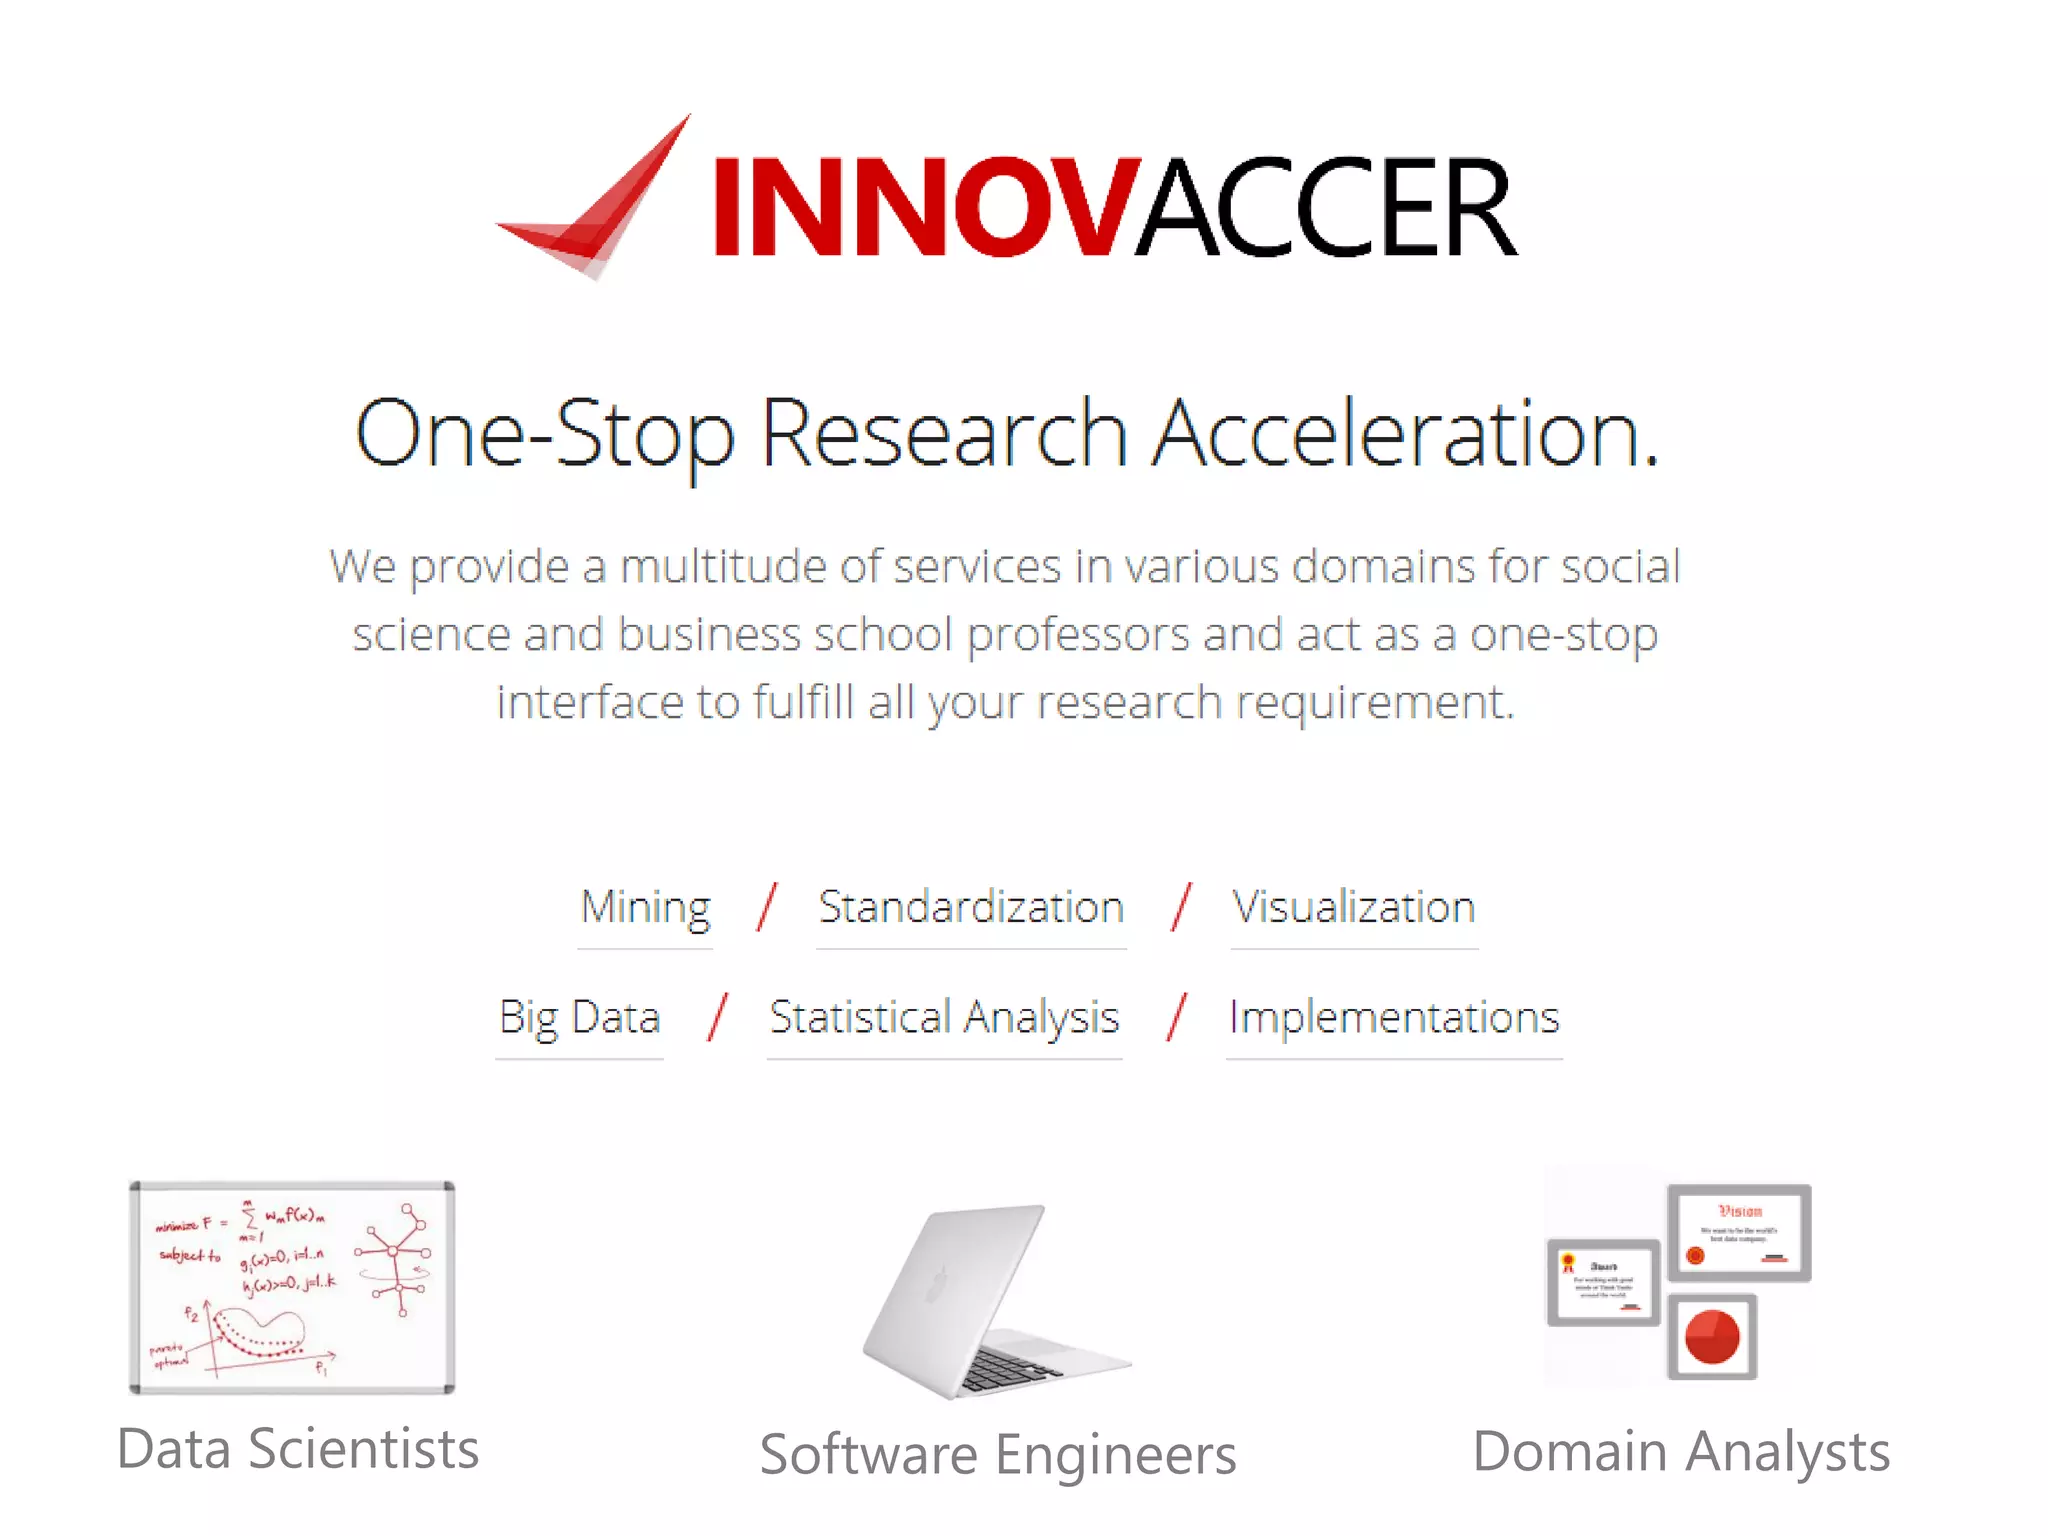
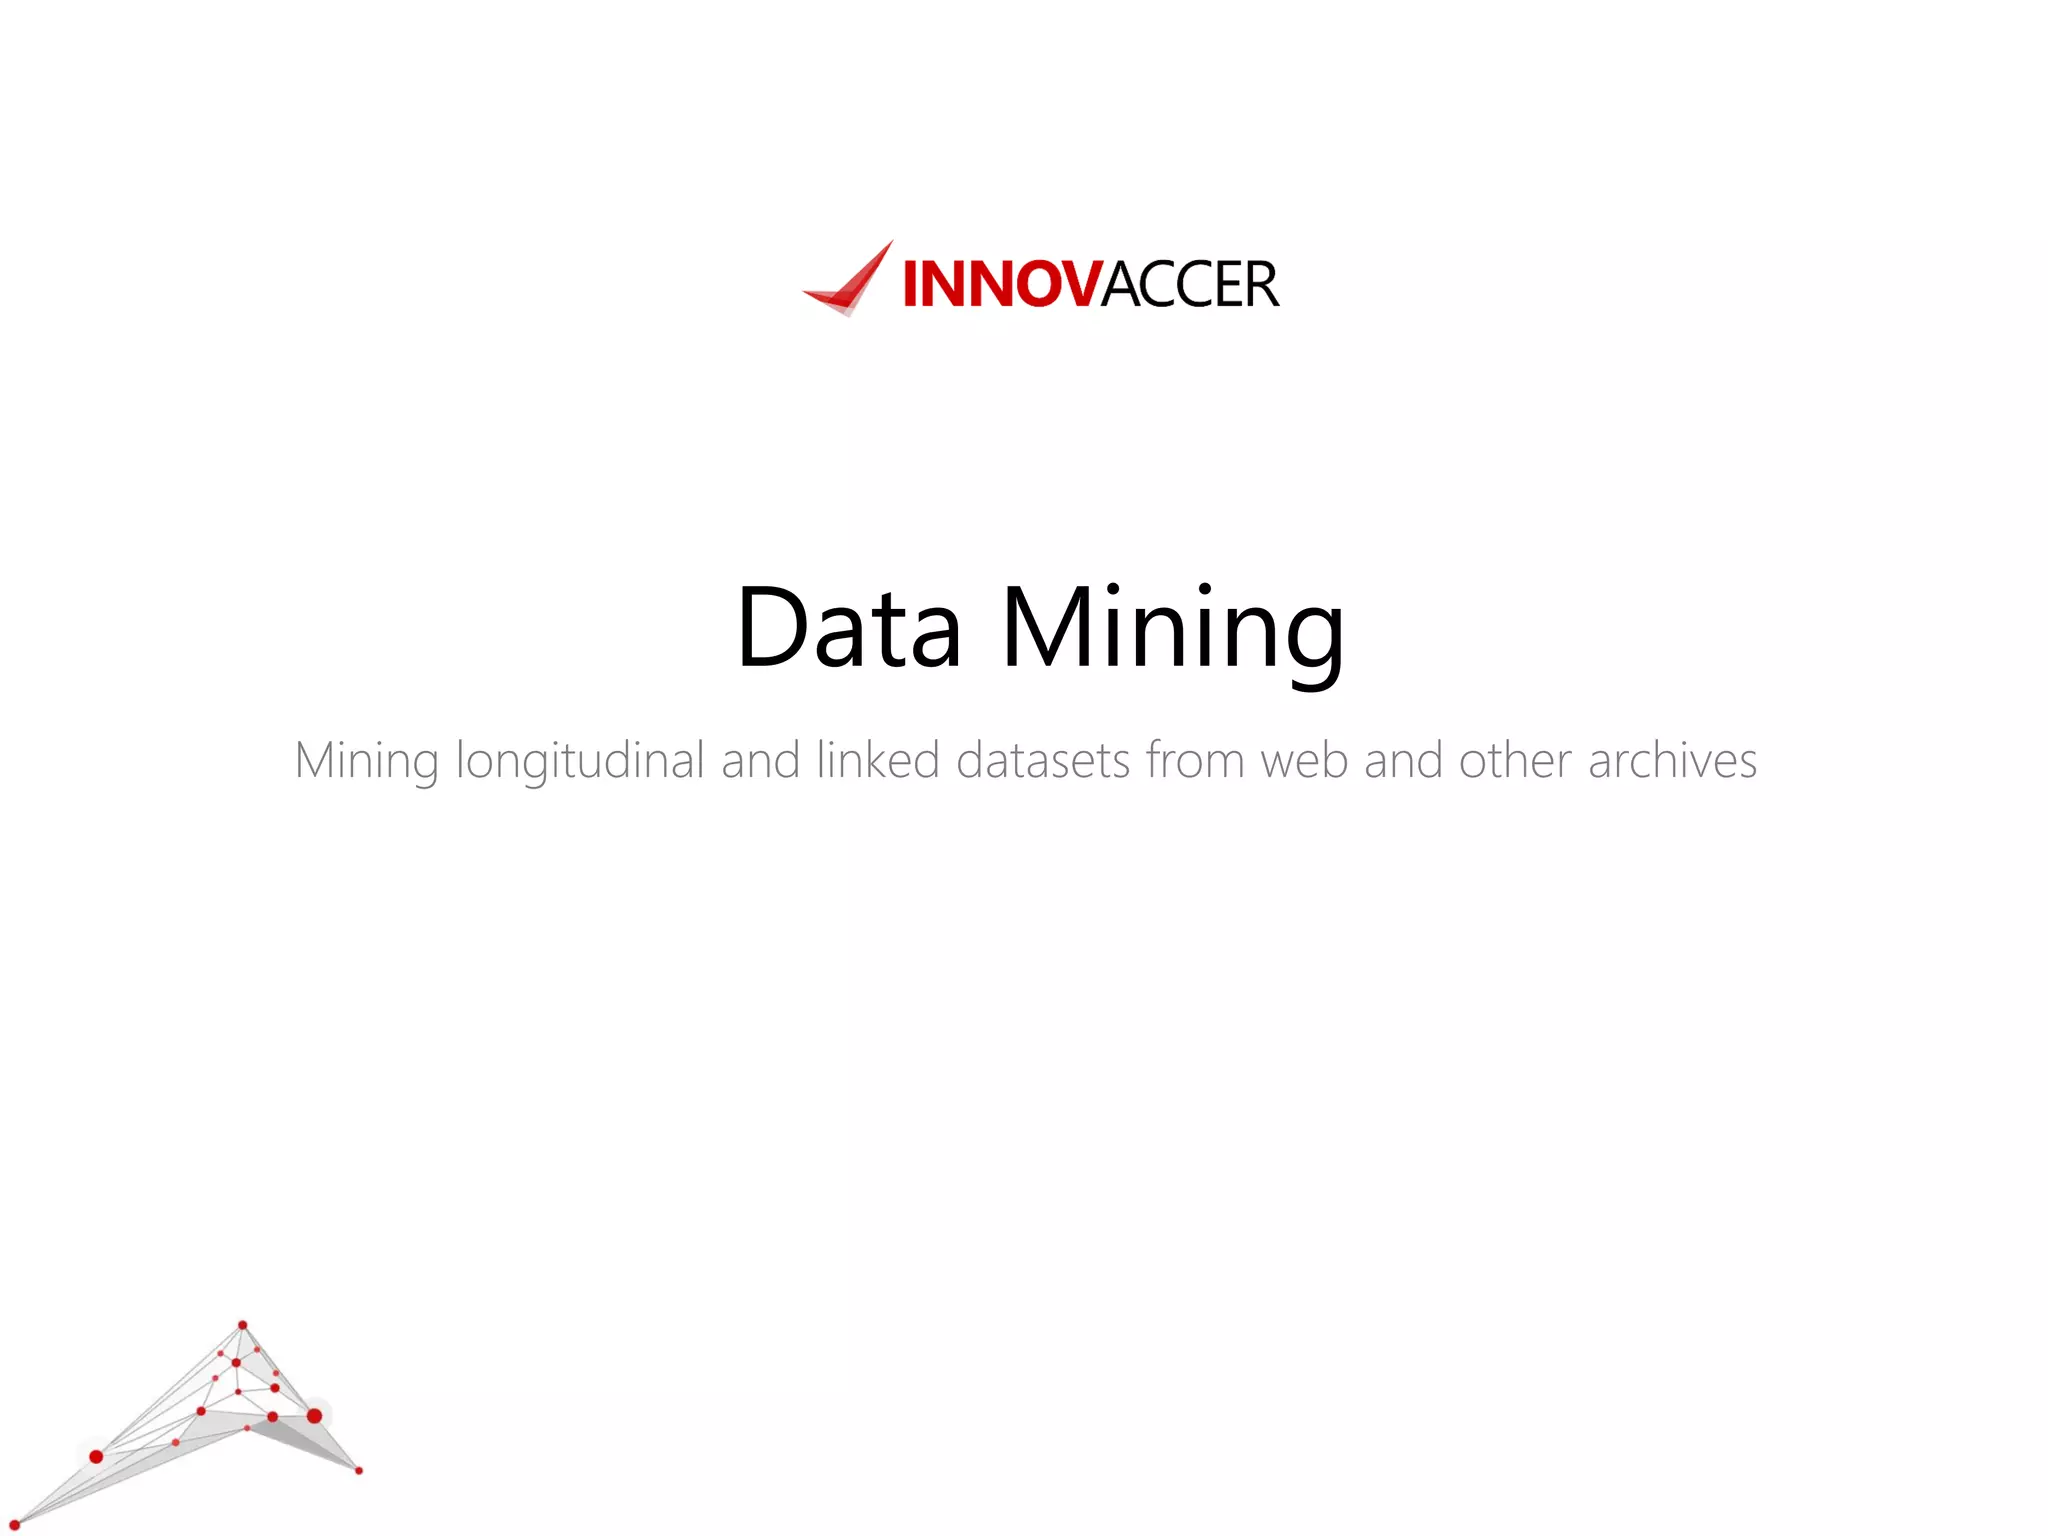
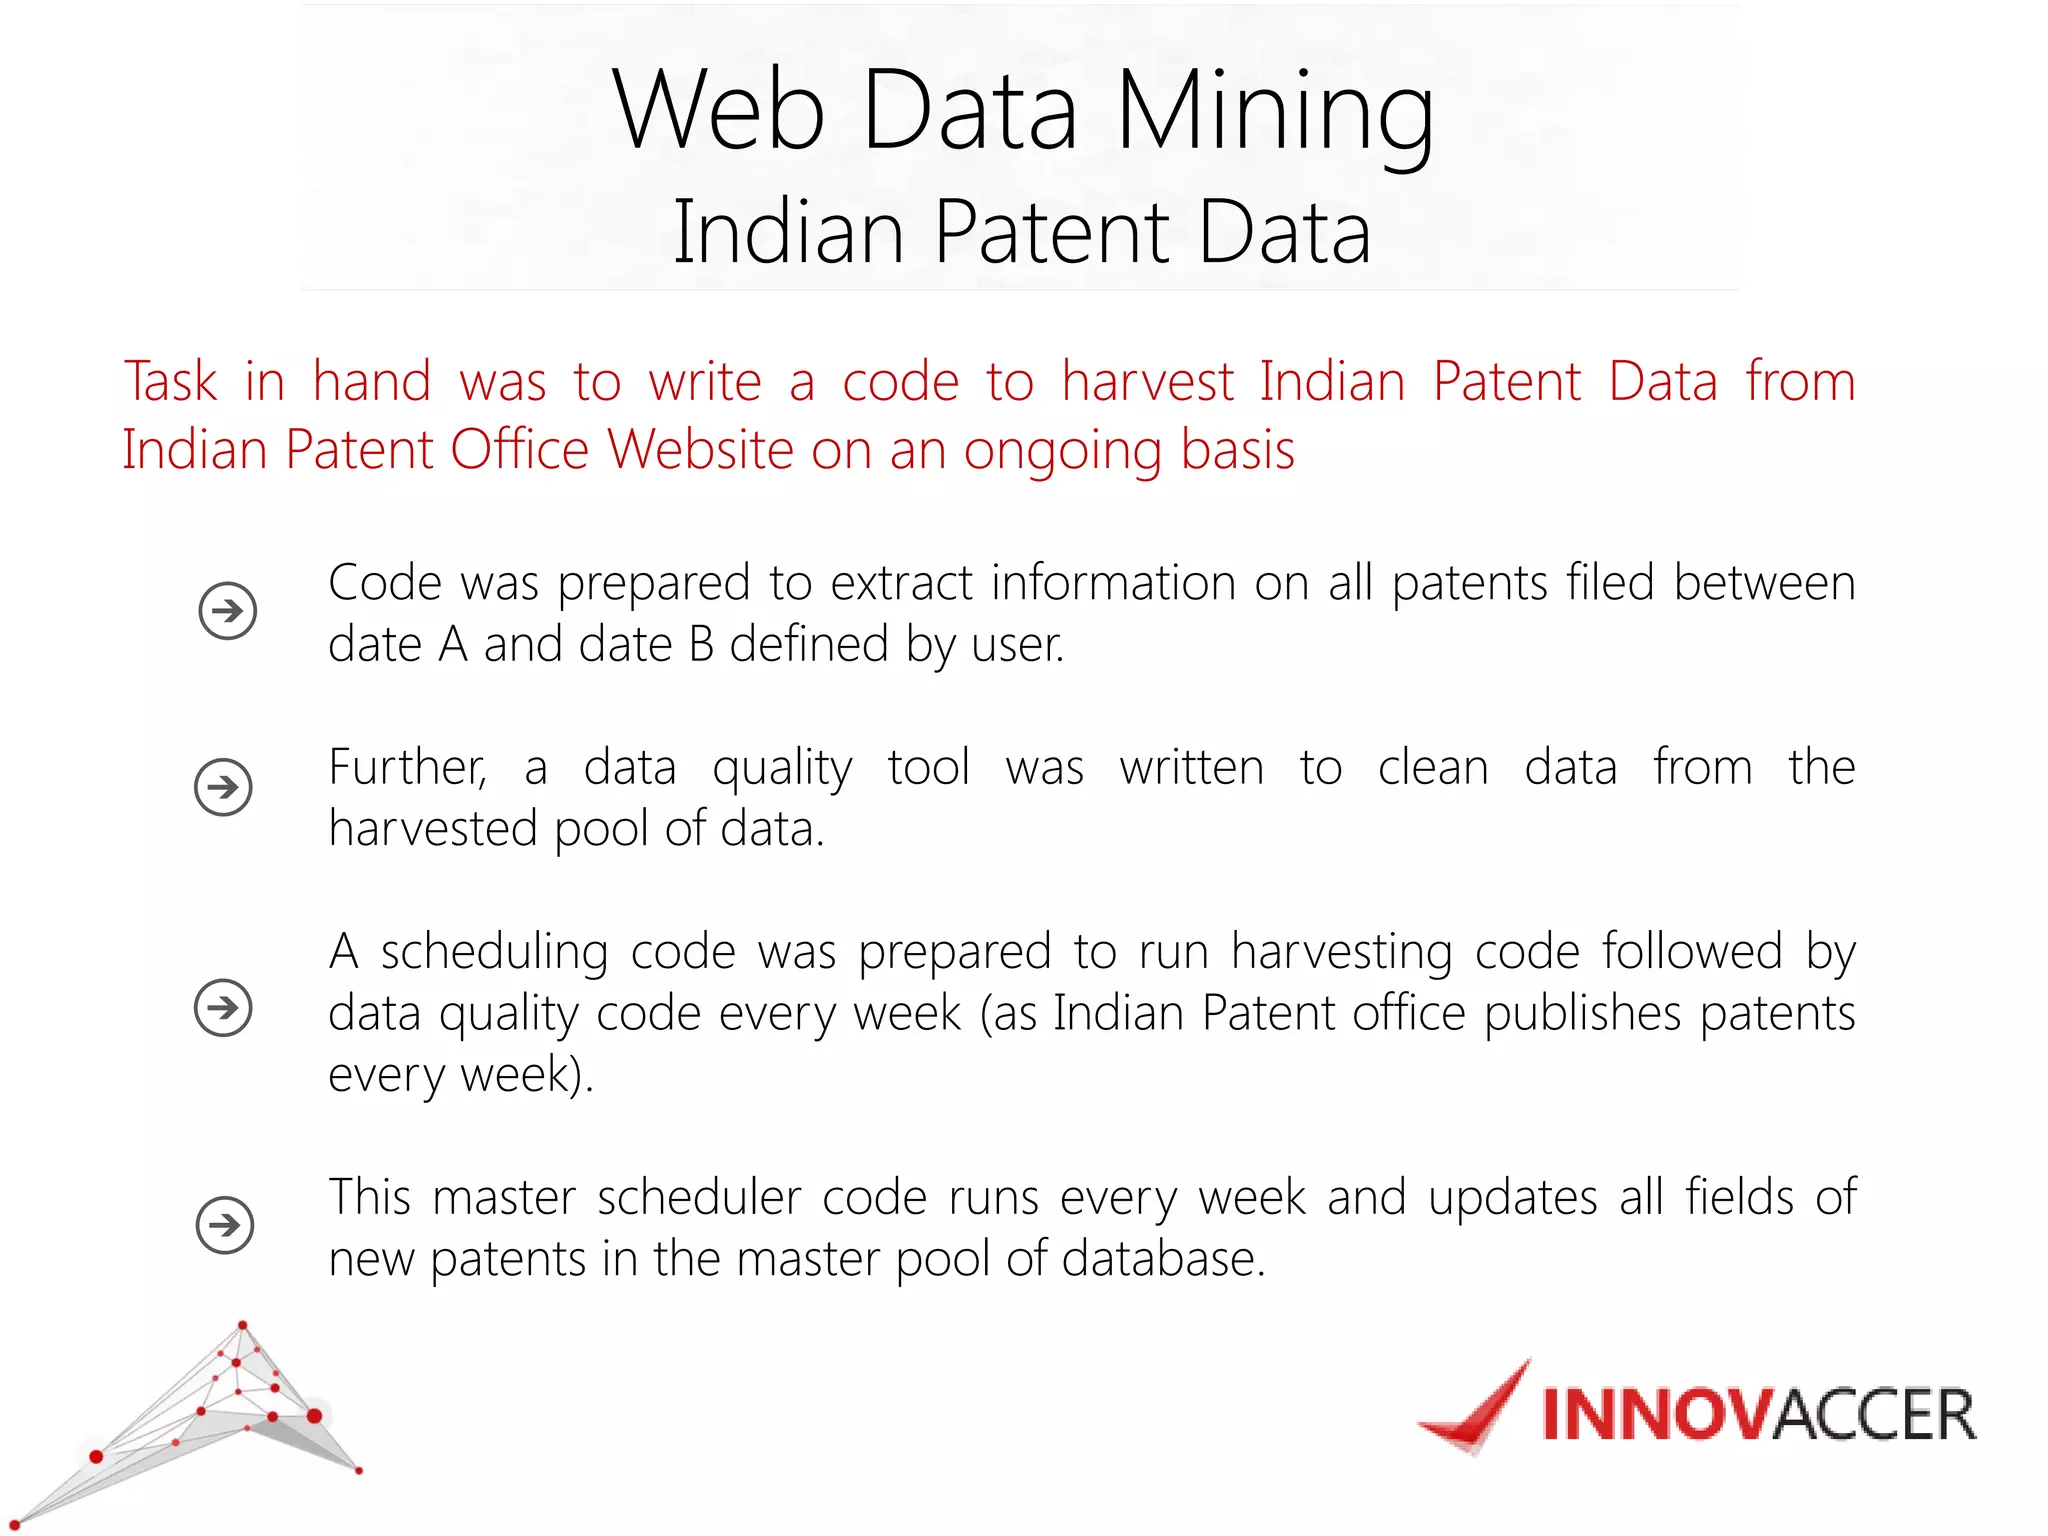
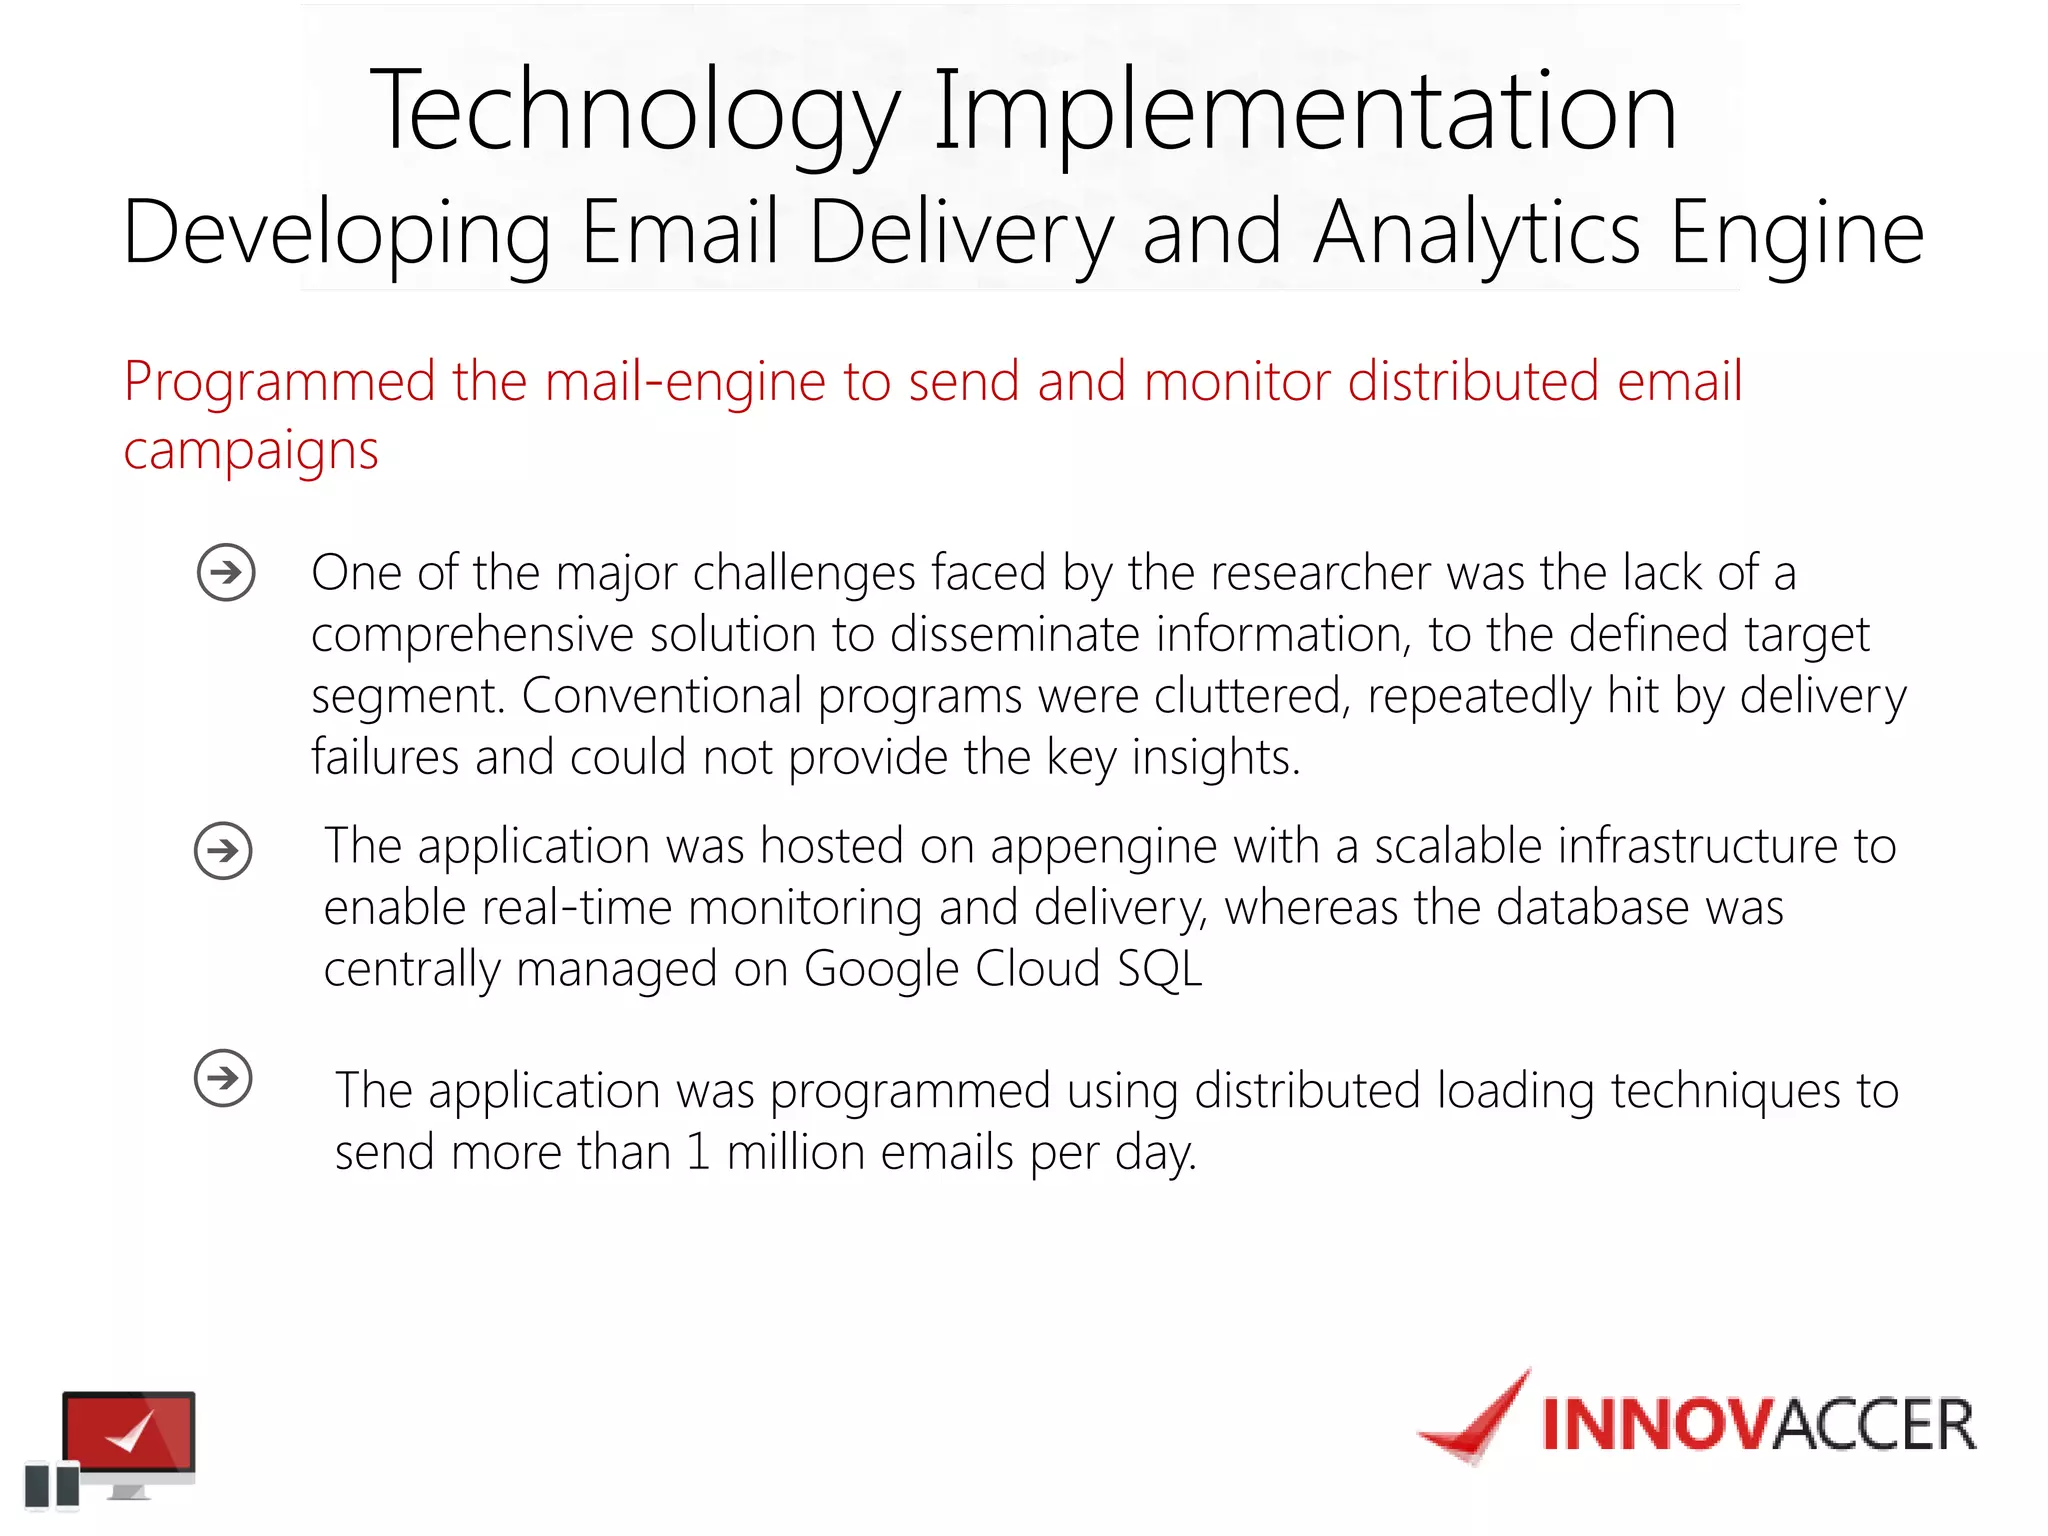
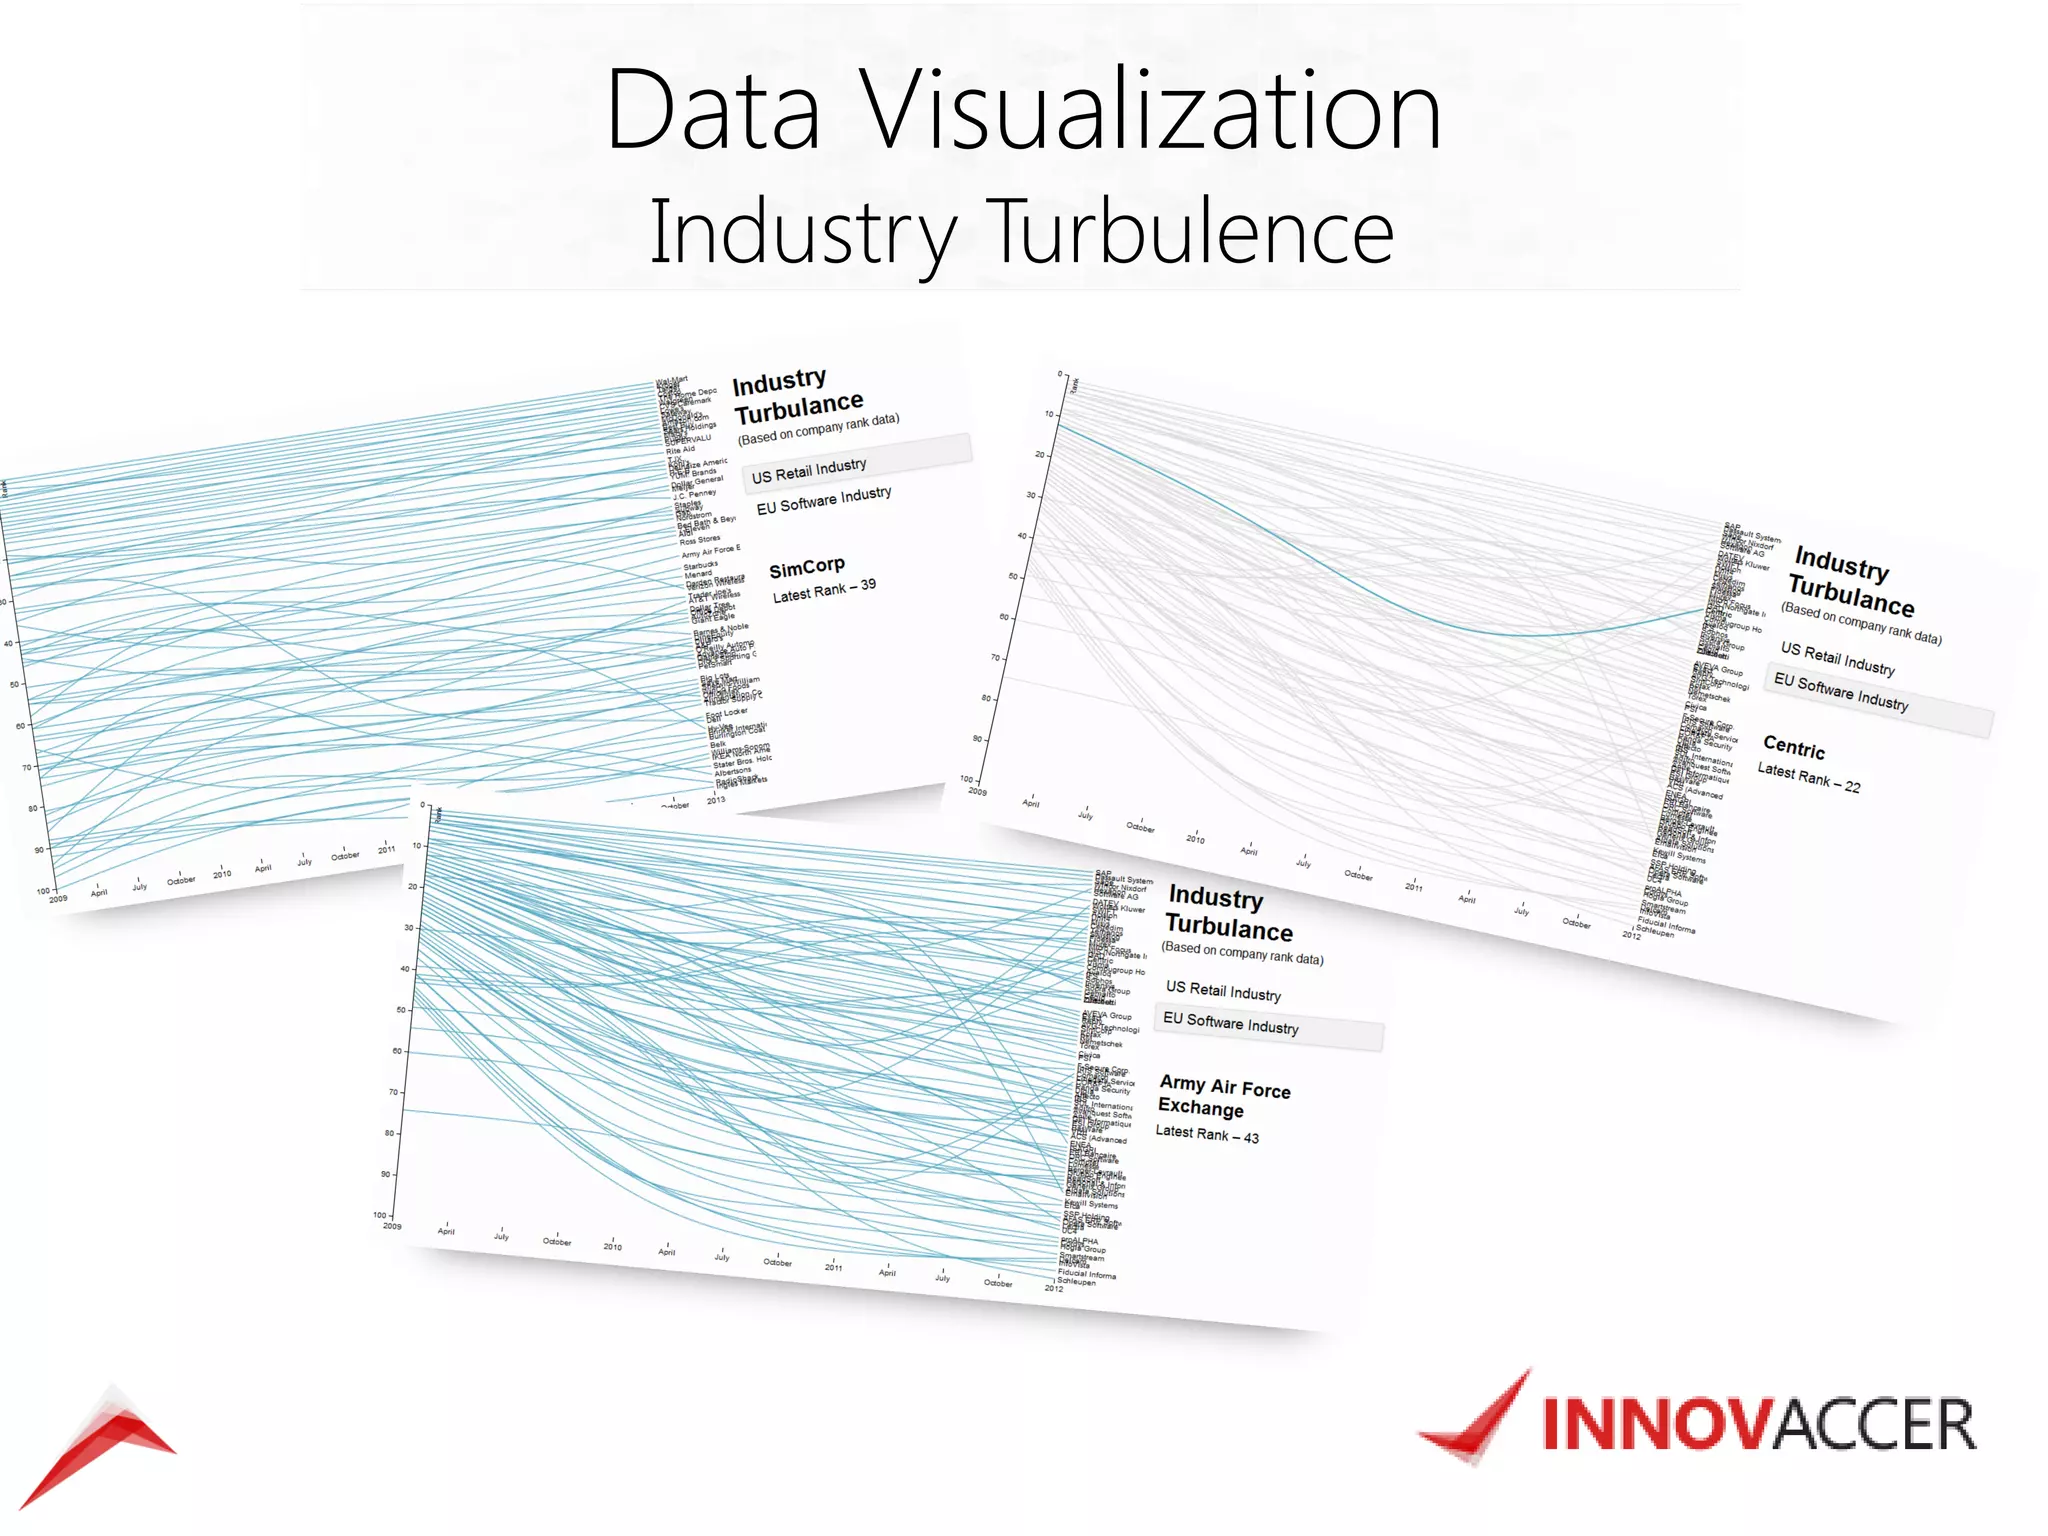
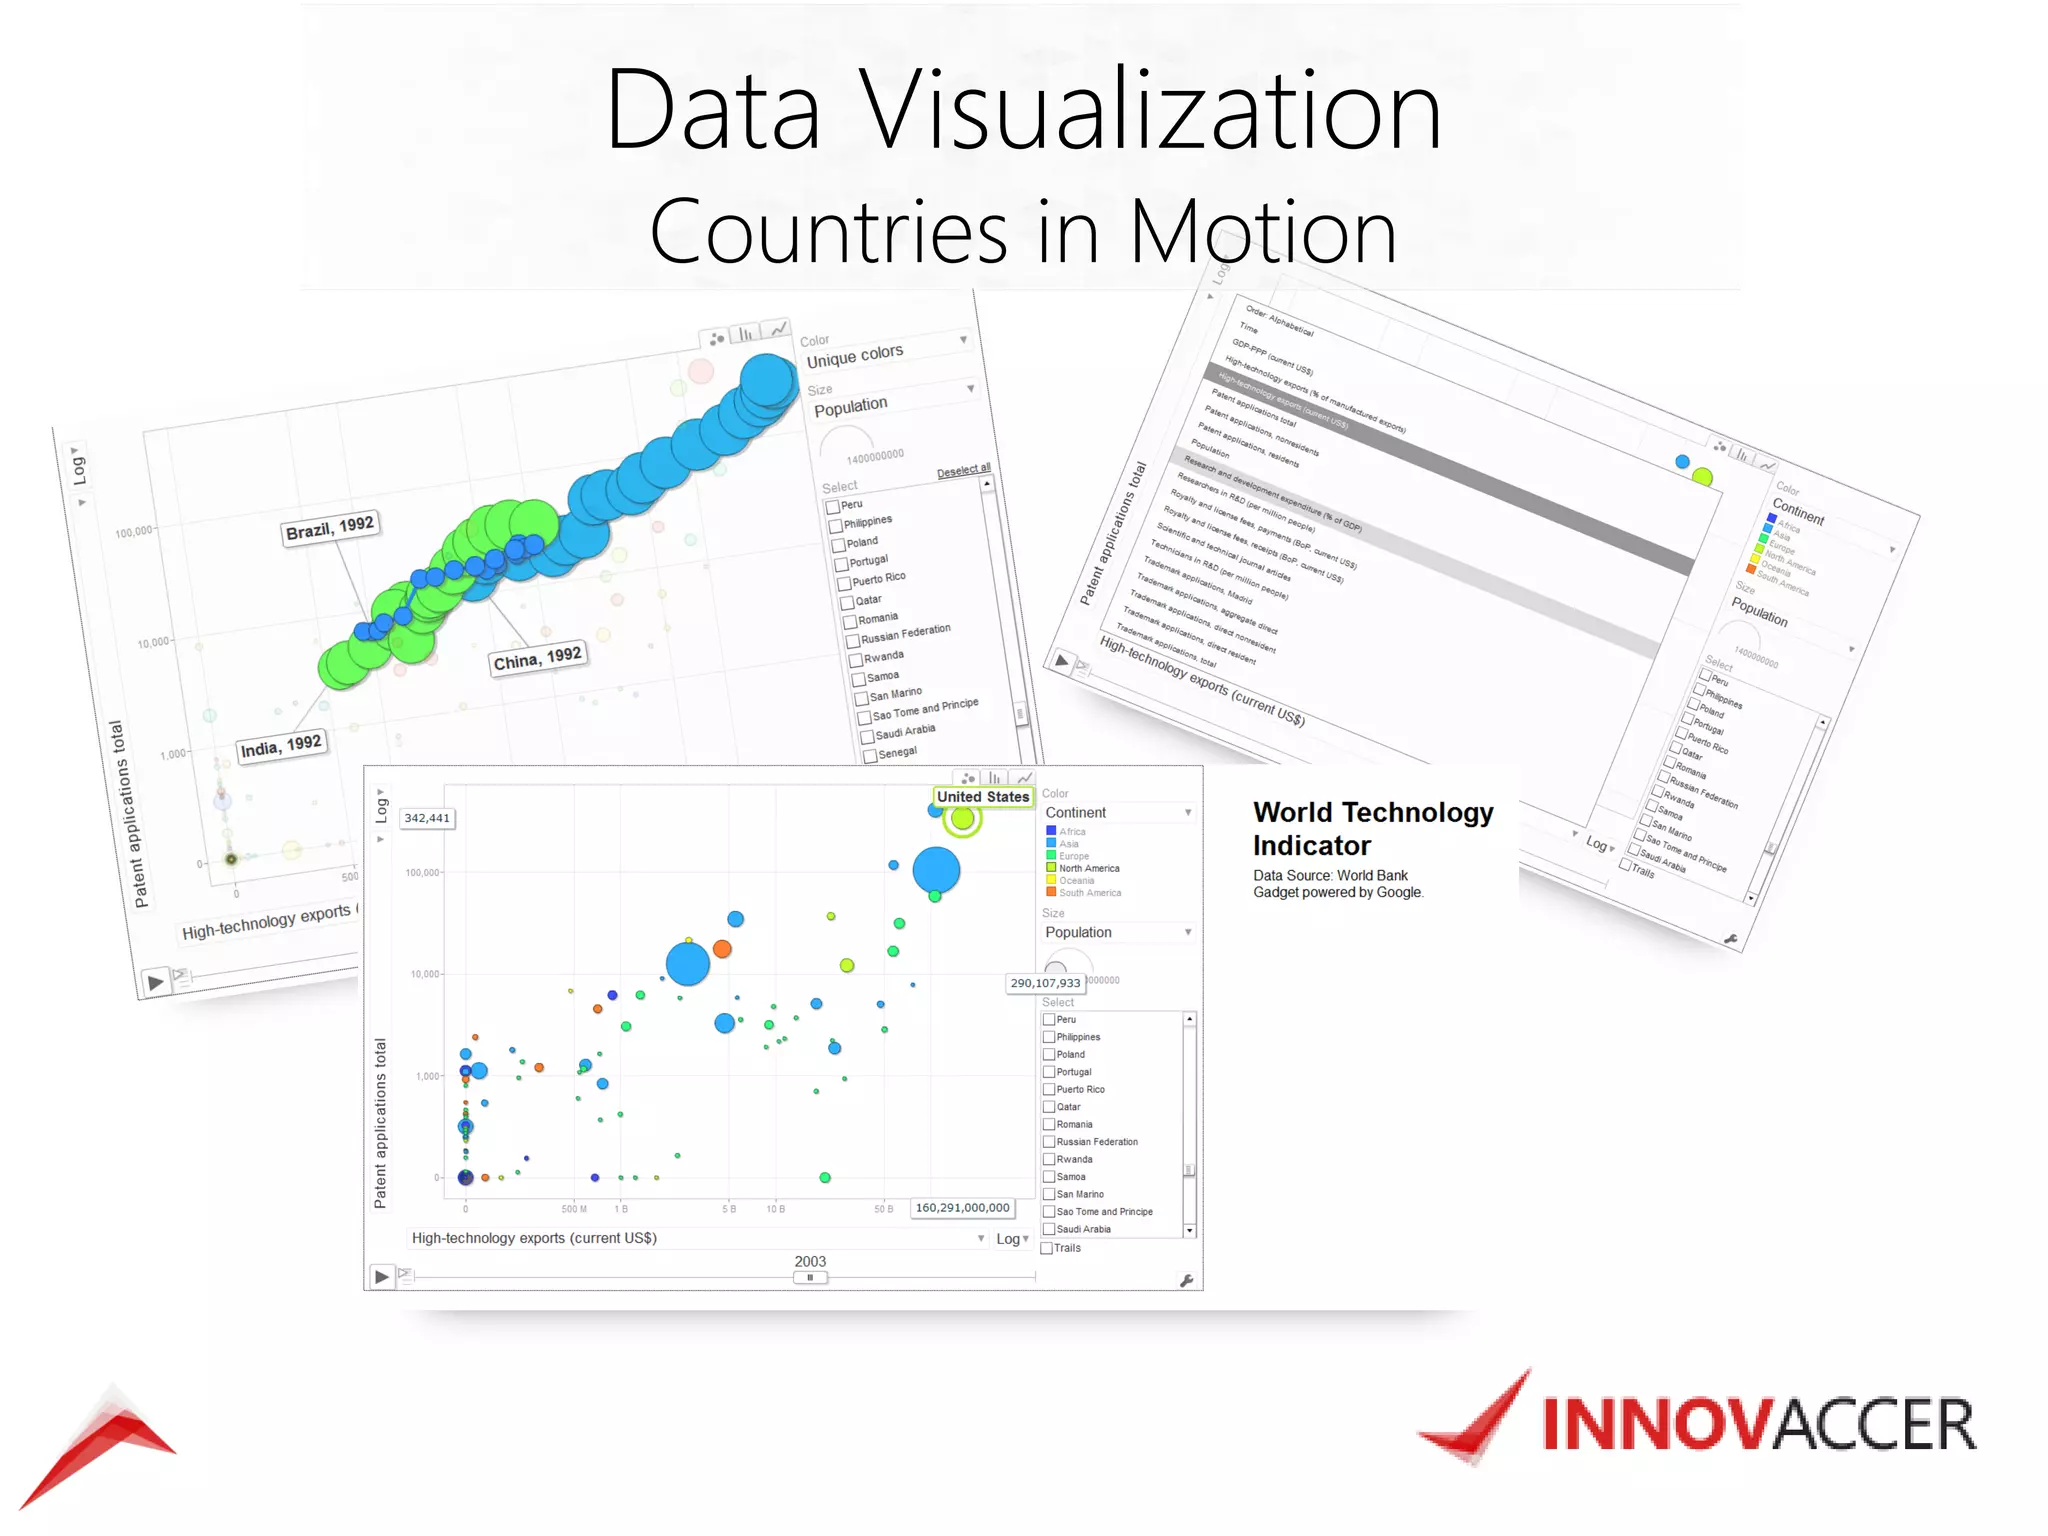
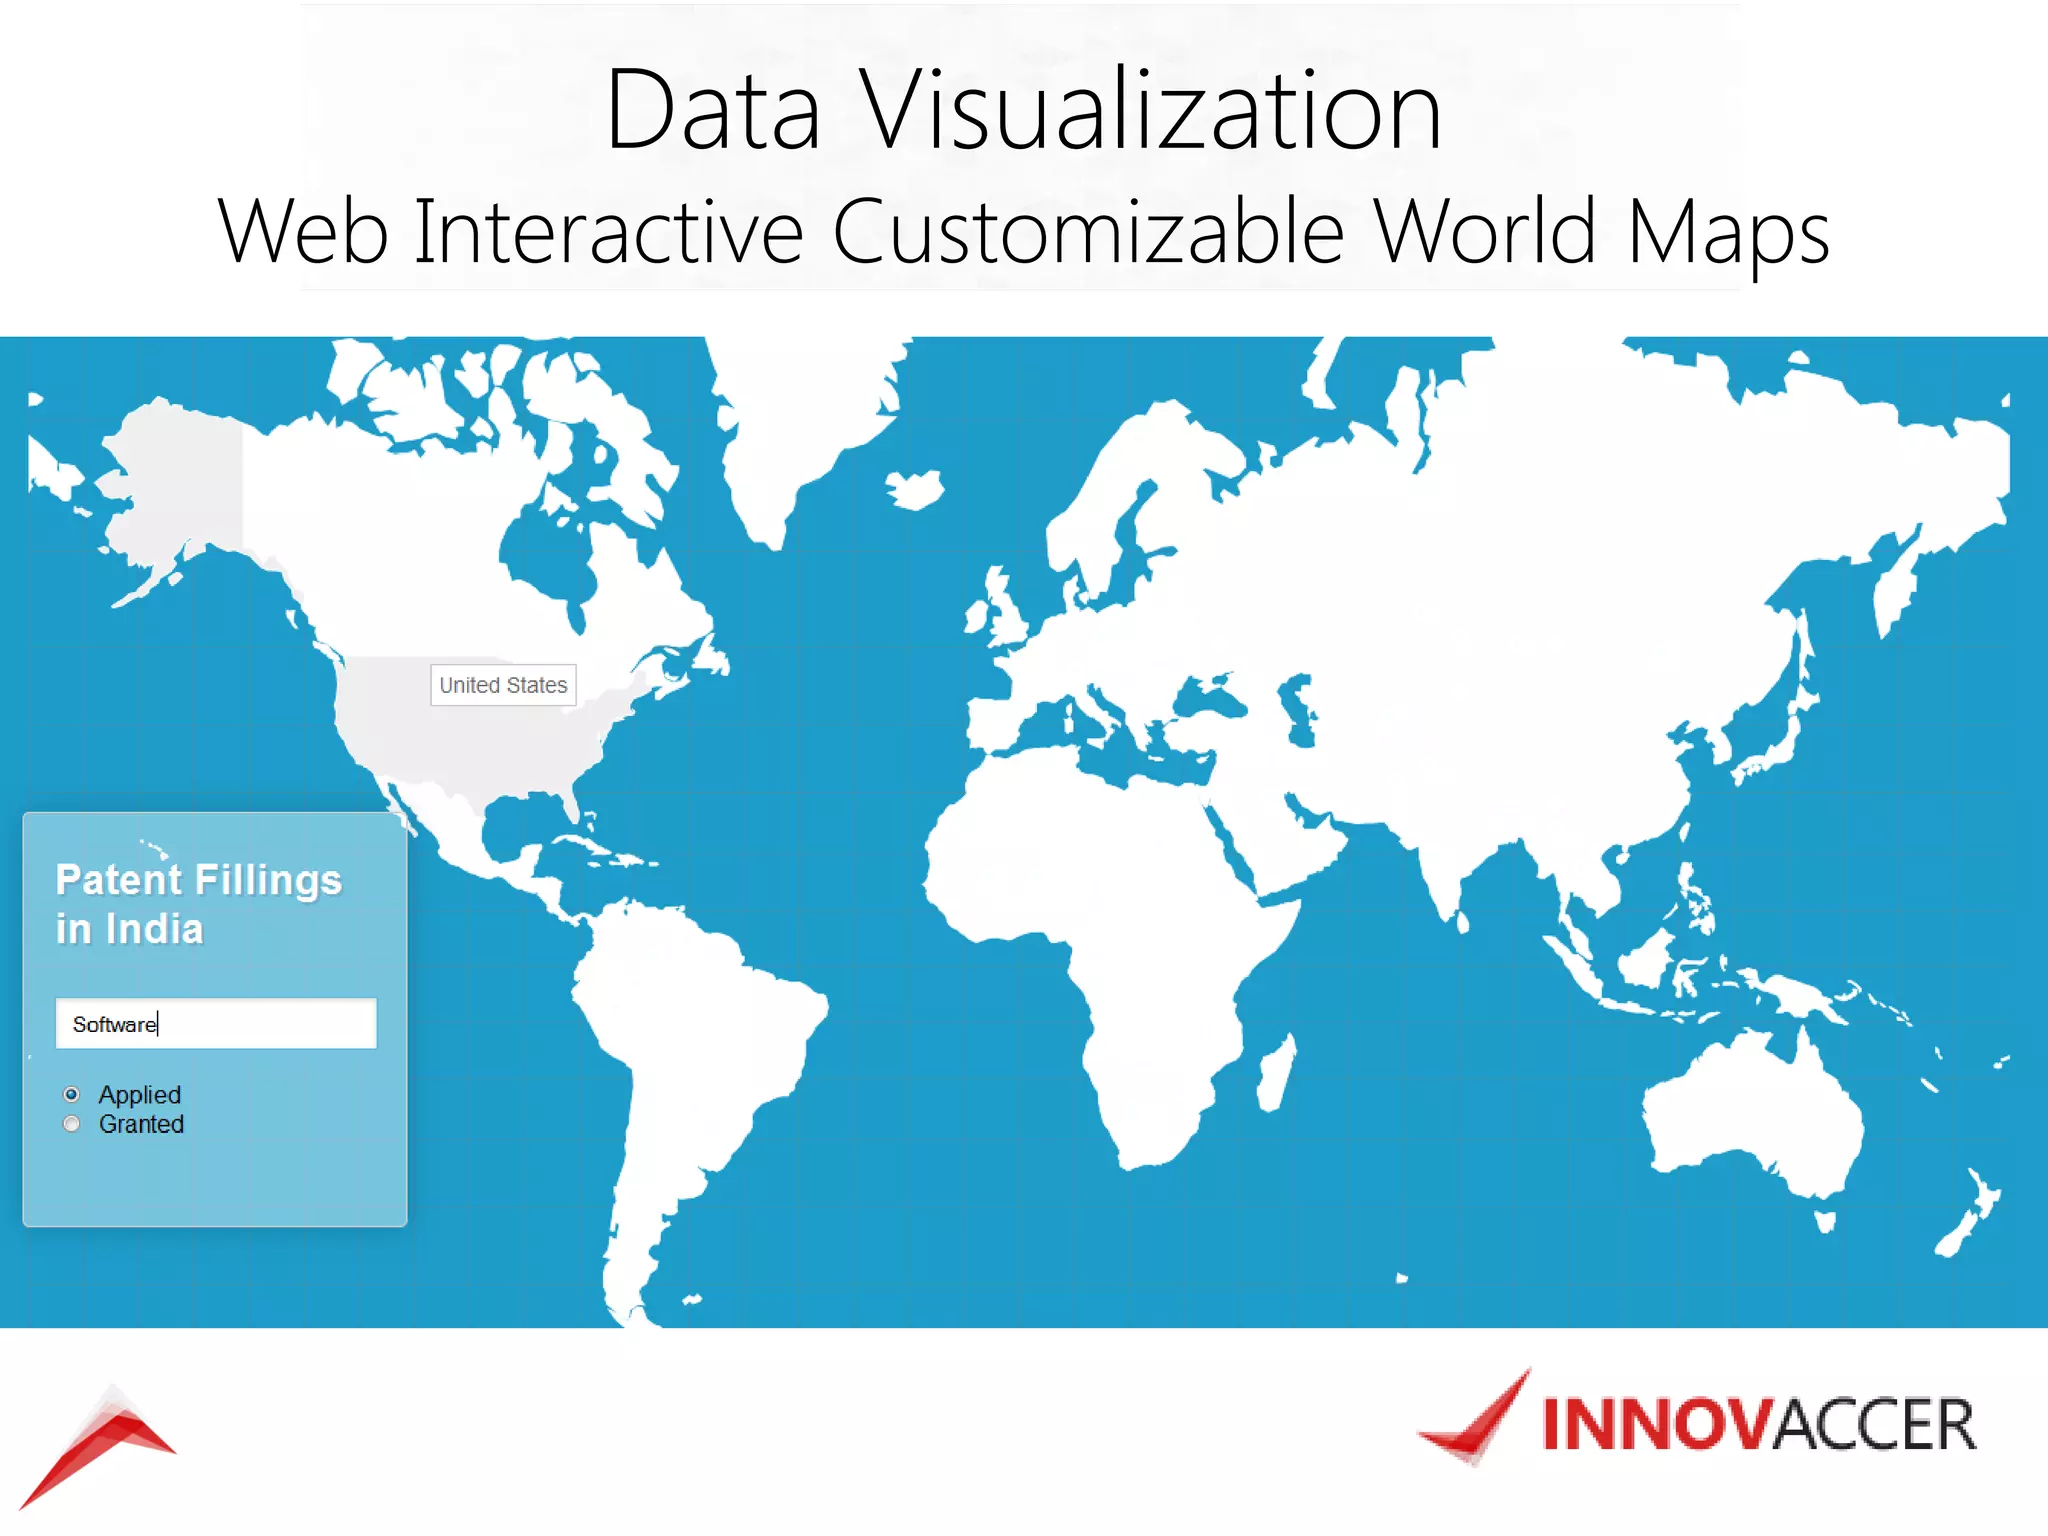

The document outlines various data mining and analysis projects undertaken by a team of data experts to create actionable insights from diverse datasets, including Indian patent data, CEO compensation, earning conference calls, and hospital readmission rates. It describes the automation of data harvesting, cleaning, and statistical modeling, as well as the use of technologies like Hadoop and custom applications for efficient data processing and visualization. Additionally, the document highlights the implementation of cloud-based solutions for mobile surveys and email campaigns to enhance data collection and dissemination efficiency.


![Big Data [sorry] & Data Science: What Does a Data Scientist Do?](https://cdn.slidesharecdn.com/ss_thumbnails/dslatcloudmsevent20130125-130126065651-phpapp01-thumbnail.jpg?width=640&height=640&fit=bounds)
![Data Analytics Life Cycle [EMC² - Data Science and Big data analytics]](https://cdn.slidesharecdn.com/ss_thumbnails/bdalifecycle-slideshare-211028070344-thumbnail.jpg?width=640&height=640&fit=bounds)


![Vibe Coding vs. Spec-Driven Development [Free Meetup]](https://cdn.slidesharecdn.com/ss_thumbnails/vibecodingvsspecdrivendevelopment-251209105622-43f455e7-thumbnail.jpg?width=640&height=640&fit=bounds)


