Download to read offline


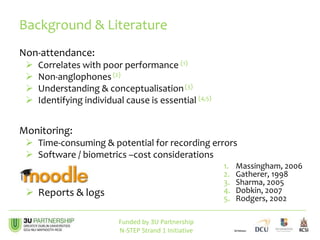
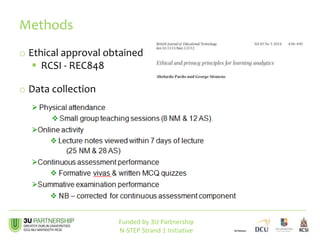
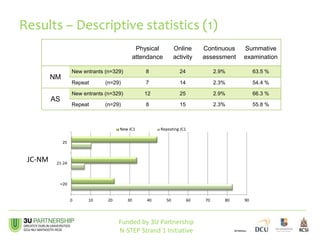
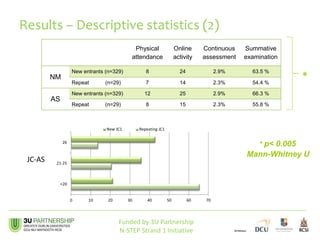
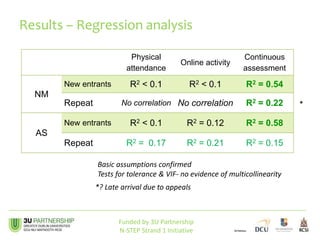
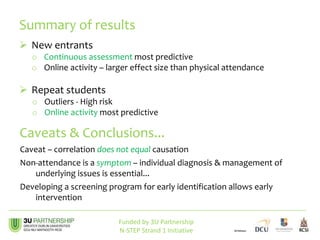

This study examined the relationships between attendance, online engagement, and assessment outcomes in undergraduate students across multiple universities. The study found that continuous assessment was the most predictive of outcomes for new entrants, while online activity was most predictive for repeating students. For new entrants, online activity had a larger effect size than physical attendance. The study noted that non-attendance is a symptom and that identifying underlying individual issues is essential to allow for early intervention.


