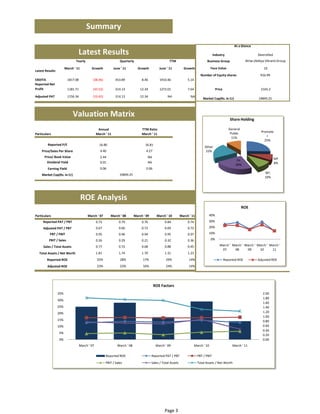
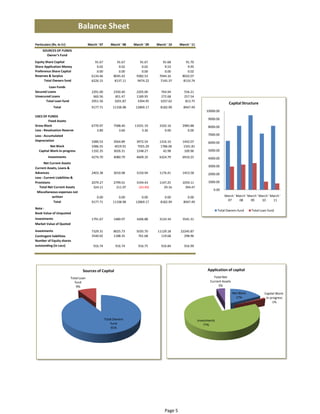
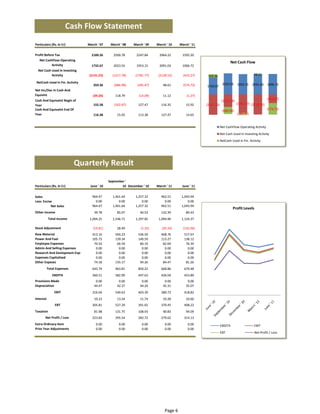
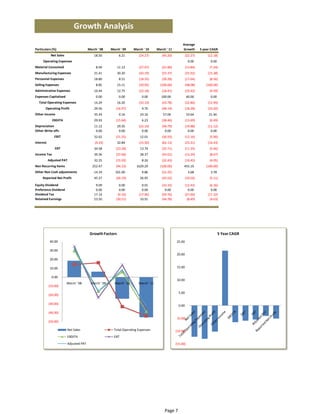
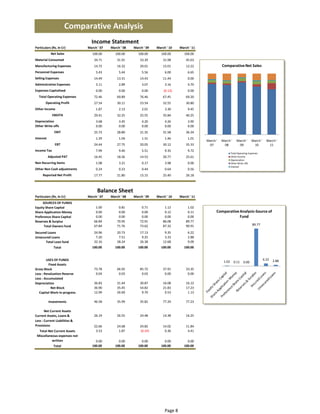
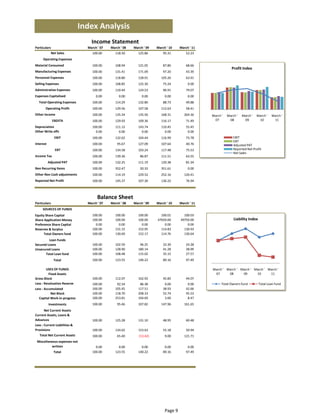
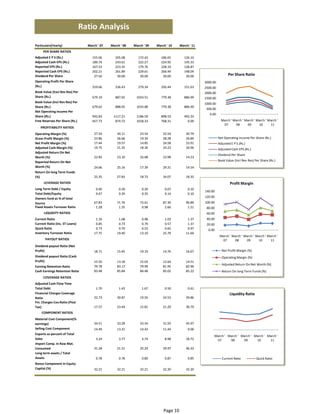
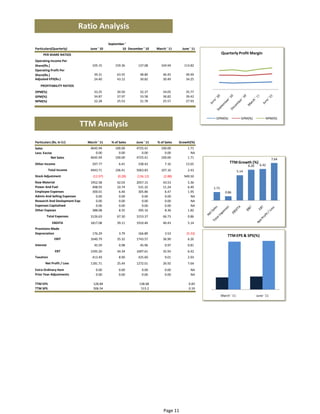
gtÇtç eÉç XåvÄâá|äx

                                           COMPANY FINALYTICS


                                        Grasim Industries Ltd


                Exclusive Financial Analysis of Indian Companies


                                                   Prepared and Edited By‐
                                                      Tanay Roy, CFA
                                                      Peu Karak, MBA


                                                                 Disclaimer

 The information, opinions, estimates and forecasts contained in this document have been arrived at or obtained from public sources believed 
 to be reliable and in good faith which has not been independently verified and no warranty, express or implied, is made as to their accuracy, 
                                                        completeness or correctness. 


      For more information about this sample and our other services, please write to tanay.roy2008@gmail.com


                                         Monday, September 19, 2011
Description                                Page

                     Summary                                                          3
                                      Latest Result                                   3
                                      Valuation Matrix                                3
                                      ROE Analysis                                    3

                     Income Statement                                                 4

                     Balance Sheet                                                    5

                     Cashflow Statement                                               6

                     Quarterly Result                                                 6

                     Growth Analysis                                                  7

                     Comparative Analysis                                             8
                                   Income Statement                                   8
                                   Balance Sheet                                      8

                     Index Analysis                                                   9
                                      Income Statement                                9
                                      Balance Sheet                                   9

                     Ratio Analysis                                                  10
                                      Annual                                         10
                                      Quarterly                                      11

                     TTM Analysis                                                    11

                     Technical Analysis                                              12
CONTENT


                                             About Tanay & Peu
          Our passion lies in the field of financial research & Investment management and we intend to apply 
          our knowledge gained over a period of years through intense study and keen observation of the 
          nuances of financial markets and instruments to real life scenarios. We possess expert knowledge of 
          financial products and markets as evidenced by top notch qualifications earned by us , all in the first 
          attempt and keep ourselves abreast with the latest happenings and innovations taking place in 
          financial landscape.

          1. Expertise in Portfolio Management, Product optimization, Product performance Analysis, Financial 
          Reporting/ Planning, Cash Flow Analysis, Ratio Analysis, Budgeting, Forecasting, Mergers & 
          Acquisition and knowledge of GAAP/ IFRS
          2. Possess Strong Financial Modeling skills including DCF, LBO and other techniques. Possess ability to 
          research all asset classes in a broad range of industries and geographies.
          3. Strong equity research, finance, accounting and advisory and assurance experience
          4. Expertise in Technical analysis, fundamental analysis, developing trading systems.
          5. Conduct in‐depth financial analysis of company financials.
          6. Write analytical or trend based reports on companies, sectors or markets.
          7. Expert level application in Bloomberg, Thomson Banker, Factset, Datastream, StockVal, Merger 
          markets, Reuters Knowledge, Haver Analytics, Factiva, PackHedge,
          8. Building Excel/VBA based customized tools to perform detailed analysis.


                                          Contact Us: tanay.roy2008@gmail.com


                                                  Page 2
Summary

                                                                                                                                                            At a Glance

                                 Latest Results                                                                                           Industry                           Diversified
                               Yearly                            Quarterly                            TTM                           Business Group                   Birlas (Aditya Vikram) Group

                        March ' 11         Growth            June ' 11        Growth          June ' 11           Growth                 Face Value                              10
Latest Results
                                                                                                                               Number of Equity shares                         916.99
EBDITA                   1817.08            (38.46)           453.89           (28.58)        1910.46                5.14
Reported Net 
Profit                   1181.71            (43.52)           314.13           (20.58)        1272.01                7.64                     Price                            2298.2

Adjusted PAT             1156.34            (10.45)           314.13           (20.58)              NA                 NA
                                                                                                                                 Market Cap(Rs. In Cr)                        21068.52


                             Valuation Matrix                                                                                                             Share Holding

                                                 Annual                          TTM Ratio                                                               General 
                                                                                                                                                          Public               Promote
Particulars                                     March ' 11                       March ' 11
                                                                                                                                                           11%                    r
                                                                                                                                                                                 25%
        Reported P/E                              17.83                            17.84
                                                                                                                                  Other
    Price/Sales Per Share                         4.67                              4.54                                           22%
      Price/ Book Value                           2.59                               NA                                                                                                    MF
        Dividend Yield                                                                                                                                        FII
                                                  0.01                               NA                                                                                                    8%
                                                                                                                                                             24%
        Earning Yield                             0.06                              0.06
                                                                 21068.52                                                                                                         BFI
    Market Cap(Rs. In Cr)
                                                                                                                                                                                  10%


                                     ROE Analysis
                                                                                                                                                                    ROE
Particulars                             March ' 07        March ' 08        March ' 09      March ' 10          March ' 11           40%
     Reported PAT / PBT                         0.73             0.79            0.76              0.84              0.74            30%

     Adjusted PAT / PBT                         0.67             0.66            0.72              0.69              0.72            20%

          PBT / PBIT                            0.95             0.96            0.94              0.95              0.97            10%

         PBIT / Sales                           0.26             0.29            0.21              0.32              0.36                0%

     Sales / Total Assets                       0.77             0.72            0.68              0.88              0.45                        March '  March '  March '  March '  March ' 
                                                                                                                                                  07       08       09       10       11
  Total Assets / Net Worth                      1.81             1.74            1.70              1.31              1.23
        Reported ROE                            25%              28%              17%              29%                14%                             Reported ROE           Adjusted ROE
        Adjusted ROE                            23%              23%              16%              24%                14%


                                                                                           ROE Factors
                 2.00                                                                                                                                                            35%
                 1.80
                                                                                                                                                                                 30%
                 1.60
                 1.40                                                                                                                                                            25%
                 1.20                                                                                                                                                            20%
                 1.00
                 0.80                                                                                                                                                            15%
                 0.60                                                                                                                                                            10%
                 0.40
                                                                                                                                                                                 5%
                 0.20
                 0.00                                                                                                                                                            0%
                                   March ' 07                  March ' 08                   March ' 09                      March ' 10                      March ' 11

                                                       Reported ROE                      Reported PAT / PBT                  PBT / PBIT
                                                       PBIT / Sales                      Sales / Total Assets                Total Assets / Net Worth


                                                                                                  Page 3
Income Statement
Particulars (Rs. In Cr)                  March ' 07    March ' 08        March ' 09         March ' 10    March ' 11
            Net Sales                     8643.24         10241.97           10877.98        8238.05       4514.59
      Operating Expenses
Material Consumed                         3000.40           3268.70           3632.04        2634.43       2060.09
Manufacturing Expenses                    1271.96           1671.44           2176.25        1236.38         551.85
Personnel Expenses                          469.40           557.67            605.12          494.10        300.01                         Operating Income
Selling Expenses                          1252.64           1363.53           1569.50          942.51          0.00
                                                                                                                              12000.00 
Adminstrative Expenses                      268.40           296.43            334.23          260.11        212.23
Expenses Capitalised                          0.00             0.00              0.00          (10.67)         0.00           10000.00 

  Total Operating Expenses                6262.80           7157.77           8317.14        5556.86       3124.18
                                                                                                                               8000.00 
       Operating Profit                   2380.44           3084.20           2560.84        2681.19       1390.41
Other Income                                161.40           218.44            218.80          271.66        426.67            6000.00 
             EBDITA                       2541.84           3302.64           2779.64        2952.85       1817.08
                                                                                                                               4000.00 
Depreciation                                317.91           353.27            456.97          351.14        176.29
Other Write offs                              0.00             0.00              0.00            0.00          0.00
                                                                                                                               2000.00 
               EBIT                       2223.93           2949.37           2322.67        2601.71       1640.79
Interest                                    111.84           107.00            142.14          120.39         45.59                 0.00 
               EBT                        2112.09           2842.37           2180.53        2481.32       1595.20                          March March March March March 
                                                                                                                                             ' 07 ' 08 ' 09 ' 10 ' 11
Income Tax                                  690.55           962.33            599.88          770.05        438.86
           Adjusted PAT                   1421.54           1880.04           1580.65        1711.27       1156.34               Net Sales      Operating Profit   EBDITA
Non Recurring Items                          93.20           328.50             18.95          327.70          0.00
Other Non Cash adjustments                   21.07            24.06             48.36           53.13         25.37
     Reported Net Profit                  1535.81           2232.60           1647.96        2092.10       1181.71


Equity Dividend                            252.10            275.02            275.02         275.05         183.40
Preference Dividend                          0.00              0.00              0.00           0.00           0.00
Dividend Tax                                35.36             41.42             41.38          33.95          13.66
Retained Earnings                         1248.35           1916.16           1331.56        1783.10         984.65


                                          Profit Levels                                                                       Total Income Break‐up
       3500.00 
                                                                                                                 Total Operating Expenses      Depreciation

       3000.00                                                                                                   Other Write offs              Interest
                                                                                                                 Income Tax                    Adjusted PAT
       2500.00 

       2000.00 

       1500.00 
                                                                                                                              23%

       1000.00 

        500.00 
                                                                                                                         9%
            0.00                                                                                                          1%                              63%
                                                                                                                          0%
                                                                                                                           4%
                       March ' 07   March ' 08   March ' 09    March ' 10      March ' 11

                      Operating Profit       EBDITA                   EBIT
                      EBT                    Adjusted PAT


                                                                                                 Page 4
Balance Sheet
Particulars (Rs. In Cr)                 March ' 07       March ' 08    March ' 09   March ' 10    March ' 11
     SOURCES OF FUNDS 
       Owner's Fund 
Equity Share Capital                        91.67            91.67        91.67        91.68         91.70
Share Application Money                      0.02             0.02         0.02         9.53          9.95
Preference Share Capital                     0.00             0.00         0.00         0.00          0.02
Reserves & Surplus                        6134.46          8045.42      9382.53      7044.16       8032.07
      Total Owners fund                   6226.15           8137.11      9474.22      7145.37       8133.74 
         Loan Funds 
Secured Loans                             2291.00          2350.40      2205.00       764.94         556.21
Unsecured Loans                            660.56           851.47      1189.95       272.68         257.54
       Total Loan fund                    2951.56           3201.87      3394.95      1037.62         813.75 
                                                                                                                                      Capital Structure
             Total                        9177.71         11338.98      12869.17      8182.99       8947.49 
                                                                                                                     10000.00 
USES OF FUNDS 
                                                                                                                       9000.00 
          Fixed Assets 
Gross Block                               6770.97          7588.40     11031.19      3102.16       2983.88             8000.00 
Less : Revaluation Reserve                   3.89             3.60         3.36         0.00          0.00
Less : Accumulated                                                                                                     7000.00 
Depreciation                              3380.53          3564.89      3972.54      1316.10       1442.07             6000.00 
          Net Block                       3386.55           4019.91      7055.29      1786.06       1541.81 
  Capital Work‐in‐progress                1192.35          3026.31      1248.27        42.98        100.96             5000.00 
         Investments                      4274.70          4080.79      4609.10      6324.79       6910.25             4000.00 
       Net Current Assets 
                                                                                                                       3000.00 
Current Assets, Loans & 
Advances                                  2403.38          3010.98      3150.94      1176.41       1453.58             2000.00 
Less : Current Liabilities & 
Provisions                                2079.27          2799.01      3194.43      1147.25       1059.11             1000.00 
   Total Net Current Assets                324.11            211.97      (43.49)        29.16        394.47 
                                                                                                                          0.00 
 Miscellaneous expenses not 
            written                          0.00            0.00          0.00         0.00          0.00                         March ' March ' March ' March ' March ' 
             Total                        9177.71         11338.98      12869.17      8182.99       8947.49                         07      08      09      10      11

Note : 
                                                                                                                               Total Owners fund       Total Loan fund
Book Value of Unquoted 
Investments                               1791.67          1480.97      1606.88      3124.34       3541.31
Market Value of Quoted 
Investments                               7329.31          8025.73      5035.70     11129.18      22245.87
Contingent liabilities                    3540.02          1188.35       761.68       119.68        298.96
Number of Equity shares 
outstanding (in Lacs)                      916.74           916.74        916.75       916.84        916.99


                                  Sources of Capital                                                                  Application of capital
                          Total Loan                                                                                      Total Net 
                            fund                                                                                        Current Assets 
                             9%                                                                                              5%

                                                                                                                                          Net Block            Capital Work‐
                                                                                                                                            17%                 in‐progress 
                                                                                                                                                                    1%


                                                     Total Owners                                               Investments 
                                                         fund                                                       77%
                                                         91%


                                                                                         Page 5
Cash Flow Statement
Particulars (Rs. In Cr)           March ' 07    March ' 08   March ' 09    March ' 10    March ' 11

Profit Before Tax                   2189.26       2964.22      2247.84      2500.78       1595.20
   Net CashFlow‐Operating 
                                                                                                                        Net Cash Flow
            Activity                1732.67       2091.03      1953.15      2023.55       1006.72
  Net Cash Used In Investing 
           Activity                (2131.23)     (2128.52)     (1781.77)    (1217.78)      (433.27)                48.61 
                                                                                                       359.36 
 NetCash Used in Fin. Activity                                                                                                   2023.55  1006.72 
                                     359.36         48.61       (185.47)     (686.98)      (574.72)   1732.67  2091.03  1953.15 
Net Inc/Dec In Cash And 
Equivlnt                             (39.20)        11.12        (14.09)      118.79         (1.27)
Cash And Equivalnt Begin of                                                                                                                          (433.27)
                                                                                                                                         (1217.78)
Year                                 155.58        116.35       127.47       (102.87)        15.92    (2131.23) (2128.52) (1781.77)
Cash And Equivalnt End Of                                                                                                                (686.98) (574.72)
Year                                 116.38        127.47       113.38         15.92         14.65                            (185.47)


                                                                                                                 Net CashFlow‐Operating Activity 
                                                                                                                 Net Cash Used In Investing Activity 
                                                                                                                 NetCash Used in Fin. Activity 


                            Quarterly Result
                                               September ' 
Particulars (Rs. In Cr)            June ' 10           10 December ' 10    March ' 11     June ' 11


Sales                                964.47        962.51      1,257.32     1,461.64      1,043.94
Less: Excise                           0.00          0.00          0.00         0.00          0.00
           Net Sales                 964.47        962.51      1,257.32     1,461.64      1,043.94
                                                                                                                            Profit Levels
Other Income                          39.78        132.39         40.53        85.07         80.43
            Total Income           1,004.25      1,094.90      1,297.85     1,546.71      1,124.37

Stock Adjustment                     (19.81)       (20.33)        (1.32)       28.49       (142.96)
Raw Material                         413.10        408.76       536.50        594.22        517.67
Power And Fuel                       105.73        113.27       140.59        139.34        138.12
Employee Expenses                     70.54         82.69        80.19         66.59         76.39
Admin And Selling Expenses             0.00          0.00         0.00          0.00          0.00
Research And Devlopment Expe           0.00          0.00         0.00          0.00          0.00
Expenses Capitalised                   0.00          0.00         0.00          0.00          0.00
Other Expeses                         74.18         84.47        94.26        135.17         81.26
        Total Expenses               643.74        668.86       850.22        963.81        670.48
              EBDITA                 360.51        426.04       447.63        582.90        453.89
Provisions Made                        0.00          0.00          0.00         0.00          0.00
Depreciation                          44.47         45.31         44.24        42.27         35.07
               EBIT                  316.04        380.73       403.39        540.63        418.82
Interest                              10.23         10.28         11.74        13.34         10.60
                EBT                  305.81        370.45       391.65        527.29        408.22
Taxation                              81.98         90.83       108.93        131.75         94.09
       Net Profit / Loss             223.83        279.62       282.72        395.54        314.13
Extra Ordinary Item                    0.00          0.00          0.00         0.00          0.00               EBDITA                     EBIT
Prior Year Adjustments                 0.00          0.00          0.00         0.00          0.00
                                                                                                                 EBT                        Net Profit / Loss 


                                                                                Page 6
Growth Analysis
                                                                                                      Average 
Particulars (%)                        March ' 08    March ' 09     March ' 10      March ' 11        Growth       5 year CAGR
            Net Sales                      18.50          6.21         (24.27)         (45.20)         (22.27)         (12.18)
     Operating Expenses                                                                                     0.00         0.00
Material Consumed                           8.94         11.12         (27.47)         (21.80)         (13.84)           (7.24)
Manufacturing Expenses                     31.41         30.20         (43.19)         (55.37)         (25.92)         (15.38)
Personnel Expenses                         18.80          8.51         (18.35)         (39.28)         (17.64)           (8.56)
Selling Expenses                            8.85         15.11         (39.95)        (100.00)         (48.08)        (100.00)
Adminstrative Expenses                     10.44         12.75         (22.18)         (18.41)         (10.42)           (4.59)
Expenses Capitalised                        0.00          0.00           0.00          100.00              40.00         0.00
  Total Operating Expenses                 14.29         16.20         (33.19)         (43.78)         (22.80)         (12.99)
       Operating Profit                    29.56        (16.97)          4.70          (48.14)         (18.28)         (10.20)
Other Income                               35.34          0.16          24.16           57.06              33.64        21.46
             EBDITA                        29.93        (15.84)          6.23          (38.46)         (13.69)           (6.49)
Depreciation                               11.12         29.35         (23.16)         (49.79)         (19.88)         (11.12)
Other Write offs                            0.00          0.00           0.00            0.00            0.00            0.00
               EBIT                        32.62        (21.25)         12.01          (36.93)         (12.16)           (5.90)
Interest                                   (4.33)        32.84         (15.30)         (62.13)         (23.31)         (16.43)
               EBT                         34.58        (23.28)         13.79          (35.71)         (11.35)           (5.46)
Income Tax                                 39.36        (37.66)         28.37          (43.01)         (12.29)           (8.67)
           Adjusted PAT                    32.25        (15.92)          8.26          (32.43)         (10.45)           (4.05)
Non Recurring Items                       252.47        (94.23)      1629.29          (100.00)         455.19         (100.00)
Other Non Cash adjustments                 14.19        101.00           9.86          (52.25)              3.68         3.78
     Reported Net Profit                   45.37        (26.19)         26.95          (43.52)         (10.02)           (5.11)
Equity Dividend                             9.09          0.00           0.01          (33.32)         (12.42)          (6.16)
Preference Dividend                         0.00          0.00           0.00            0.00            0.00            0.00
Dividend Tax                               17.14         (0.10)        (17.96)         (59.76)         (27.60)         (17.32)
Retained Earnings                          53.50        (30.51)         33.91          (44.78)          (8.49)          (4.63)


                                        Growth Factors                                                                          5 Year CAGR
            40.00                                                                                25.00 

            30.00 
                                                                                                 20.00 
            20.00 

            10.00                                                                                15.00 

             0.00 
                                                                                                 10.00 
                        March ' 08      March ' 09     March ' 10      March ' 11
           (10.00)
                                                                                                   5.00 
           (20.00)

           (30.00)                                                                                 0.00 

           (40.00)
                                                                                                  (5.00)
           (50.00)

                        Net Sales                      Total Operating Expenses                  (10.00)
                        EBDITA                         EBT
                        Adjusted PAT                                                             (15.00)


                                                                                         Page 7
Comparative Analysis
                                  Income Statement
Particulars (Rs. In Cr)         March ' 07   March ' 08   March ' 09   March ' 10    March ' 11
            Net Sales              100.00       100.00       100.00       100.00        100.00
Material Consumed                   34.71        31.91        33.39        31.98         45.63
Manufacturing Expenses              14.72        16.32        20.01        15.01         12.22             Comparative Net Sales
Personnel Expenses                   5.43         5.44         5.56         6.00          6.65
Selling Expenses                    14.49        13.31        14.43        11.44          0.00
Adminstrative Expenses               3.11         2.89         3.07         3.16          4.70
Expenses Capitalised                 0.00         0.00         0.00        (0.13)         0.00
  Total Operating Expenses          72.46        69.89        76.46        67.45         69.20
       Operating Profit             27.54        30.11        23.54        32.55         30.80
Other Income                         1.87         2.13         2.01         3.30          9.45
             EBDITA                 29.41        32.25        25.55        35.84         40.25
Depreciation                         3.68         3.45         4.20         4.26          3.90
Other Write offs                     0.00         0.00         0.00         0.00          0.00
               EBIT                 25.73        28.80        21.35        31.58         36.34
Interest                             1.29         1.04         1.31         1.46          1.01
                                                                                                  March '  March '    March '  March '  March ' 
               EBT                  24.44        27.75        20.05        30.12         35.33     07       08         09       10       11
Income Tax                           7.99         9.40         5.51         9.35          9.72
                                                                                                                 Total Operating Expenses
           Adjusted PAT             16.45        18.36        14.53        20.77         25.61                   Other Income
                                                                                                                 Depreciation
Non Recurring Items                  1.08         3.21         0.17         3.98          0.00                   Other Write offs
                                                                                                                 Interest
Other Non Cash adjustments           0.24         0.23         0.44         0.64          0.56
     Reported Net Profit            17.77        21.80        15.15        25.40         26.18


                                      Balance Sheet
Particulars (Rs. In Cr)         March ' 07   March ' 08   March ' 09   March ' 10    March ' 11
     SOURCES OF FUNDS 
Equity Share Capital                 1.00         0.81         0.71         1.12          1.02
Share Application Money              0.00         0.00         0.00         0.12          0.11          Comparative Analysis‐Source of 
Preference Share Capital             0.00         0.00         0.00         0.00          0.00                      Fund
Reserves & Surplus                  66.84        70.95        72.91        86.08         89.77
      Total Owners fund             67.84        71.76        73.62        87.32         90.91                                      89.77 

Secured Loans                       24.96        20.73        17.13         9.35          6.22
Unsecured Loans                      7.20         7.51         9.25         3.33          2.88
       Total Loan fund              32.16        28.24        26.38        12.68          9.09
              Total               100.00       100.00       100.00       100.00        100.00


        USES OF FUNDS                                                                                                                        6.22  2.88 
                                                                                                             1.02  0.11  0.00 
          Fixed Assets 
Gross Block                         73.78        66.92        85.72        37.91         33.35
Less : Revaluation Reserve           0.04         0.03         0.03         0.00          0.00
Less : Accumulated 
Depreciation                        36.83        31.44        30.87        16.08         16.12
           Net Block                36.90        35.45        54.82        21.83         17.23
   Capital Work‐in‐progress         12.99        26.69         9.70         0.53          1.13

           Investments              46.58        35.99        35.82        77.29         77.23

       Net Current Assets 
Current Assets, Loans &             26.19        26.55        24.48        14.38         16.25
Less : Current Liabilities & 
Provisions                          22.66        24.68        24.82        14.02         11.84
  Total Net Current Assets           3.53         1.87        (0.34)        0.36          4.41
 Miscellaneous expenses not 
           written                  0.00         0.00         0.00         0.00          0.00
              Total               100.00       100.00       100.00       100.00        100.00


                                                                            Page 8
Index Analysis
                                    Income Statement
Particulars                       March ' 07   March ' 08   March ' 09   March ' 10    March ' 11
            Net Sales                100.00       118.50       125.86        95.31         52.23
      Operating Expenses
Material Consumed                    100.00       108.94       121.05        87.80         68.66
                                                                                                                Profit Index
Manufacturing Expenses               100.00       131.41       171.09        97.20         43.39
Personnel Expenses                   100.00       118.80       128.91       105.26         63.91
Selling Expenses                     100.00       108.85       125.30        75.24          0.00
Adminstrative Expenses               100.00       110.44       124.53        96.91         79.07
Expenses Capitalised                   0.00         0.00         0.00         0.00          0.00
  Total Operating Expenses           100.00       114.29       132.80        88.73         49.88
       Operating Profit              100.00       129.56       107.58       112.63         58.41
Other Income                         100.00       135.34       135.56       168.31        264.36    March '  March '  March '  March '  March ' 
              EBDITA                 100.00       129.93       109.36       116.17         71.49     07       08       09       10       11
Depreciation                         100.00       111.12       143.74       110.45         55.45
Other Write offs                       0.00         0.00         0.00         0.00          0.00
               EBIT                  100.00       132.62       104.44       116.99         73.78                 EBIT
                                                                                                                 EBT
Interest                             100.00        95.67       127.09       107.64         40.76                 Adjusted PAT
               EBT                   100.00       134.58       103.24       117.48         75.53                 Reported Net Profit 
                                                                                                                 Net Sales
Income Tax                           100.00       139.36        86.87       111.51         63.55
           Adjusted PAT              100.00       132.25       111.19       120.38         81.34
Non Recurring Items                  100.00       352.47        20.33       351.61          0.00
Other Non Cash adjustments           100.00       114.19       229.52       252.16        120.41
Reported Net Profit                  100.00       145.37       107.30       136.22         76.94


                                        Balance Sheet
Particulars                       March ' 07   March ' 08   March ' 09   March ' 10    March ' 11
     SOURCES OF FUNDS 
Equity Share Capital                 100.00       100.00       100.00      100.01        100.03
Share Application Money              100.00       100.00       100.00    47650.00      49750.00                  Liability Index
Preference Share Capital               0.00         0.00         0.00        0.00          0.00
Reserves & Surplus                   100.00       131.15       152.95      114.83        130.93
      Total Owners fund              100.00       130.69       152.17      114.76        130.64
         Loan Funds 
Secured Loans                        100.00       102.59        96.25        33.39         24.28
Unsecured Loans                      100.00       128.90       180.14        41.28         38.99
       Total Loan fund               100.00       108.48       115.02        35.15         27.57
              Total                  100.00       123.55       140.22        89.16         97.49

        USES OF FUNDS                                                                               March '  March '  March '  March '  March ' 
          Fixed Assets                                                                               07       08       09       10       11
Gross Block                          100.00       112.07       162.92        45.82         44.07
Less : Revaluation Reserve           100.00        92.54        86.38         0.00          0.00         Total Owners fund         Total Loan fund
Less : Accumulated                   100.00       105.45       117.51        38.93         42.66
           Net Block                 100.00       118.70       208.33        52.74         45.53
   Capital Work‐in‐progress          100.00       253.81       104.69         3.60          8.47
           Investments               100.00        95.46       107.82       147.96        161.65
     Net Current Assets 
Current Assets, Loans & 
Advances                             100.00       125.28       131.10        48.95         60.48
Less : Current Liabilities & 
Provisions                           100.00       134.62       153.63        55.18         50.94
   Total Net Current Assets          100.00        65.40       (13.42)        9.00        121.71
 Miscellaneous expenses not 
           written                     0.00         0.00         0.00         0.00          0.00
              Total                  100.00       123.55       140.22        89.16         97.49


                                                                              Page 9
Ratio Analysis
Particulars(Yearly)                March ' 07   March ' 08   March ' 09   March ' 10    March ' 11
     PER SHARE RATIOS 
Adjusted E P S (Rs.)                  155.06       205.08       172.42       186.65        126.10
Adjusted Cash EPS (Rs.)               189.74       243.61       222.27       224.95        145.33
Reported EPS (Rs.)                    167.53       223.35       179.76       228.19        128.87
Reported Cash EPS (Rs.)               202.21       261.89       229.61       266.49        148.09
Dividend Per Share                     27.50        30.00        30.00        30.00         20.00                  Per Share Ratio
Operating Profit Per Share 
(Rs.)                                 259.66       336.43       279.34       292.44        151.63
Book Value (Excl Rev Res) Per 
Share (Rs.)                           679.19       887.65     1033.51        779.38        886.99
Book Value (Incl Rev Res) Per 
Share (Rs.)                           679.62       888.05     1033.88        779.38        886.99
Net Operating Income Per 
Share (Rs.)                           942.83     1117.21      1186.59        898.53        492.33
Free Reserves Per Share (Rs.)         657.73      874.72      1018.33        768.31          0.00    March '  March '  March '  March '  March ' 
                                                                                                      07       08       09       10       11
   PROFITABILITY RATIOS 
Operating Margin (%)                   27.54        30.11        23.54        32.54         30.79
Gross Profit Margin (%)                23.86        26.66        19.34        28.28         26.89           Net Operating Income Per Share (Rs.) 
Net Profit Margin (%)                  17.44        19.57        14.85        24.58         23.91           Adjusted E P S (Rs.) 
Adjusted Cash Margin (%)               19.75        21.35        18.36        24.23         26.96           Adjusted Cash EPS (Rs.) 
Adjusted Return On Net 
                                                                                                            Dividend Per Share 
Worth (%)                              22.83        23.10        16.68        23.98         14.23
                                                                                                            Book Value (Incl Rev Res) Per Share (Rs.) 
Reported Return On Net 
Worth (%)                              24.66        25.16        17.39        29.31         14.54
Return On long Term Funds 
(%)                                    25.35        27.83        18.73        34.07         18.35
      LEVERAGE RATIOS                                                                                               Profit Margin
Long Term Debt / Equity                 0.40         0.30         0.30         0.07          0.10
Total Debt/Equity                       0.47         0.39         0.35         0.14          0.10
Owners fund as % of total 
Source                                 67.83        71.76        73.61        87.30         90.89
Fixed Assets Turnover Ratio             1.28         1.35         0.98         2.66          1.51
      LIQUIDITY RATIOS 
Current Ratio                           1.16         1.08         0.98         1.03          1.37
Current Ratio (Inc. ST Loans)           0.85         0.73         0.79         0.57          1.37
Quick Ratio                             0.73         0.70         0.53         0.65          0.97
Inventory Turnover Ratio               17.75        19.40        13.10        25.79         11.60
                                                                                                     March '  March '  March '  March '  March ' 
       PAYOUT RATIOS                                                                                  07       08       09       10       11
Dividend payout Ratio (Net 
Profit)                                18.71        15.45        19.19        14.76         16.67             Net Profit Margin (%) 
Dividend payout Ratio (Cash                                                                                   Operating Margin (%) 
Profit)                                15.50        13.18        15.03        12.64         14.51
                                                                                                              Adjusted Return On Net Worth (%) 
Earning Retention Ratio                79.78        83.17        79.99        81.95         82.96
Cash Earnings Retention Ratio          83.48        85.84        84.48        85.02         85.22             Return On long Term Funds (%) 
     COVERAGE RATIOS 
Adjusted Cash Flow Time 
Total Debt                              1.70         1.43         1.67         0.50          0.61
Financial Charges Coverage                                                                                        Liquidity Ratio
Ratio                                  22.73        30.87        19.56        24.53         39.86
Fin. Charges Cov.Ratio (Post 
Tax)                                   17.57        23.44        15.81        21.29         30.79
    COMPONENT RATIOS 
Material Cost Component(% 
earnings)                              34.51        33.28        33.54        31.93         45.97
Selling Cost Component                 14.49        13.31        14.42        11.44          0.00
Exports as percent of Total 
                                                                                                        March '  March '  March '  March '  March ' 
Sales                                   3.24         3.77         4.74         8.98         18.72        07       08       09       10       11
Import Comp. in Raw Mat. 
Consumed                               31.28        21.31        25.24        39.97         46.33
Long term assets / Total 
Assets                                  0.78         0.78         0.80         0.87          0.85            Current Ratio             Quick Ratio 
Bonus Component In Equity 
Capital (%)                            32.21        32.21        32.21        32.20         32.20


                                                                              Page 10
Ratio Analysis
                                            September ' 
Particulars(Quarterly)          June ' 10           10 December ' 10    March ' 11    June ' 11
      PER SHARE RATIOS                                                                                    Quarterly Profit Margin
Operating Income Per 
Share(Rs.)                        105.15        104.94       137.08        159.36      113.82
Operating Profit Per 
Share(Rs.)                         39.31         46.45        48.80         63.55       49.49
Adjusted EPS(Rs.)                  24.40         30.49        30.82         43.12       34.25
    PROFITABILITY RATIOS 
OPM(%)                             33.25         30.50        32.37         34.05       35.77
GPM(%)                             34.87         37.97        33.58         36.82       39.42
NPM(%)                             22.28         25.53        21.78         25.57       27.93


                                                                                                   OPM(%)                 GPM(%)             NPM(%) 
                            TTM Analysis
Particulars (Rs. In Cr)        March ' 11    % of Sales     June ' 11   % of Sales   Growth(%)
Sales                           4645.94         100.00      4725.41        100.00        1.71
Less: Excise                       0.00           0.00         0.00          0.00          NA
           Net Sales            4645.94         100.00      4725.41        100.00        1.71
                                                                                                                                                   7.64 
Other Income                      297.77          6.41       338.42          7.16       13.65                  TTM Growth (%)
                                                                                                                               6.26      6.42 
            Total Income        4943.71         106.41      5063.83        107.16        2.43                          5.14 
Stock Adjustment                  (12.97)        (0.28)      (136.12)       (2.88)     949.50
Raw Material                    1952.58          42.03      2057.15         43.53        5.36
Power And Fuel                   498.93          10.74       531.32         11.24        6.49     1.71 
Employee Expenses                300.01           6.46       305.86          6.47        1.95               0.86 
Admin And Selling Expenses         0.00           0.00         0.00          0.00          NA
Research And Devlopment Expe       0.00           0.00         0.00          0.00          NA
Expenses Capitalised               0.00           0.00         0.00          0.00          NA
Other Expeses                    388.08           8.35       395.16          8.36        1.82
        Total Expenses          3126.63          67.30      3153.37         66.73        0.86
              EBDITA            1817.08          39.11      1910.46         40.43        5.14
Provisions Made                     0.00          0.00         0.00          0.00           NA
Depreciation                      176.29          3.79       166.89          3.53        (5.33)
                                                                                                              TTM EPS & SPS(%)
               EBIT             1640.79          35.32      1743.57         36.90        6.26
Interest                           45.59          0.98        45.96          0.97        0.81
                EBT             1595.20          34.34      1697.61         35.93        6.42
Taxation                          413.49          8.90       425.60          9.01        2.93
       Net Profit / Loss        1181.71          25.44      1272.01         26.92        7.64
Extra Ordinary Item                 0.00          0.00          0.00         0.00          NA
Prior Year Adjustments              0.00          0.00          0.00         0.00          NA

TTM EPS                           128.84                      138.68                      0.83
TTM SPS                           506.54                       515.2                      0.19

                                                                                                          March ' 11                   June ' 11


                                                                            Page 11
Technical Analysis


                                                            Price Chart
2400.00                                                                                            45000.00
                                                                                                   40000.00
2300.00
                                                                                                   35000.00
2200.00                                                                                            30000.00
                                                                                                   25000.00
2100.00
                                                                                                   20000.00
2000.00                                                                                            15000.00
                                                                                                   10000.00
1900.00
                                                                                                   5000.00
1800.00                                                                                            0.00
          26‐May                                                               4‐Aug

                                           Volume         Close           EMA(200)       EMA(50)


 50.00
   0.00
 ‐50.00
‐100.00


                                                          MACD             Signal line


   100
    80
    60
    40
    20
     0


                                                                     RSI(14)


                             Technical Indicators
      Price             2298.20                AS On:             16/09/2011
      EMA(13)           2185.77                ADX                       11
      EMA(26)           2179.67                DX                        26
      EMA(50)           2207.32                +DI                       24
      EMA(200)          2292.28                ‐DI                       14
      RSI(14)             61.75                %K(Fast)                 100
      MACD                 6.11                %K(Slow)                92.84
      William(%R)          0.00                %d(Slow)                75.58


                                                                      Page 12

Grasim industries ltd

  • 1.
    gtÇtç eÉç XåvÄâá|äx COMPANY FINALYTICS Grasim Industries Ltd Exclusive Financial Analysis of Indian Companies Prepared and Edited By‐ Tanay Roy, CFA Peu Karak, MBA Disclaimer  The information, opinions, estimates and forecasts contained in this document have been arrived at or obtained from public sources believed  to be reliable and in good faith which has not been independently verified and no warranty, express or implied, is made as to their accuracy,  completeness or correctness.  For more information about this sample and our other services, please write to tanay.roy2008@gmail.com Monday, September 19, 2011
  • 2.
    Description Page Summary 3 Latest Result 3 Valuation Matrix 3 ROE Analysis 3 Income Statement 4 Balance Sheet 5 Cashflow Statement 6 Quarterly Result 6 Growth Analysis 7 Comparative Analysis 8 Income Statement 8 Balance Sheet 8 Index Analysis 9 Income Statement 9 Balance Sheet 9 Ratio Analysis 10 Annual 10 Quarterly 11 TTM Analysis 11 Technical Analysis 12 CONTENT About Tanay & Peu Our passion lies in the field of financial research & Investment management and we intend to apply  our knowledge gained over a period of years through intense study and keen observation of the  nuances of financial markets and instruments to real life scenarios. We possess expert knowledge of  financial products and markets as evidenced by top notch qualifications earned by us , all in the first  attempt and keep ourselves abreast with the latest happenings and innovations taking place in  financial landscape. 1. Expertise in Portfolio Management, Product optimization, Product performance Analysis, Financial  Reporting/ Planning, Cash Flow Analysis, Ratio Analysis, Budgeting, Forecasting, Mergers &  Acquisition and knowledge of GAAP/ IFRS 2. Possess Strong Financial Modeling skills including DCF, LBO and other techniques. Possess ability to  research all asset classes in a broad range of industries and geographies. 3. Strong equity research, finance, accounting and advisory and assurance experience 4. Expertise in Technical analysis, fundamental analysis, developing trading systems. 5. Conduct in‐depth financial analysis of company financials. 6. Write analytical or trend based reports on companies, sectors or markets. 7. Expert level application in Bloomberg, Thomson Banker, Factset, Datastream, StockVal, Merger  markets, Reuters Knowledge, Haver Analytics, Factiva, PackHedge, 8. Building Excel/VBA based customized tools to perform detailed analysis. Contact Us: tanay.roy2008@gmail.com Page 2
  • 3.
    Summary At a Glance Latest Results Industry Diversified Yearly Quarterly TTM Business Group Birlas (Aditya Vikram) Group March ' 11 Growth June ' 11 Growth June ' 11 Growth Face Value 10 Latest Results Number of Equity shares  916.99 EBDITA 1817.08 (38.46) 453.89 (28.58) 1910.46 5.14 Reported Net  Profit  1181.71 (43.52) 314.13 (20.58) 1272.01 7.64 Price 2298.2 Adjusted PAT 1156.34 (10.45) 314.13 (20.58) NA NA Market Cap(Rs. In Cr) 21068.52 Valuation Matrix Share Holding Annual TTM Ratio General  Public Promote Particulars March ' 11 March ' 11 11% r 25% Reported P/E 17.83 17.84 Other Price/Sales Per Share 4.67 4.54 22% Price/ Book Value 2.59 NA MF Dividend Yield FII 0.01 NA 8% 24% Earning Yield 0.06 0.06 21068.52 BFI Market Cap(Rs. In Cr) 10% ROE Analysis ROE Particulars March ' 07 March ' 08 March ' 09 March ' 10 March ' 11 40% Reported PAT / PBT 0.73 0.79 0.76 0.84 0.74 30% Adjusted PAT / PBT 0.67 0.66 0.72 0.69 0.72 20% PBT / PBIT 0.95 0.96 0.94 0.95 0.97 10% PBIT / Sales 0.26 0.29 0.21 0.32 0.36 0% Sales / Total Assets 0.77 0.72 0.68 0.88 0.45 March '  March '  March '  March '  March '  07 08 09 10 11 Total Assets / Net Worth 1.81 1.74 1.70 1.31 1.23 Reported ROE 25% 28% 17% 29% 14% Reported ROE Adjusted ROE Adjusted ROE 23% 23% 16% 24% 14% ROE Factors 2.00 35% 1.80 30% 1.60 1.40 25% 1.20 20% 1.00 0.80 15% 0.60 10% 0.40 5% 0.20 0.00 0% March ' 07 March ' 08 March ' 09 March ' 10 March ' 11 Reported ROE Reported PAT / PBT PBT / PBIT PBIT / Sales Sales / Total Assets Total Assets / Net Worth Page 3
  • 4.
    Income Statement Particulars (Rs. In Cr) March ' 07 March ' 08 March ' 09 March ' 10 March ' 11 Net Sales 8643.24 10241.97 10877.98 8238.05 4514.59 Operating Expenses Material Consumed  3000.40 3268.70 3632.04 2634.43 2060.09 Manufacturing Expenses  1271.96 1671.44 2176.25 1236.38 551.85 Personnel Expenses  469.40 557.67 605.12 494.10 300.01 Operating Income Selling Expenses  1252.64 1363.53 1569.50 942.51 0.00 12000.00  Adminstrative Expenses  268.40 296.43 334.23 260.11 212.23 Expenses Capitalised  0.00 0.00 0.00 (10.67) 0.00 10000.00  Total Operating Expenses 6262.80 7157.77 8317.14 5556.86 3124.18 8000.00  Operating Profit 2380.44 3084.20 2560.84 2681.19 1390.41 Other Income 161.40 218.44 218.80 271.66 426.67 6000.00  EBDITA 2541.84 3302.64 2779.64 2952.85 1817.08 4000.00  Depreciation 317.91 353.27 456.97 351.14 176.29 Other Write offs 0.00 0.00 0.00 0.00 0.00 2000.00  EBIT 2223.93 2949.37 2322.67 2601.71 1640.79 Interest 111.84 107.00 142.14 120.39 45.59 0.00  EBT 2112.09 2842.37 2180.53 2481.32 1595.20 March March March March March  ' 07 ' 08 ' 09 ' 10 ' 11 Income Tax 690.55 962.33 599.88 770.05 438.86 Adjusted PAT 1421.54 1880.04 1580.65 1711.27 1156.34 Net Sales Operating Profit EBDITA Non Recurring Items  93.20 328.50 18.95 327.70 0.00 Other Non Cash adjustments  21.07 24.06 48.36 53.13 25.37 Reported Net Profit  1535.81 2232.60 1647.96 2092.10 1181.71 Equity Dividend  252.10 275.02 275.02 275.05 183.40 Preference Dividend  0.00 0.00 0.00 0.00 0.00 Dividend Tax  35.36 41.42 41.38 33.95 13.66 Retained Earnings  1248.35 1916.16 1331.56 1783.10 984.65 Profit Levels Total Income Break‐up 3500.00  Total Operating Expenses Depreciation 3000.00  Other Write offs Interest Income Tax Adjusted PAT 2500.00  2000.00  1500.00  23% 1000.00  500.00  9% 0.00  1% 63% 0% 4% March ' 07 March ' 08 March ' 09 March ' 10 March ' 11 Operating Profit EBDITA EBIT EBT Adjusted PAT Page 4
  • 5.
    Balance Sheet Particulars (Rs. In Cr) March ' 07 March ' 08 March ' 09 March ' 10 March ' 11 SOURCES OF FUNDS  Owner's Fund  Equity Share Capital  91.67  91.67 91.67 91.68 91.70 Share Application Money  0.02  0.02 0.02 9.53 9.95 Preference Share Capital  0.00  0.00 0.00 0.00 0.02 Reserves & Surplus  6134.46  8045.42 9382.53 7044.16 8032.07 Total Owners fund 6226.15  8137.11  9474.22  7145.37  8133.74  Loan Funds  Secured Loans  2291.00  2350.40 2205.00 764.94 556.21 Unsecured Loans  660.56  851.47 1189.95 272.68 257.54 Total Loan fund 2951.56  3201.87  3394.95  1037.62  813.75  Capital Structure Total  9177.71  11338.98  12869.17  8182.99  8947.49  10000.00  USES OF FUNDS  9000.00  Fixed Assets  Gross Block  6770.97  7588.40 11031.19 3102.16 2983.88 8000.00  Less : Revaluation Reserve  3.89  3.60 3.36 0.00 0.00 Less : Accumulated  7000.00  Depreciation  3380.53  3564.89 3972.54 1316.10 1442.07 6000.00  Net Block  3386.55  4019.91  7055.29  1786.06  1541.81  Capital Work‐in‐progress  1192.35  3026.31 1248.27 42.98 100.96 5000.00  Investments  4274.70  4080.79 4609.10 6324.79 6910.25 4000.00  Net Current Assets  3000.00  Current Assets, Loans &  Advances  2403.38  3010.98 3150.94 1176.41 1453.58 2000.00  Less : Current Liabilities &  Provisions  2079.27  2799.01 3194.43 1147.25 1059.11 1000.00  Total Net Current Assets  324.11  211.97  (43.49) 29.16  394.47  0.00  Miscellaneous expenses not  written  0.00  0.00 0.00 0.00 0.00 March ' March ' March ' March ' March '  Total  9177.71  11338.98  12869.17  8182.99  8947.49  07 08 09 10 11 Note :  Total Owners fund Total Loan fund Book Value of Unquoted  Investments  1791.67  1480.97 1606.88 3124.34 3541.31 Market Value of Quoted  Investments  7329.31  8025.73 5035.70 11129.18 22245.87 Contingent liabilities  3540.02  1188.35 761.68 119.68 298.96 Number of Equity shares  outstanding (in Lacs)  916.74  916.74 916.75 916.84 916.99 Sources of Capital Application of capital Total Loan  Total Net  fund Current Assets  9% 5% Net Block  Capital Work‐ 17% in‐progress  1% Total Owners  Investments  fund 77% 91% Page 5
  • 6.
    Cash Flow Statement Particulars (Rs. In Cr) March ' 07 March ' 08 March ' 09 March ' 10 March ' 11 Profit Before Tax  2189.26  2964.22 2247.84 2500.78 1595.20 Net CashFlow‐Operating  Net Cash Flow Activity  1732.67  2091.03 1953.15 2023.55 1006.72 Net Cash Used In Investing  Activity  (2131.23) (2128.52) (1781.77) (1217.78) (433.27) 48.61  359.36  NetCash Used in Fin. Activity  2023.55  1006.72  359.36  48.61 (185.47) (686.98) (574.72) 1732.67  2091.03  1953.15  Net Inc/Dec In Cash And  Equivlnt  (39.20) 11.12 (14.09) 118.79 (1.27) Cash And Equivalnt Begin of  (433.27) (1217.78) Year  155.58  116.35 127.47 (102.87) 15.92 (2131.23) (2128.52) (1781.77) Cash And Equivalnt End Of  (686.98) (574.72) Year  116.38  127.47 113.38 15.92 14.65 (185.47) Net CashFlow‐Operating Activity  Net Cash Used In Investing Activity  NetCash Used in Fin. Activity  Quarterly Result September '  Particulars (Rs. In Cr) June ' 10 10 December ' 10 March ' 11 June ' 11 Sales  964.47 962.51 1,257.32 1,461.64 1,043.94 Less: Excise 0.00 0.00 0.00 0.00 0.00 Net Sales 964.47 962.51 1,257.32 1,461.64 1,043.94 Profit Levels Other Income  39.78 132.39 40.53 85.07 80.43 Total Income 1,004.25 1,094.90 1,297.85 1,546.71 1,124.37 Stock Adjustment  (19.81) (20.33) (1.32) 28.49 (142.96) Raw Material  413.10 408.76 536.50 594.22 517.67 Power And Fuel  105.73 113.27 140.59 139.34 138.12 Employee Expenses  70.54 82.69 80.19 66.59 76.39 Admin And Selling Expenses  0.00 0.00 0.00 0.00 0.00 Research And Devlopment Expe 0.00 0.00 0.00 0.00 0.00 Expenses Capitalised  0.00 0.00 0.00 0.00 0.00 Other Expeses  74.18 84.47 94.26 135.17 81.26 Total Expenses 643.74 668.86 850.22 963.81 670.48 EBDITA 360.51 426.04 447.63 582.90 453.89 Provisions Made  0.00 0.00 0.00 0.00 0.00 Depreciation  44.47 45.31 44.24 42.27 35.07 EBIT 316.04 380.73 403.39 540.63 418.82 Interest  10.23 10.28 11.74 13.34 10.60 EBT 305.81 370.45 391.65 527.29 408.22 Taxation  81.98 90.83 108.93 131.75 94.09 Net Profit / Loss  223.83 279.62 282.72 395.54 314.13 Extra Ordinary Item  0.00 0.00 0.00 0.00 0.00 EBDITA EBIT Prior Year Adjustments  0.00 0.00 0.00 0.00 0.00 EBT Net Profit / Loss  Page 6
  • 7.
    Growth Analysis Average  Particulars (%) March ' 08 March ' 09 March ' 10 March ' 11 Growth 5 year CAGR Net Sales 18.50 6.21 (24.27) (45.20) (22.27) (12.18) Operating Expenses 0.00 0.00 Material Consumed  8.94 11.12 (27.47) (21.80) (13.84) (7.24) Manufacturing Expenses  31.41 30.20 (43.19) (55.37) (25.92) (15.38) Personnel Expenses  18.80 8.51 (18.35) (39.28) (17.64) (8.56) Selling Expenses  8.85 15.11 (39.95) (100.00) (48.08) (100.00) Adminstrative Expenses  10.44 12.75 (22.18) (18.41) (10.42) (4.59) Expenses Capitalised  0.00 0.00 0.00 100.00 40.00 0.00 Total Operating Expenses 14.29 16.20 (33.19) (43.78) (22.80) (12.99) Operating Profit 29.56 (16.97) 4.70 (48.14) (18.28) (10.20) Other Income 35.34 0.16 24.16 57.06 33.64 21.46 EBDITA 29.93 (15.84) 6.23 (38.46) (13.69) (6.49) Depreciation 11.12 29.35 (23.16) (49.79) (19.88) (11.12) Other Write offs 0.00 0.00 0.00 0.00 0.00 0.00 EBIT 32.62 (21.25) 12.01 (36.93) (12.16) (5.90) Interest (4.33) 32.84 (15.30) (62.13) (23.31) (16.43) EBT 34.58 (23.28) 13.79 (35.71) (11.35) (5.46) Income Tax 39.36 (37.66) 28.37 (43.01) (12.29) (8.67) Adjusted PAT 32.25 (15.92) 8.26 (32.43) (10.45) (4.05) Non Recurring Items  252.47 (94.23) 1629.29 (100.00) 455.19 (100.00) Other Non Cash adjustments  14.19 101.00 9.86 (52.25) 3.68 3.78 Reported Net Profit  45.37 (26.19) 26.95 (43.52) (10.02) (5.11) Equity Dividend  9.09 0.00 0.01 (33.32) (12.42) (6.16) Preference Dividend  0.00 0.00 0.00 0.00 0.00 0.00 Dividend Tax  17.14 (0.10) (17.96) (59.76) (27.60) (17.32) Retained Earnings  53.50 (30.51) 33.91 (44.78) (8.49) (4.63) Growth Factors 5 Year CAGR 40.00  25.00  30.00  20.00  20.00  10.00  15.00  0.00  10.00  March ' 08 March ' 09 March ' 10 March ' 11 (10.00) 5.00  (20.00) (30.00) 0.00  (40.00) (5.00) (50.00) Net Sales Total Operating Expenses (10.00) EBDITA EBT Adjusted PAT (15.00) Page 7
  • 8.
    Comparative Analysis Income Statement Particulars (Rs. In Cr) March ' 07 March ' 08 March ' 09 March ' 10 March ' 11 Net Sales 100.00 100.00 100.00 100.00 100.00 Material Consumed  34.71 31.91 33.39 31.98 45.63 Manufacturing Expenses  14.72 16.32 20.01 15.01 12.22 Comparative Net Sales Personnel Expenses  5.43 5.44 5.56 6.00 6.65 Selling Expenses  14.49 13.31 14.43 11.44 0.00 Adminstrative Expenses  3.11 2.89 3.07 3.16 4.70 Expenses Capitalised  0.00 0.00 0.00 (0.13) 0.00 Total Operating Expenses 72.46 69.89 76.46 67.45 69.20 Operating Profit 27.54 30.11 23.54 32.55 30.80 Other Income 1.87 2.13 2.01 3.30 9.45 EBDITA 29.41 32.25 25.55 35.84 40.25 Depreciation 3.68 3.45 4.20 4.26 3.90 Other Write offs 0.00 0.00 0.00 0.00 0.00 EBIT 25.73 28.80 21.35 31.58 36.34 Interest 1.29 1.04 1.31 1.46 1.01 March '  March '  March '  March '  March '  EBT 24.44 27.75 20.05 30.12 35.33 07 08 09 10 11 Income Tax 7.99 9.40 5.51 9.35 9.72 Total Operating Expenses Adjusted PAT 16.45 18.36 14.53 20.77 25.61 Other Income Depreciation Non Recurring Items  1.08 3.21 0.17 3.98 0.00 Other Write offs Interest Other Non Cash adjustments  0.24 0.23 0.44 0.64 0.56 Reported Net Profit  17.77 21.80 15.15 25.40 26.18 Balance Sheet Particulars (Rs. In Cr) March ' 07 March ' 08 March ' 09 March ' 10 March ' 11 SOURCES OF FUNDS  Equity Share Capital  1.00 0.81 0.71 1.12 1.02 Share Application Money  0.00 0.00 0.00 0.12 0.11 Comparative Analysis‐Source of  Preference Share Capital  0.00 0.00 0.00 0.00 0.00 Fund Reserves & Surplus  66.84 70.95 72.91 86.08 89.77 Total Owners fund 67.84 71.76 73.62 87.32 90.91 89.77  Secured Loans  24.96 20.73 17.13 9.35 6.22 Unsecured Loans  7.20 7.51 9.25 3.33 2.88 Total Loan fund 32.16 28.24 26.38 12.68 9.09 Total  100.00 100.00 100.00 100.00 100.00 USES OF FUNDS  6.22  2.88  1.02  0.11  0.00  Fixed Assets  Gross Block  73.78 66.92 85.72 37.91 33.35 Less : Revaluation Reserve  0.04 0.03 0.03 0.00 0.00 Less : Accumulated  Depreciation  36.83 31.44 30.87 16.08 16.12 Net Block  36.90 35.45 54.82 21.83 17.23 Capital Work‐in‐progress  12.99 26.69 9.70 0.53 1.13 Investments  46.58 35.99 35.82 77.29 77.23 Net Current Assets  Current Assets, Loans &  26.19 26.55 24.48 14.38 16.25 Less : Current Liabilities &  Provisions  22.66 24.68 24.82 14.02 11.84 Total Net Current Assets  3.53 1.87 (0.34) 0.36 4.41 Miscellaneous expenses not  written  0.00 0.00 0.00 0.00 0.00 Total  100.00 100.00 100.00 100.00 100.00 Page 8
  • 9.
    Index Analysis Income Statement Particulars March ' 07 March ' 08 March ' 09 March ' 10 March ' 11 Net Sales 100.00 118.50 125.86 95.31 52.23 Operating Expenses Material Consumed  100.00 108.94 121.05 87.80 68.66 Profit Index Manufacturing Expenses  100.00 131.41 171.09 97.20 43.39 Personnel Expenses  100.00 118.80 128.91 105.26 63.91 Selling Expenses  100.00 108.85 125.30 75.24 0.00 Adminstrative Expenses  100.00 110.44 124.53 96.91 79.07 Expenses Capitalised  0.00 0.00 0.00 0.00 0.00 Total Operating Expenses 100.00 114.29 132.80 88.73 49.88 Operating Profit 100.00 129.56 107.58 112.63 58.41 Other Income 100.00 135.34 135.56 168.31 264.36 March '  March '  March '  March '  March '  EBDITA 100.00 129.93 109.36 116.17 71.49 07 08 09 10 11 Depreciation 100.00 111.12 143.74 110.45 55.45 Other Write offs 0.00 0.00 0.00 0.00 0.00 EBIT 100.00 132.62 104.44 116.99 73.78 EBIT EBT Interest 100.00 95.67 127.09 107.64 40.76 Adjusted PAT EBT 100.00 134.58 103.24 117.48 75.53 Reported Net Profit  Net Sales Income Tax 100.00 139.36 86.87 111.51 63.55 Adjusted PAT 100.00 132.25 111.19 120.38 81.34 Non Recurring Items  100.00 352.47 20.33 351.61 0.00 Other Non Cash adjustments  100.00 114.19 229.52 252.16 120.41 Reported Net Profit  100.00 145.37 107.30 136.22 76.94 Balance Sheet Particulars March ' 07 March ' 08 March ' 09 March ' 10 March ' 11 SOURCES OF FUNDS  Equity Share Capital  100.00 100.00 100.00 100.01 100.03 Share Application Money  100.00 100.00 100.00 47650.00 49750.00 Liability Index Preference Share Capital  0.00 0.00 0.00 0.00 0.00 Reserves & Surplus  100.00 131.15 152.95 114.83 130.93 Total Owners fund 100.00 130.69 152.17 114.76 130.64 Loan Funds  Secured Loans  100.00 102.59 96.25 33.39 24.28 Unsecured Loans  100.00 128.90 180.14 41.28 38.99 Total Loan fund 100.00 108.48 115.02 35.15 27.57 Total  100.00 123.55 140.22 89.16 97.49 USES OF FUNDS  March '  March '  March '  March '  March '  Fixed Assets  07 08 09 10 11 Gross Block  100.00 112.07 162.92 45.82 44.07 Less : Revaluation Reserve  100.00 92.54 86.38 0.00 0.00 Total Owners fund Total Loan fund Less : Accumulated  100.00 105.45 117.51 38.93 42.66 Net Block  100.00 118.70 208.33 52.74 45.53 Capital Work‐in‐progress  100.00 253.81 104.69 3.60 8.47 Investments  100.00 95.46 107.82 147.96 161.65 Net Current Assets  Current Assets, Loans &  Advances  100.00 125.28 131.10 48.95 60.48 Less : Current Liabilities &  Provisions  100.00 134.62 153.63 55.18 50.94 Total Net Current Assets  100.00 65.40 (13.42) 9.00 121.71 Miscellaneous expenses not  written  0.00 0.00 0.00 0.00 0.00 Total  100.00 123.55 140.22 89.16 97.49 Page 9
  • 10.
    Ratio Analysis Particulars(Yearly) March ' 07 March ' 08 March ' 09 March ' 10 March ' 11 PER SHARE RATIOS  Adjusted E P S (Rs.)  155.06 205.08 172.42 186.65 126.10 Adjusted Cash EPS (Rs.)  189.74 243.61 222.27 224.95 145.33 Reported EPS (Rs.)  167.53 223.35 179.76 228.19 128.87 Reported Cash EPS (Rs.)  202.21 261.89 229.61 266.49 148.09 Dividend Per Share  27.50 30.00 30.00 30.00 20.00 Per Share Ratio Operating Profit Per Share  (Rs.)  259.66 336.43 279.34 292.44 151.63 Book Value (Excl Rev Res) Per  Share (Rs.)  679.19 887.65 1033.51 779.38 886.99 Book Value (Incl Rev Res) Per  Share (Rs.)  679.62 888.05 1033.88 779.38 886.99 Net Operating Income Per  Share (Rs.)  942.83 1117.21 1186.59 898.53 492.33 Free Reserves Per Share (Rs.)  657.73 874.72 1018.33 768.31 0.00 March '  March '  March '  March '  March '  07 08 09 10 11 PROFITABILITY RATIOS  Operating Margin (%)  27.54 30.11 23.54 32.54 30.79 Gross Profit Margin (%)  23.86 26.66 19.34 28.28 26.89 Net Operating Income Per Share (Rs.)  Net Profit Margin (%)  17.44 19.57 14.85 24.58 23.91 Adjusted E P S (Rs.)  Adjusted Cash Margin (%)  19.75 21.35 18.36 24.23 26.96 Adjusted Cash EPS (Rs.)  Adjusted Return On Net  Dividend Per Share  Worth (%)  22.83 23.10 16.68 23.98 14.23 Book Value (Incl Rev Res) Per Share (Rs.)  Reported Return On Net  Worth (%)  24.66 25.16 17.39 29.31 14.54 Return On long Term Funds  (%)  25.35 27.83 18.73 34.07 18.35 LEVERAGE RATIOS  Profit Margin Long Term Debt / Equity  0.40 0.30 0.30 0.07 0.10 Total Debt/Equity  0.47 0.39 0.35 0.14 0.10 Owners fund as % of total  Source  67.83 71.76 73.61 87.30 90.89 Fixed Assets Turnover Ratio  1.28 1.35 0.98 2.66 1.51 LIQUIDITY RATIOS  Current Ratio  1.16 1.08 0.98 1.03 1.37 Current Ratio (Inc. ST Loans)  0.85 0.73 0.79 0.57 1.37 Quick Ratio  0.73 0.70 0.53 0.65 0.97 Inventory Turnover Ratio  17.75 19.40 13.10 25.79 11.60 March '  March '  March '  March '  March '  PAYOUT RATIOS  07 08 09 10 11 Dividend payout Ratio (Net  Profit)  18.71 15.45 19.19 14.76 16.67 Net Profit Margin (%)  Dividend payout Ratio (Cash  Operating Margin (%)  Profit)  15.50 13.18 15.03 12.64 14.51 Adjusted Return On Net Worth (%)  Earning Retention Ratio  79.78 83.17 79.99 81.95 82.96 Cash Earnings Retention Ratio  83.48 85.84 84.48 85.02 85.22 Return On long Term Funds (%)  COVERAGE RATIOS  Adjusted Cash Flow Time  Total Debt  1.70 1.43 1.67 0.50 0.61 Financial Charges Coverage  Liquidity Ratio Ratio  22.73 30.87 19.56 24.53 39.86 Fin. Charges Cov.Ratio (Post  Tax)  17.57 23.44 15.81 21.29 30.79 COMPONENT RATIOS  Material Cost Component(%  earnings)  34.51 33.28 33.54 31.93 45.97 Selling Cost Component  14.49 13.31 14.42 11.44 0.00 Exports as percent of Total  March '  March '  March '  March '  March '  Sales  3.24 3.77 4.74 8.98 18.72 07 08 09 10 11 Import Comp. in Raw Mat.  Consumed  31.28 21.31 25.24 39.97 46.33 Long term assets / Total  Assets  0.78 0.78 0.80 0.87 0.85 Current Ratio  Quick Ratio  Bonus Component In Equity  Capital (%)  32.21 32.21 32.21 32.20 32.20 Page 10
  • 11.
    Ratio Analysis September '  Particulars(Quarterly) June ' 10 10 December ' 10 March ' 11 June ' 11 PER SHARE RATIOS  Quarterly Profit Margin Operating Income Per  Share(Rs.) 105.15 104.94 137.08 159.36 113.82 Operating Profit Per  Share(Rs.) 39.31 46.45 48.80 63.55 49.49 Adjusted EPS(Rs.) 24.40 30.49 30.82 43.12 34.25 PROFITABILITY RATIOS  OPM(%)  33.25 30.50 32.37 34.05 35.77 GPM(%)  34.87 37.97 33.58 36.82 39.42 NPM(%)  22.28 25.53 21.78 25.57 27.93 OPM(%)  GPM(%)  NPM(%)  TTM Analysis Particulars (Rs. In Cr) March ' 11 % of Sales June ' 11 % of Sales Growth(%) Sales  4645.94 100.00 4725.41 100.00 1.71 Less: Excise 0.00 0.00 0.00 0.00 NA Net Sales 4645.94 100.00 4725.41 100.00 1.71 7.64  Other Income  297.77 6.41 338.42 7.16 13.65 TTM Growth (%) 6.26  6.42  Total Income 4943.71 106.41 5063.83 107.16 2.43 5.14  Stock Adjustment  (12.97) (0.28) (136.12) (2.88) 949.50 Raw Material  1952.58 42.03 2057.15 43.53 5.36 Power And Fuel  498.93 10.74 531.32 11.24 6.49 1.71  Employee Expenses  300.01 6.46 305.86 6.47 1.95 0.86  Admin And Selling Expenses  0.00 0.00 0.00 0.00 NA Research And Devlopment Expe 0.00 0.00 0.00 0.00 NA Expenses Capitalised  0.00 0.00 0.00 0.00 NA Other Expeses  388.08 8.35 395.16 8.36 1.82 Total Expenses 3126.63 67.30 3153.37 66.73 0.86 EBDITA 1817.08 39.11 1910.46 40.43 5.14 Provisions Made  0.00 0.00 0.00 0.00 NA Depreciation  176.29 3.79 166.89 3.53 (5.33) TTM EPS & SPS(%) EBIT 1640.79 35.32 1743.57 36.90 6.26 Interest  45.59 0.98 45.96 0.97 0.81 EBT 1595.20 34.34 1697.61 35.93 6.42 Taxation  413.49 8.90 425.60 9.01 2.93 Net Profit / Loss  1181.71 25.44 1272.01 26.92 7.64 Extra Ordinary Item  0.00 0.00 0.00 0.00 NA Prior Year Adjustments  0.00 0.00 0.00 0.00 NA TTM EPS 128.84 138.68 0.83 TTM SPS 506.54 515.2 0.19 March ' 11 June ' 11 Page 11
  • 12.
    Technical Analysis Price Chart 2400.00 45000.00 40000.00 2300.00 35000.00 2200.00 30000.00 25000.00 2100.00 20000.00 2000.00 15000.00 10000.00 1900.00 5000.00 1800.00 0.00 26‐May 4‐Aug Volume Close EMA(200) EMA(50) 50.00 0.00 ‐50.00 ‐100.00 MACD Signal line 100 80 60 40 20 0 RSI(14) Technical Indicators Price 2298.20 AS On: 16/09/2011 EMA(13) 2185.77 ADX 11 EMA(26) 2179.67 DX 26 EMA(50) 2207.32 +DI 24 EMA(200) 2292.28 ‐DI 14 RSI(14) 61.75 %K(Fast) 100 MACD 6.11 %K(Slow) 92.84 William(%R) 0.00 %d(Slow) 75.58 Page 12