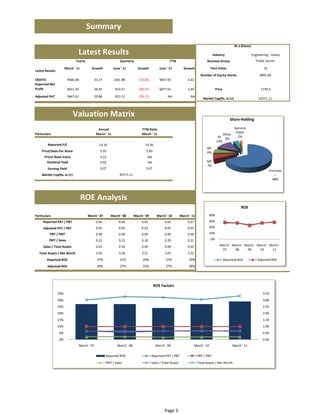
- The document provides a financial analysis of Bharat Heavy Electricals Ltd for the years 2007-2011 including income statements, balance sheets, cash flow statements, ratio analysis, and valuation metrics.
- Key highlights are that for FY2011, reported net profit was Rs. 6011.20 Cr (up 39.45% YoY) while adjusted PAT was Rs. 5847.61 Cr (up 29.88% YoY). Return on equity was 29% in FY2011.
- As of March 2011, the company had a market capitalization of Rs. 41277.55 Cr and traded at a price/earnings ratio of 13.73 based on F
Falcon stands out as a top-tier P2P Invoice Discounting platform in India, bridging esteemed blue-chip companies and eager investors. Our goal is to transform the investment landscape in India by establishing a comprehensive destination for borrowers and investors with diverse profiles and needs, all while minimizing risk. What sets Falcon apart is the elimination of intermediaries such as commercial banks and depository institutions, allowing investors to enjoy higher yields.
when will pi network coin be available on crypto exchange.DOT TECH
There is no set date for when Pi coins will enter the market.
However, the developers are working hard to get them released as soon as possible.
Once they are available, users will be able to exchange other cryptocurrencies for Pi coins on designated exchanges.
But for now the only way to sell your pi coins is through verified pi vendor.
Here is the telegram contact of my personal pi vendor
@Pi_vendor_247
BYD SWOT Analysis and In-Depth Insights 2024.pptxmikemetalprod
Indepth analysis of the BYD 2024
BYD (Build Your Dreams) is a Chinese automaker and battery manufacturer that has snowballed over the past two decades to become a significant player in electric vehicles and global clean energy technology.
This SWOT analysis examines BYD's strengths, weaknesses, opportunities, and threats as it competes in the fast-changing automotive and energy storage industries.
Founded in 1995 and headquartered in Shenzhen, BYD started as a battery company before expanding into automobiles in the early 2000s.
Initially manufacturing gasoline-powered vehicles, BYD focused on plug-in hybrid and fully electric vehicles, leveraging its expertise in battery technology.
Today, BYD is the world’s largest electric vehicle manufacturer, delivering over 1.2 million electric cars globally. The company also produces electric buses, trucks, forklifts, and rail transit.
On the energy side, BYD is a major supplier of rechargeable batteries for cell phones, laptops, electric vehicles, and energy storage systems.
What price will pi network be listed on exchangesDOT TECH
The rate at which pi will be listed is practically unknown. But due to speculations surrounding it the predicted rate is tends to be from 30$ — 50$.
So if you are interested in selling your pi network coins at a high rate tho. Or you can't wait till the mainnet launch in 2026. You can easily trade your pi coins with a merchant.
A merchant is someone who buys pi coins from miners and resell them to Investors looking forward to hold massive quantities till mainnet launch.
I will leave the telegram contact of my personal pi vendor to trade with.
@Pi_vendor_247
US Economic Outlook - Being Decided - M Capital Group August 2021.pdfpchutichetpong
The U.S. economy is continuing its impressive recovery from the COVID-19 pandemic and not slowing down despite re-occurring bumps. The U.S. savings rate reached its highest ever recorded level at 34% in April 2020 and Americans seem ready to spend. The sectors that had been hurt the most by the pandemic specifically reduced consumer spending, like retail, leisure, hospitality, and travel, are now experiencing massive growth in revenue and job openings.
Could this growth lead to a “Roaring Twenties”? As quickly as the U.S. economy contracted, experiencing a 9.1% drop in economic output relative to the business cycle in Q2 2020, the largest in recorded history, it has rebounded beyond expectations. This surprising growth seems to be fueled by the U.S. government’s aggressive fiscal and monetary policies, and an increase in consumer spending as mobility restrictions are lifted. Unemployment rates between June 2020 and June 2021 decreased by 5.2%, while the demand for labor is increasing, coupled with increasing wages to incentivize Americans to rejoin the labor force. Schools and businesses are expected to fully reopen soon. In parallel, vaccination rates across the country and the world continue to rise, with full vaccination rates of 50% and 14.8% respectively.
However, it is not completely smooth sailing from here. According to M Capital Group, the main risks that threaten the continued growth of the U.S. economy are inflation, unsettled trade relations, and another wave of Covid-19 mutations that could shut down the world again. Have we learned from the past year of COVID-19 and adapted our economy accordingly?
“In order for the U.S. economy to continue growing, whether there is another wave or not, the U.S. needs to focus on diversifying supply chains, supporting business investment, and maintaining consumer spending,” says Grace Feeley, a research analyst at M Capital Group.
While the economic indicators are positive, the risks are coming closer to manifesting and threatening such growth. The new variants spreading throughout the world, Delta, Lambda, and Gamma, are vaccine-resistant and muddy the predictions made about the economy and health of the country. These variants bring back the feeling of uncertainty that has wreaked havoc not only on the stock market but the mindset of people around the world. MCG provides unique insight on how to mitigate these risks to possibly ensure a bright economic future.
how can i use my minded pi coins I need some funds.DOT TECH
If you are interested in selling your pi coins, i have a verified pi merchant, who buys pi coins and resell them to exchanges looking forward to hold till mainnet launch.
Because the core team has announced that pi network will not be doing any pre-sale. The only way exchanges like huobi, bitmart and hotbit can get pi is by buying from miners.
Now a merchant stands in between these exchanges and the miners. As a link to make transactions smooth. Because right now in the enclosed mainnet you can't sell pi coins your self. You need the help of a merchant,
i will leave the telegram contact of my personal pi merchant below. 👇 I and my friends has traded more than 3000pi coins with him successfully.
@Pi_vendor_247
If you are looking for a pi coin investor. Then look no further because I have the right one he is a pi vendor (he buy and resell to whales in China). I met him on a crypto conference and ever since I and my friends have sold more than 10k pi coins to him And he bought all and still want more. I will drop his telegram handle below just send him a message.
@Pi_vendor_247
how to sell pi coins on Bitmart crypto exchangeDOT TECH
Yes. Pi network coins can be exchanged but not on bitmart exchange. Because pi network is still in the enclosed mainnet. The only way pioneers are able to trade pi coins is by reselling the pi coins to pi verified merchants.
A verified merchant is someone who buys pi network coins and resell it to exchanges looking forward to hold till mainnet launch.
I will leave the telegram contact of my personal pi merchant to trade with.
@Pi_vendor_247
What website can I sell pi coins securely.DOT TECH
Currently there are no website or exchange that allow buying or selling of pi coins..
But you can still easily sell pi coins, by reselling it to exchanges/crypto whales interested in holding thousands of pi coins before the mainnet launch.
Who is a pi merchant?
A pi merchant is someone who buys pi coins from miners and resell to these crypto whales and holders of pi..
This is because pi network is not doing any pre-sale. The only way exchanges can get pi is by buying from miners and pi merchants stands in between the miners and the exchanges.
How can I sell my pi coins?
Selling pi coins is really easy, but first you need to migrate to mainnet wallet before you can do that. I will leave the telegram contact of my personal pi merchant to trade with.
Tele-gram.
@Pi_vendor_247
how to sell pi coins at high rate quickly.DOT TECH
Where can I sell my pi coins at a high rate.
Pi is not launched yet on any exchange. But one can easily sell his or her pi coins to investors who want to hold pi till mainnet launch.
This means crypto whales want to hold pi. And you can get a good rate for selling pi to them. I will leave the telegram contact of my personal pi vendor below.
A vendor is someone who buys from a miner and resell it to a holder or crypto whale.
Here is the telegram contact of my vendor:
@Pi_vendor_247
Poonawalla Fincorp and IndusInd Bank Introduce New Co-Branded Credit Cardnickysharmasucks
The unveiling of the IndusInd Bank Poonawalla Fincorp eLITE RuPay Platinum Credit Card marks a notable milestone in the Indian financial landscape, showcasing a successful partnership between two leading institutions, Poonawalla Fincorp and IndusInd Bank. This co-branded credit card not only offers users a plethora of benefits but also reflects a commitment to innovation and adaptation. With a focus on providing value-driven and customer-centric solutions, this launch represents more than just a new product—it signifies a step towards redefining the banking experience for millions. Promising convenience, rewards, and a touch of luxury in everyday financial transactions, this collaboration aims to cater to the evolving needs of customers and set new standards in the industry.
how can I sell pi coins after successfully completing KYCDOT TECH
Pi coins is not launched yet in any exchange 💱 this means it's not swappable, the current pi displaying on coin market cap is the iou version of pi. And you can learn all about that on my previous post.
RIGHT NOW THE ONLY WAY you can sell pi coins is through verified pi merchants. A pi merchant is someone who buys pi coins and resell them to exchanges and crypto whales. Looking forward to hold massive quantities of pi coins before the mainnet launch.
This is because pi network is not doing any pre-sale or ico offerings, the only way to get my coins is from buying from miners. So a merchant facilitates the transactions between the miners and these exchanges holding pi.
I and my friends has sold more than 6000 pi coins successfully with this method. I will be happy to share the contact of my personal pi merchant. The one i trade with, if you have your own merchant you can trade with them. For those who are new.
Message: @Pi_vendor_247 on telegram.
I wouldn't advise you selling all percentage of the pi coins. Leave at least a before so its a win win during open mainnet. Have a nice day pioneers ♥️
#kyc #mainnet #picoins #pi #sellpi #piwallet
#pinetwork
how can I sell pi coins after successfully completing KYC
Bharat heavy electricals ltd
1. gtÇtç eÉç XåvÄâá|äx
COMPANY FINALYTICS
Bharat Heavy Electricals Ltd
Exclusive Financial Analysis of Indian Companies
Prepared and Edited By‐
Tanay Roy, CFA
Peu Karak, MBA
Disclaimer
The information, opinions, estimates and forecasts contained in this document have been arrived at or obtained from public sources believed
to be reliable and in good faith which has not been independently verified and no warranty, express or implied, is made as to their accuracy,
completeness or correctness.
For more information about this sample and our other services, please write to tanay.roy2008@gmail.com
Monday, September 19, 2011
2. Description Page
Summary 3
Latest Result 3
Valuation Matrix 3
ROE Analysis 3
Income Statement 4
Balance Sheet 5
Cashflow Statement 6
Quarterly Result 6
Growth Analysis 7
Comparative Analysis 8
Income Statement 8
Balance Sheet 8
Index Analysis 9
Income Statement 9
Balance Sheet 9
Ratio Analysis 10
Annual 10
Quarterly 11
TTM Analysis 11
Technical Analysis 12
CONTENT
About Tanay & Peu
Our passion lies in the field of financial research & Investment management and we intend to apply
our knowledge gained over a period of years through intense study and keen observation of the
nuances of financial markets and instruments to real life scenarios. We possess expert knowledge of
financial products and markets as evidenced by top notch qualifications earned by us , all in the first
attempt and keep ourselves abreast with the latest happenings and innovations taking place in
financial landscape.
1. Expertise in Portfolio Management, Product optimization, Product performance Analysis, Financial
Reporting/ Planning, Cash Flow Analysis, Ratio Analysis, Budgeting, Forecasting, Mergers &
Acquisition and knowledge of GAAP/ IFRS
2. Possess Strong Financial Modeling skills including DCF, LBO and other techniques. Possess ability to
research all asset classes in a broad range of industries and geographies.
3. Strong equity research, finance, accounting and advisory and assurance experience
4. Expertise in Technical analysis, fundamental analysis, developing trading systems.
5. Conduct in‐depth financial analysis of company financials.
6. Write analytical or trend based reports on companies, sectors or markets.
7. Expert level application in Bloomberg, Thomson Banker, Factset, Datastream, StockVal, Merger
markets, Reuters Knowledge, Haver Analytics, Factiva, PackHedge,
8. Building Excel/VBA based customized tools to perform detailed analysis.
Contact Us: tanay.roy2008@gmail.com
Page 2
3. Summary
At a Glance
Latest Results Industry Engineering ‐ Heavy
Yearly Quarterly TTM Business Group Public Sector
March ' 11 Growth June ' 11 Growth June ' 11 Growth Face Value 10
Latest Results
Number of Equity shares 4895.20
EBDITA 9466.08 33.37 1361.88 (60.44) 9837.93 2.43
Reported Net
Profit 6011.20 39.45 815.51 (70.02) 6077.61 2.49 Price 1686.45
Adjusted PAT 5847.61 29.88 815.51 (69.14) NA NA
Market Cap(Rs. In Cr) 41277.55
Valuation Matrix Share Holding
Annual TTM Ratio General
Particulars March ' 11 March ' 11 Public
Other
FII 4% 2%
13%
Reported P/E 13.73 13.92
BFI
Price/Sales Per Share 1.96 1.94 6%
Price/ Book Value 4.10 NA
Dividend Yield 0.02 NA MF
7%
Earning Yield 0.07 0.07
Promote
Market Cap(Rs. In Cr) 41277.55 r
68%
ROE Analysis
ROE
Particulars March ' 07 March ' 08 March ' 09 March ' 10 March ' 11 40%
Reported PAT / PBT 0.64 0.64 0.65 0.65 0.67 30%
Adjusted PAT / PBT 0.65 0.65 0.63 0.65 0.65 20%
PBT / PBIT 0.99 0.99 0.99 0.99 0.99 10%
PBIT / Sales 0.22 0.23 0.18 0.20 0.21 0%
Sales / Total Assets 0.65 0.56 0.64 0.68 0.63 March ' March ' March ' March ' March '
07 08 09 10 11
Total Assets / Net Worth 3.02 3.26 3.21 3.05 3.32
Reported ROE 27% 27% 24% 27% 29% Reported ROE Adjusted ROE
Adjusted ROE 28% 27% 23% 27% 28%
ROE Factors
3.50 35%
3.00 30%
2.50 25%
2.00 20%
1.50 15%
1.00 10%
0.50 5%
0.00 0%
March ' 07 March ' 08 March ' 09 March ' 10 March ' 11
Reported ROE Reported PAT / PBT PBT / PBIT
PBIT / Sales Sales / Total Assets Total Assets / Net Worth
Page 3
4. Income Statement
Particulars (Rs. In Cr) March ' 07 March ' 08 March ' 09 March ' 10 March ' 11
Net Sales 17362.89 19541.08 26614.36 33226.25 42022.76
Operating Expenses
Material Consumed 8380.04 9573.36 14435.89 16966.09 19760.10
Manufacturing Expenses 1992.67 1737.65 2427.88 3318.24 3885.62
Personnel Expenses 2366.93 2602.30 2991.27 6449.17 5396.71 Operating Income
Selling Expenses 222.18 238.55 291.76 352.76 417.11
45000.00
Adminstrative Expenses 855.87 1642.62 2285.58 143.69 4028.52
40000.00
Expenses Capitalised 0.00 0.00 0.00 0.00 0.00
35000.00
Total Operating Expenses 13817.69 15794.48 22432.38 27229.95 33488.06
30000.00
Operating Profit 3545.20 3746.60 4181.98 5996.30 8534.70
25000.00
Other Income 502.85 1068.38 989.51 1101.11 931.38
20000.00
EBDITA 4048.05 4814.98 5171.49 7097.41 9466.08
15000.00
Depreciation 244.61 297.21 334.27 458.01 475.61
Other Write offs 0.00 0.00 0.00 0.00 0.00 10000.00
EBIT 3803.44 4517.77 4837.22 6639.40 8990.47 5000.00
Interest 43.33 35.42 30.71 33.50 54.73 0.00
EBT 3760.11 4482.35 4806.51 6605.90 8935.74 March March March March March
' 07 ' 08 ' 09 ' 10 ' 11
Income Tax 1311.09 1565.06 1799.31 2326.35 3088.13
Adjusted PAT 2449.02 2917.29 3007.20 4279.55 5847.61 Net Sales Operating Profit EBDITA
Non Recurring Items (20.53) (45.26) 34.37 (15.38) 83.93
Other Non Cash adjustments (13.79) (12.69) 96.64 46.47 79.66
Reported Net Profit 2414.70 2859.34 3138.21 4310.64 6011.20
Equity Dividend 599.66 746.52 832.18 1140.58 1524.85
Preference Dividend 0.00 0.00 0.00 0.00 0.00
Dividend Tax 92.83 126.87 141.43 191.51 249.88
Retained Earnings 1722.21 1985.95 2164.60 2978.55 4236.47
Profit Levels Total Income Break‐up
10000.00
Total Operating Expenses Depreciation
9000.00
Other Write offs Interest
8000.00
Income Tax Adjusted PAT
7000.00
6000.00
5000.00
14%
4000.00
3000.00 7%
0%
1%
2000.00
1000.00
0.00
March ' 07 March ' 08 March ' 09 March ' 10 March ' 11
78%
Operating Profit EBDITA EBIT
EBT Adjusted PAT
Page 4
5. Balance Sheet
Particulars (Rs. In Cr) March ' 07 March ' 08 March ' 09 March ' 10 March ' 11
SOURCES OF FUNDS
Owner's Fund
Equity Share Capital 244.76 489.52 489.52 489.52 489.52
Share Application Money 0.00 0.00 0.00 0.00 0.00
Preference Share Capital 0.00 0.00 0.00 0.00 0.00
Reserves & Surplus 8543.50 10284.69 12449.29 15427.84 19664.32
Total Owners fund 8788.26 10774.21 12938.81 15917.36 20153.84
Loan Funds
Secured Loans 0.00 0.00 0.00 0.00 0.00
Unsecured Loans 89.33 95.18 149.37 127.75 163.35
Total Loan fund 89.33 95.18 149.37 127.75 163.35
Capital Structure
Total 8877.59 10869.39 13088.18 16045.11 20317.19
25000.00
USES OF FUNDS
Fixed Assets
Gross Block 4134.61 4443.03 5224.43 6579.70 8049.30 20000.00
Less : Revaluation Reserve 0.00 0.00 0.00 0.00 0.00
Less : Accumulated
Depreciation 3146.31 3462.21 3754.47 4164.74 4648.82 15000.00
Net Block 988.30 980.82 1469.96 2414.96 3400.48
Capital Work‐in‐progress 306.58 658.47 1212.70 1550.49 1762.62
Investments 8.29 8.29 52.34 79.84 439.17 10000.00
Net Current Assets
Current Assets, Loans &
Advances 25239.99 33463.46 38743.86 44515.53 61214.87 5000.00
Less : Current Liabilities &
Provisions 17665.57 24241.65 28390.68 32515.71 46499.95
Total Net Current Assets 7574.42 9221.81 10353.18 11999.82 14714.92
0.00
Miscellaneous expenses not
written 0.00 0.00 0.00 0.00 0.00 March ' March ' March ' March ' March '
Total 8877.59 10869.39 13088.18 16045.11 20317.19 07 08 09 10 11
Note :
Total Owners fund Total Loan fund
Book Value of Unquoted
Investments 8.29 8.29 52.34 79.84 439.17
Market Value of Quoted
Investments 0.00 0.00 0.00 0.00 0.00
Contingent liabilities 976.05 1673.19 2546.25 2538.13 2324.26
Number of Equity shares
outstanding (in Lacs) 2447.60 4895.20 4895.20 4895.20 4895.20
Sources of Capital Application of capital
Total Loan
fund
1%
Capital Work‐
Net Block in‐progress
17% 9%
Investments
2%
Total Net
Current Assets
Total Owners 72%
fund
99%
Page 5
6. Cash Flow Statement
Particulars (Rs. In Cr) March ' 07 March ' 08 March ' 09 March ' 10 March ' 11
Profit Before Tax 3736.07 4430.39 4848.85 6590.65 9005.67
Net CashFlow‐Operating
Net Cash Flow
Activity 2821.37 3477.90 3291.20 1585.06 2658.62
Net Cash Used In Investing
Activity (212.66) (12.54) (512.82) (966.64) (1342.82)
NetCash Used in Fin. Activity
(933.77) (888.25) (849.73) (1143.01) (1475.73) 2821.37 3477.90 3291.20
Net Inc/Dec In Cash And 1585.06 2658.62
Equivlnt 1674.94 (2577.11) 1928.65 (524.59) (159.93)
Cash And Equivalnt Begin of (212.66) (12.54) (512.82)
(888.25) (966.64) (1342.82)
Year 4133.97 8386.02 8386.02 10314.67 9790.08 (933.77) (849.73)
Cash And Equivalnt End Of
Year (1143.01) (1475.73)
5808.91 5808.91 10314.67 9790.08 9630.15
Net CashFlow‐Operating Activity
Net Cash Used In Investing Activity
NetCash Used in Fin. Activity
Quarterly Result
September '
Particulars (Rs. In Cr) June ' 10 10 December ' 10 March ' 11 June ' 11
Sales 6,601.04 8,490.65 9,023.32 18,380.50 7,271.46
Less: Excise 0.00 0.00 0.00 0.00 0.00
Net Sales 6,601.04 8,490.65 9,023.32 18,380.50 7,271.46
Profit Levels
Other Income 163.45 161.99 152.94 163.43 248.65
Total Income 6,764.49 8,652.64 9,176.26 18,543.93 7,520.11
Stock Adjustment (125.25) (393.15) (275.90) 666.95 (430.59)
Raw Material 3,934.61 5,357.21 5,085.69 8,293.19 4,580.56
Power And Fuel 0.00 0.00 0.00 0.00 0.00
Employee Expenses 1,337.75 1,264.09 1,348.66 1,459.91 1,300.95
Admin And Selling Expenses 0.00 0.00 0.00 0.00 0.00
Research And Devlopment Expe 0.00 0.00 0.00 0.00 0.00
Expenses Capitalised 0.00 0.00 0.00 0.00 0.00
Other Expeses 488.91 630.11 793.17 3,666.85 707.31
Total Expenses 5,636.02 6,858.26 6,951.62 14,086.90 6,158.23
EBDITA 1,128.47 1,794.38 2,224.64 4,457.03 1,361.88
Provisions Made 0.00 0.00 0.00 0.00 0.00
Depreciation 126.89 134.10 144.69 138.44 170.91
EBIT 1,001.58 1,660.28 2,079.95 4,318.59 1,190.97
Interest 3.83 5.93 14.47 30.50 8.80
EBT 997.75 1,654.35 2,065.48 4,288.09 1,182.17
Taxation 330.10 515.84 662.25 1,567.73 366.66
Net Profit / Loss 667.65 1,138.51 1,403.23 2,720.36 815.51
Extra Ordinary Item 0.00 0.00 0.00 0.00 0.00 EBDITA EBIT
Prior Year Adjustments 0.00 3.77 0.00 77.68 0.00
EBT Net Profit / Loss
Page 6