Downloaded 208 times

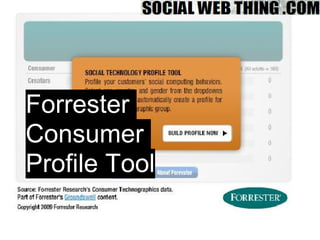
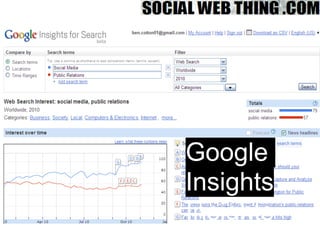
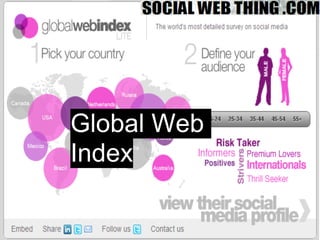
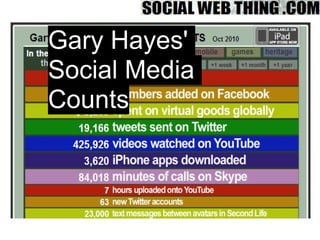
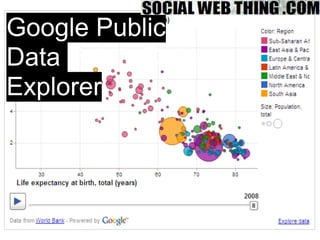
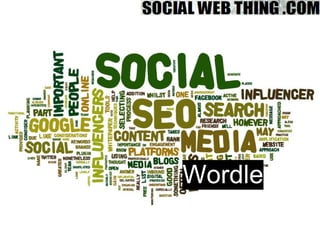

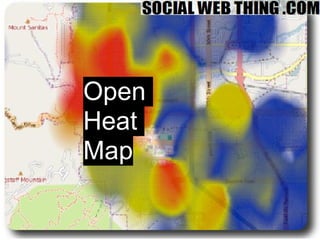
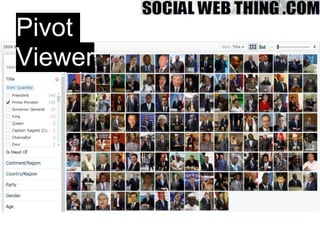
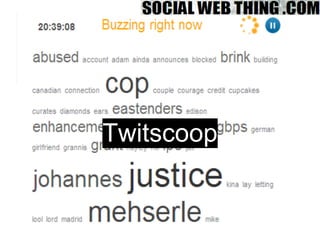


The document lists 10 data visualization tools, including Forrester Consumer Profile Tool, Google Insights, and Global Web Index. It features various social media and public data exploration tools. Contact details for Ben Cotton are also provided.


