Downloaded 12 times

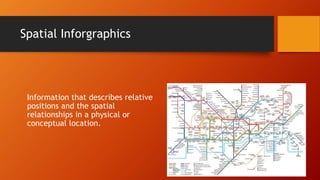
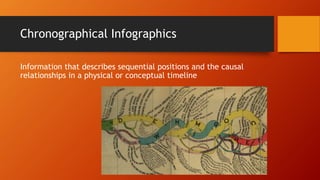
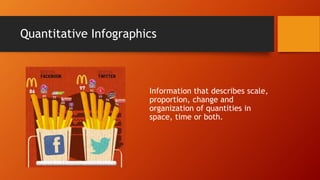
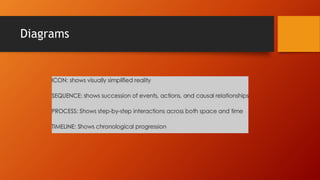
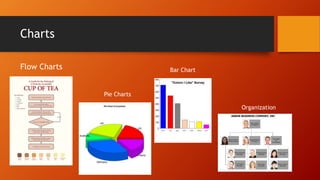
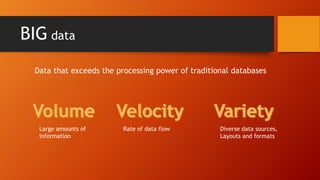


Digital infographics can use graphics to more easily convey information through visualization. There are different types of infographics including spatial, chronological, and quantitative infographics that use diagrams, charts, maps, and other visual elements to communicate information. Big data refers to extremely large data sets that may be analyzed computationally to reveal patterns, trends, and associations. Big data is used across many industries for applications like customer analytics, predictive maintenance, risk analysis, and more. Hadoop is an open-source software framework that allows distributed processing of large data sets across clusters of computers using MapReduce.