
Recommended
Recommended
More Related Content
Similar to Infographic student project
Similar to Infographic student project (20)
More from jenniech
More from jenniech (20)
Recently uploaded
Recently uploaded (20)
Infographic student project
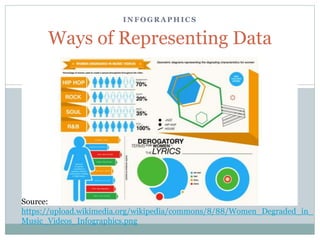
- 1. I N F O G R A P H I C S Ways of Representing Data Source: https://upload.wikimedia.org/wikipedia/commons/8/88/Women_Degraded_in_ Music_Videos_Infographics.png
- 2. Infographics for Data Representation Infographics are a way to represent data in an effective and visually clear fashion You will choose and collect your own data to represent in an infographic You can find the design steps here: http://my.visme.co/projects/the-process-of-designing- an-infographic-d25a0c You may also use one of the following free websites to create your infographic: https://infogr.am/ http://piktochart.com/ http://www.easel.ly/
- 3. What to Include on your Infographic Journal writing: ensure you write down the process you underwent when you collected and represented your data Ensure you include at least two charts to visually represent your data. Include justifications of your choice of charts used. Include headlines on your infographic which show you have analyzed and interpreted the data Here are is an example of an infographic about Ted talks: http://infographiccommons.com/view/tedtalks-info.html