Download to read offline
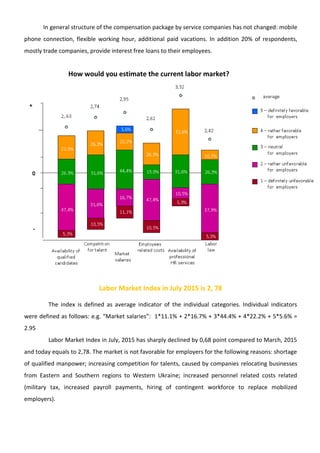
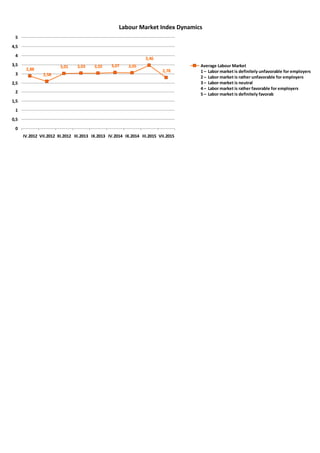

- The document summarizes the results of a survey of businesses in Western Ukraine regarding labor market trends. It finds that the labor market has become less favorable for employers compared to previous periods, as indicated by a decline in the Labor Market Index. Mobilization of employees due to the conflict in Eastern Ukraine has affected many companies. There is increased competition for qualified employees as businesses relocate from Eastern Ukraine. Wages have risen across many industries in response to these pressures.


