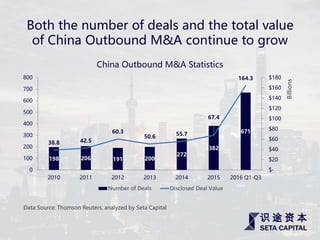
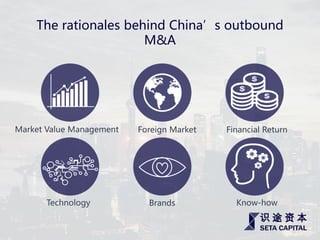
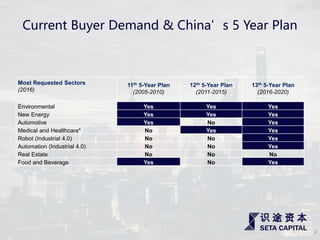
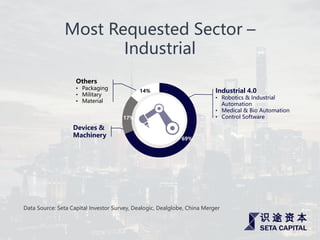
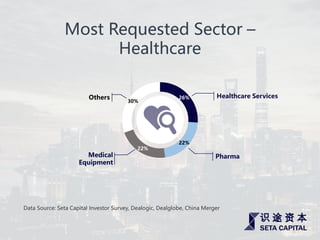
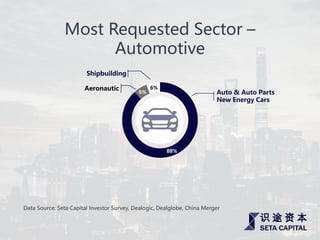
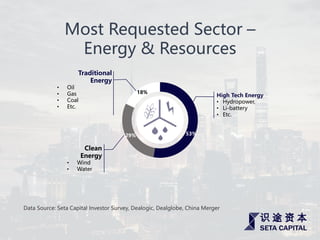
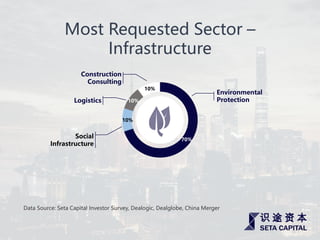
2. 198 206 191 200
272
382
671
38.8 42.5
60.3
50.6 55.7
67.4
164.3
$-
$20
$40
$60
$80
$100
$120
$140
$160
$180
0
100
200
300
400
500
600
700
800
2010 2011 2012 2013 2014 2015 2016 Q1-Q3
Billions
China Outbound M&A Statistics
Number of Deals Disclosed Deal Value
Data Source: Thomson Reuters, analyzed by Seta Capital
Both the number of deals and the total value
of China Outbound M&A continue to grow
4. Most Requested Sectors
(2016)
11th 5-Year Plan
(2005-2010)
12th 5-Year Plan
(2011-2015)
13th 5-Year Plan
(2016-2020)
Environmental Yes Yes Yes
New Energy Yes Yes Yes
Automotive Yes No Yes
Medical and Healthcare* No Yes Yes
Robot (Industrial 4.0) No No Yes
Automation (Industrial 4.0) No No Yes
Real Estate No No No
Food and Beverage Yes No Yes
4
Current Buyer Demand & China’s 5 Year Plan
5. Most Requested Sector –
Industrial
69%
17%
14% Industrial 4.0
• Robotics & Industrial
Automation
• Medical & Bio Automation
• Control Software
Devices &
Machinery
Others
• Packaging
• Military
• Material
Data Source: Seta Capital Investor Survey, Dealogic, Dealglobe, China Merger
6. Most Requested Sector –
Healthcare
Healthcare Services
Medical
Equipment
Others 26%
22%
22%
30%
Pharma
Data Source: Seta Capital Investor Survey, Dealogic, Dealglobe, China Merger
7. Most Requested Sector –
Automotive
Auto & Auto Parts
New Energy Cars
Shipbuilding
Aeronautic
88%
6%
6%
Data Source: Seta Capital Investor Survey, Dealogic, Dealglobe, China Merger
8. Most Requested Sector –
Energy & Resources
High Tech Energy
• Hydropower,
• Li-battery
• Etc.
Traditional
Energy
• Oil
• Gas
• Coal
• Etc.
Clean
Energy
• Wind
• Water
53%29%
18%
Data Source: Seta Capital Investor Survey, Dealogic, Dealglobe, China Merger
9. Most Requested Sector –
Infrastructure
Environmental
ProtectionLogistics
Social
Infrastructure
70%
10%
10%
10%
Construction
Consulting
Data Source: Seta Capital Investor Survey, Dealogic, Dealglobe, China Merger