SlideShare a Scribd company logo
1 of 59
www.pwc.com/hrs
A look at the key workforce
trends from around
the world using data
from PwC’s Saratoga
benchmarking database.
Key trends in
human capital 2012
A global perspective
2 Key trends in human capital 2012. A global perspective
About PwC Saratoga
PwC Saratoga is the recognised leader in the
measurement and benchmarking of human capital in
organisations, HR and finance function performance
and transformation. Our specialists help clients to
develop predictive analytics capability by identifying
connections between HR, people, functional and
organisational performance, using a range of
quantitative and qualitative tools. This is supported
by a global repository of metrics and qualitative best
practice information from more
than 2,400 organisations.
3Key trends in human capital 2012. A global perspective
Introduction 4
Global trends in human capital 6
A multi-speed global economy 8
Productivity gaps widen 12
A rocky road for rookies 16
Survivors disengaged 20
HR rising to the analytics challenge 25
Priorities for business 32
In conclusion 34
Behind the numbers 36
Contacts 37
Related PwC publications 38
Contents
4 Key trends in human capital 2012. A global perspective
Introduction
Welcome to the latest in PwC’s detailed studies of
Global Trends in Human Capital. In this fifth edition we
look more closely at how organisations and the global
workforce have been changed by the financial crisis
and economic downturn.
5
Our 2010 Global Trends paper was written
at a time of considerable upheaval, with
many organisations cutting back sharply
on costs and headcount as the recession
took hold. Two years on, business leaders
are more confident about the prospects
for growth, in spite of continued economic
turmoil. While competition is intense,
many organisations are emerging leaner
and more focused. The mantra is to
maximise return on investment (ROI)
in every area of the business, especially
human capital.
It’s all about talent management
In this quest for growth, talent
management remains a primary focus
area for business leaders. According to
our 15th Annual Global CEO Survey, 78%
of CEOs plan to make changes to talent
strategy in response to the global business
environment. There is a clear need for
professional skills and effective leadership
to operate in challenging markets, while
emerging markets require the talent to
deliver continued growth. But only 30%
of CEOs said they were confident that they
would have the talent they needed to grow
their organisation in the near future, and
31% said that talent constraints had already
hampered innovation at their organisation.
In such an environment, knowledge and
insight – in the form of human capital data
– is power. Human capital measurement
and analytics has progressed far in recent
years, evolving from the collection and
redistribution of basic workforce data
through HR systems to a more thoughtful
and targeted approach that mirrors more
general business data analytics. This
means joining up data from sources within
and outside HR, analysing trends and an
increasing focus on predictive analytics.
‘Knowledge and insight – in the form of human capital data – is
power.’
Talent strategy
78%
30%
31%
78% of CEOs plan to make changes to talent
strategy in response to the global business
environment
31% said that talent constraints had
already hampered innovation at their
organisation
Only 30% of CEOs said they were confident
that they would have the talent they needed
to grow their organisation in the near future
Key trends in human capital 2012. A global perspective
6
The global financial crisis has reinforced
the contrast between economies and
employment markets around the world.
Western Europe – and, for the first time,
parts of Central and Eastern Europe
– have felt the impact of the global
financial crisis and have seen revenue
per employee fall. Asia, by contrast,
has continued to grow. When existing
demographic trends are added to the mix,
it’s clear that multinational organisations
are facing sharply contrasting human
capital challenges from region to region.
Four key trends have emerged:
Global trends in
human capital
7Key trends in human capital 2012. A global perspective
1. 2. 3. 4.
Productivity gaps widen
Productivity dropped sharply in
developed economies in 2011,
making the regional differences
in productivity much more
pronounced. Latin America and
Asia-Pacific are now showing
far higher levels of productivity
than Europe, giving them a
strong competitive edge.
A rocky road for rookies
One of the major consequences
of the crisis is that
organisations in the West
have chosen experience over
youth, cutting back on the
recruitment of younger workers
and banking on the experience
of older workers to see them
through. While this strategy
has worked in the short term,
it’s storing up talent chain
supply problems for the future.
Survivors disengaged
The most significant – and
worrying – legacy of the
turmoil of the past few
years has been the impact
on employee engagement.
Employees in the West who
survived the cost-cutting cull
have been left disillusioned
and disengaged. The younger
generation has been hit
particularly hard as they see
their opportunities dwindle and
their career path blocked by
older workers who can’t afford
to retire. But poor employee
engagement isn’t just a Western
problem; it’s equally severe in
Asia, in spite of the high levels
of demand for younger talent,
where job-hopping has become
the norm.
Best practice in human
capital analytics
has arrived
The best organisations are
leading the way in using
analytics and the capabilities
of the HR function to make sure
that they get the most from the
investment in their people.
There’s been a huge investment
in human capital analytics in
recent years and it’s paying
dividends for organisations
that were ahead of the game.
The advancements in data
collection and analysis are
an enormous opportunity for
those who are prepared to take
advantage of them.
8
A multi-speed global economy
9Key trends in human capital 2012. A global perspective
It’s clear that the fallout from the global
financial crisis has been far-reaching, both
in terms of financial results and in the long-
term impact on the way companies operate.
There remains a clear divide between
organisations in developed economies,
which were inevitably hit hard during
the crisis, and the fast-growing emerging
economies, where talent supply remains a
critical issue.
The impact of the economic conditions is
by no means limited to Western Europe and
the US. There is evidence to suggest that
the impact is now being felt within Central
and Eastern Europe, with GDP per capita
growth for some economies in Eastern
Europe, such as the Czech Republic,
falling to levels similar to the UK and US.
Combined with rising wage costs in recent
years, parts of the CEE region are moving
beyond the period of demonstrably higher
human capital ROI to levels resembling
other European nations.
The major economies in Asia, by contrast,
have shown year-on-year increases in
economic output during the crisis, driven
by rapid industrialisation and an expanding
workforce in the manufacturing and
service industries. With low wage costs
and/or continuing growth in most parts of
Asia, many nations demonstrate far higher
human capital ROI than the West.
15%
10%
5%
0
-5%
-10%
$184,674
$180,733
$230,499
$228,472
$267,186
$344,432
$415,668
2006 2007 2008 2009 2010 2011
Source: World Bank
GDP per capita growth
China
Brazil
Japan
US
Czech R.
UK
India
CEE
UK
Western Europe
LATAM
Asia Pacific
US
$180,733
$184,674
$230,499
$267,186
$282,781
$338,773
$0k $350k
Annual growth in GDP per capita Revenue per FTE by region
Revenue per FTE ($)
10 Key trends in human capital 2012. A global perspective
Adapt and survive
We’ve seen significant changes to
employment markets in the West in the
wake of the financial crisis, as countries
adapt in order to maintain growth by
investing in the better-performing sectors.
In the US, the professional services sector
has seen an increase in revenue per
full-time employee (FTE) of 21.5%, as
businesses look for expert help in managing
the difficult economic conditions. In other
industries though, employees are seeing
fewer opportunities – the US technology
sector saw a 28.3% reduction in revenue
per FTE as organisations looked to reduce
back-office expenditure.
This is echoed in Western Europe, which
also saw a fall in revenue generated in
the technology sector. Engineering and
manufacturing, and the chemicals industry
have also suffered. The pharmaceuticals
sector, though, has enjoyed a small
increase in revenue in Europe, along with
the insurance industry and retail and
leisure sector, and should see continued
investment and innovation generating job
growth for Western economies.
Revenue per FTE
In the US, the professional
services sector has seen
an increase in revenue per
full-time employee (FTE)
of 21.5%, as businesses
look for expert help in
managing the difficult
economic conditions
Banking: Time for change?
The banking sector in Europe has faced
well-publicised problems in recent years,
with profit levels suffering as a result.
Five years ago, the sector was the most
successful in Europe in terms of the level
of shareholder return. But not any more.
Revenue per FTE has fallen sharply.
Pay remains high despite recent bonus
pool reductions and banks continue
to pay a higher average remuneration
than any other sector. The result is a
dramatic reduction in the value added
by employees; Human Capital ROI (HC
ROI) has fallen by 20% over the past
five years.
Performance-related pay in the sector
currently stands at similar levels to
2006/07, when banks were reporting
far higher levels of profit – showing that
compensation reductions potentially still
have some way to go.
The next few years will be critical to the
banking sector and success will depend
to a large extent on the effectiveness
of the pay reforms that are underway.
There are many challenges ahead.
Banking
2006/07 2007/08 2008/09 2009/10 2010/11
Human capital ROI 2.00 2.06 2.05 1.69 1.62
Average remuneration ($) 79,362 76,944 92,391 92,671 87,673
Performance-related pay (%) 8.7 17.1 16.5 15.8 14.4
21.5%
11Key trends in human capital 2012. A global perspective
“ Recognising that the world is somewhat split down
the middle between slow growth and rapid growth,
you’d better be able to operate in both at the same
time. You have to manage that difficult slow growth
and then completely switch gears and go to high
growth. You have to find ways of moving your
resources – and for us it’s talent – from where it’s
not being utilised to where it can be utilised.”
Brian Duperreault, President and Chief Executive
Officer of Marsh & McLennan Companies Inc.
Taken from the PwC 15th Annual CEO Survey
12
Productivity gaps widen
13Key trends in human capital 2012. A global perspective
LATAM
CEE
AsiaPac
Western Europe
UK
US
10%
14%
15%
24%
26%
30%
0% 30%
Remuneration/revenue by region
Remuneration/revenue (%)
The West can’t compete
on productivity
While developing economies are not
immune to the downturn, they have
managed to retain strong productivity
levels, particularly when compared against
Western Europe and the US. Productivity
levels in Western Europe had remained
relatively stable as organisations cut
back on employee numbers during the
downturn, but in 2011, productivity
dropped sharply. This places regions
such as Asia, Latin America and CEE in a
continued position of strength in terms
of competitiveness.
Employee costs rise, for less return
Further analysis shows that the fall in
productivity in Europe is driven by an
increase in average employee costs per
head. This is largely because organisations
have cut back on their recruitment
of new, raw talent and so have lower
numbers of younger and lower grade
employees, which has in turn increased
average remuneration levels. At the same
time revenue has fallen, meaning that
organisations are seeing a lower return on
their remuneration investment.
Lower return on remuneration investment
Organisations have cut back on their
recruitment of new, raw talent. This has
increased average remuneration levels.
At the same time revenue has fallen
Static
$55,000
$52,500
$50,000
$47,500
$45,000
$42,500
$40,000
24%
23.5%
23%
22.5%
22%
21.5%
21%
2007 2008 2009 2010 2011
Average remuneration ($) Remuneration/revenue (%)
Average remuneration rises in Europe
Average remuneration ($) Revenue/remuneration (%)
14 Key trends in human capital 2012. A global perspective
Saratoga data shows that average
remuneration has once again increased
in Europe to $54,942 (an increase of over
15%). The level of average remuneration
in the US continues to be significantly
higher than in Europe, a consequence
of the greater GDP per capita generated.
A higher level of benefits in the US,
which have continued to increase due to
healthcare-related costs, and the longer
number of hours that US employees
work, also contribute to the higher
average remuneration.
We track the return that organisations
are getting for their investment in their
people through Human Capital Return on
Investment (HC ROI), which is at its lowest
level in recent years in Western Europe
and the US, while in CEE the HC ROI fell
significantly after a period of year-on-
year increases.
HC ROI is particularly competitive in
the emerging markets of Asia-Pacific, in
some cases almost twice the level seen
in Western economies. But in the more
developed economies in Asia-Pacific, HC
ROI is only slightly higher than in Western
Europe and the US – the result of higher
employee costs. It will be difficult for many
countries to sustain competitive HC ROI
levels if salaries continue to rise at their
current rate.
US
Western Europe
CEE
UK
0% 100%
18.2
15.1
3.4
19.7
5.9
7.1
12.5
8.51
75.8
77.7
84.1
71.8
Remuneration in Europe and the US
Human Capital ROI
Benefits PRP Other compensation
UK
Western Europe
US
CEE
AsiaPac
LATAM
1.1
1.11
1.34
1.57
1.70
3.40
0 3.5
ROI
15
Measuring workforce return on investment
While it is dangerous to focus
on one measure to demonstrate
workforce ROI, our HC ROI
metric combines in a single
number the major components
of P&L performance with the
size and cost of the workforce. It
captures the interplay between
revenue generation, cost control
and human capital management
policy, something that revenue
per employee and profit per
employee can’t do. In fact, it’s
possible for an organisation to
report increases in revenue and
profit per employee, but falling HC
ROI, if these gains are being made
with more expensive people. HC
ROI only grows if profits increase
in combination with a managed
investment in people; in other
words, the concept of ‘doing more
with the same’ or ‘doing the same
with less’.
While fundamentally a formula
combining profit with workforce
costs, HC ROI is most usefully
expressed as:
Revenue - non-people costs
FTEs x average remuneration
This format provides insight to
the varying influence of the key
variables, and opportunities for
change. Used as a modelling tool
in this way, HC ROI can help show
the impact of HR programmes,
from reward strategy and
performance orientation, to
organisation design, workforce
planning, resourcing strategy and
employee engagement.
High HC ROI
Low HC Return on
Investment
High
HighLow
Low
Rate of economic/profit growth
Cost of workforce
Developing
(eg BRICs)
Maturing
(eg CEE)
Undeveloped
economies
Post-industrial
(e.g. Western
Europe, North
America)
Economic maturity impacts HC ROI
16
A rocky road for rookies
17Key trends in human capital 2012. A global perspective
Younger workers suffer in the West
Younger workers have been the biggest
casualty of the cutbacks and there has
been a noticeable trend for organisations
in Western Europe and the US to reduce
the number of middle and lower grade
employees. European metrics show that the
number of executives with more than three
years in the role has increased to 72.6%,
while the number of employees with less
than two years’ service (known as the
Rookie Ratio) has fallen sharply to 21.9%.
Overall, this represents a shift towards a
higher proportion of senior employees;
the organisational pyramid is becoming
narrower at the bottom and wider at
the top.
The crisis has clearly limited the
opportunities for younger employees in
Western economies. There appears to be a
strong demand for experienced employees
to guide organisations out of economic
difficulty, and investment in early talent
has suffered as a result. In PwC’s 15th
Global CEO survey,1 55% of business
leaders within Western economies rate the
recruitment and retention of ‘high-potential
middle management’ as a key challenge,
as opposed to just 32% for ‘young workers’.
While cutting back on the recruitment of
young talent may save on bottom-line costs
in the short term, it will inevitably affect
the availability of talent to fill key positions
over time. Organisations need to be
cautious during this period of careful cost
management that they aren’t cutting off the
talent pipeline at its source.
1 PwC 15th Annual Global CEO survey of over 1,200 business
leaders – 2012
Recruitment and retention a key challenge
55% of business leaders within Western
economies rate the recruitment and
retention of ‘high-potential middle
management’ as a key challenge
55%
“ But what is interesting and what is changing is that among
Western companies,
the ability to hire, develop and retain talent in the developing
economies has
become a major point of competitive differentiation.”
Marijn Dekkers, Chairman, Bayer AG
Taken from the PwC 15th Annual CEO Survey
18
Older workers dig in
A lack of new job opportunities for younger
workers is slowing the rate of generational
change in the workforce in some regions.
In the US for instance, the expected growth
in numbers of Generation Y employees
hasn’t occurred, with the workforce
representation of Generation X surpassing
the 50% mark in 2008, and increasing to
53% in 2010. As more Baby Boomers retire,
Generation X has now become the largest
workforce presence.
Evidence of a high proportion of Generation
X employees can be seen in the average
tenure findings in the US, which have
gradually increased in recent years.
There’s an expectation that average length
of tenure will be driven down by new
Generation Y employees, who want and
expect a varied career and who aren’t
particularly loyal to their employers; PwC’s
Millennials survey2 showed that only one
in five young employees expect to stay
with their current employer in the long
term. However, the analysis shows that
Generation Y does not yet represent a great
enough proportion of employees in the US
to impact overall workforce trends.
Asia-Pacific
CEE
LATAM
Western Europe
US
47
51
70
112
113
0 months 120 months
Average tenure (months)
2 PwC ‘Millennials at work: Reshaping the workplace’ –
December 2011
19
The hiring race continues in Asia
The continuing talent supply problems
in Asia, coupled with aggressive growth
strategies and high levels of employee
churn have resulted in recruitment rates
that are approximately twice as high as in
Europe and the US (at 22%). The average
tenure for employees in Asian organisations
is just under four years.
Despite the prevailing economic
uncertainty, we expect hiring demand will
continue to rise in Asia. Even as labour
costs rise in some fast-growing economies,
business leaders have set out ambitious
plans to expand workforces: 55% of
Asia-Pacific CEOs expect to increase their
company’s headcount over the next 12
months. As a result of this rapid growth,
acquiring talent in the external market is
becoming more challenging and expensive;
43% of CEOs tell us that it has become more
difficult to hire talent in their industry. The
problem is particularly acute in China and
Hong Kong, and South-East Asia where
the proportion rises to nearly 60%. This
suggests that there is an urgent need to
strengthen recruitment and workforce
planning processes.
“ As emerging markets accelerate – or maybe the rest of
the world decelerates – there is a significant sense of
urgency. There is the sense that it may already be too
late to place your bets. A second factor to consider is
that it is much more difficult to get into those markets
because of their attitude change. They feel that post-
2008 they have less to learn from the West.”
Lázaro Campos CEO, SWIFT, Belgium
Taken from the PwC 15th Annual CEO Survey
Source: PwC Saratoga analysis
Asia-Pacific (overall)
Asia-Pacific (advanced)
Asia-Pacific (emerging)
United States
Western Europe
22%
21%
24%
10%
11%
0% 25%
External recruitment rate
20
Survivors disengaged
21Key trends in human capital 2012. A global perspective
Engagement is a problem
Employee engagement is the mantra
for HR, as it is critical to performance.
Low levels of employee engagement
tend to result in a higher turnover of
employees, less discretionary effort and
lower productivity.
The data highlights the employee retention
issues that are endemic in Asia. The
median resignation rate for Asia is 15.2%,
approximately twice as high as in Europe
and the US. This is symptomatic of a job
market where frequent changes of role are
the norm for many employees; a recent
survey of 2,200 managers in China showed
that two-thirds had received a competing
job offer in the previous 18 months.3 The
turnover for new hires is even greater,
with 19.2% resigning in the first year of
service.4 The evidence suggests that this
trend is likely to continue and is becoming
an established element of employee culture
in Asia.
In contrast to Asia, the data from CEE
shows a sharp reduction in resignation
rates. At first glance this appears to be a
positive indicator; however, local PwC
experience suggests that resignation rates
have fallen simply because employees
are finding it more difficult to find a new
job. This has already been seen in Latin
America, where high unemployment rates
and competition for jobs have driven down
resignations to just 6.3%.
LATAM
Western Europe
US
UK
CEE
Asia-Pacific
6%
7%
8%
9%
10%
15%
0% 20%
Asia-Pacific (overall)
Asia-Pacific (advanced)
Asia-Pacific (emerging)
United States
Western Europe
19%
20%
18%
14%
13%
0% 20%
Resignation rate by region
Resignation rate <1 year (%)
First-year resignations
19.2%
19.2% of new hires in
China resign in the first
year of service
3 MRI China Group Talent Environment Index, 2010
4 ‘Breaking out of the talent spiral: Key human capital trends in
Asia-Pacific’, PwC 2012
22 Key trends in human capital 2012. A global perspective
The engagement problem in Western
Europe is equally pressing. Unemployment
is high and as a result many employees
are choosing to stay in their current role
for the sake of security. While this means
that retention in the short term is good, the
danger is that the continuing lack of job
opportunities has limited the long-term
career choices for employees – and there is
evidence of employee unrest as a result.
Getting reward right
Employee and executive reward continue
to be high on the agenda. Recent
years have seen an increased focus on
remuneration governance, with pressure
from stakeholders to ensure reward policies
are wholly aligned with achieving business
objectives. Analytics have a critical role to
play here in ensuring that organisations
are paying employees at the right level
through a reward structure that drives
sustainable performance.
In Asia, many organisations are feeling
the dual impact of strong competition
for talent, but a low level of engagement
among employees. Variable pay features
heavily in Asia, accounting for almost a
fifth of total compensation, compared with
13% in the US and 11% in Western Europe,
driven by higher financial returns.
A primary focus of an organisation’s pay
strategy should be to incentivise employees
to deliver sustainable performance. The
well-publicised failure of the executive pay
model in the West to deliver this outcome
has resulted in increasing pressure for
reform from stakeholders. Research into
incentives by PwC5 has shown that a total
shareholder return approach to reward
produces arbitrary outcomes, while studies
into human reaction to risk suggest that
modern long-term incentives (LTIs) are
not having the desired impact on executive
performance, and so are designed to fail.
HR should closely analyse the LTIs that are
so often used today to ensure they really do
add value. Pay models need to be relevant
to the business outcome, with ambiguity
in pay structure one of the key causes of
misalignment. Organisations that take an
innovative approach are achieving the best
outcomes here, and are able to strengthen
their pay models through links between pay
and sustainable long-term performance.
5 ‘ Making executive pay work: The psychology of incentives’
PwC UK, 2012
“ Performance-related pay has now become ubiquitous
and forms a major part of the pay package for
companies globally. However, we have found that
companies are struggling to align rewards with
corporate strategy and individual performance
management, and so frequently do not get the results
they desire from their incentives spend.”
Tom Gosling, partner and head of reward consulting,
PwC UK
23
“ The demographic changes that we see occurring in
many of the regions where we operate – shrinking
populations, an ageing workforce and diversifying
demographics – compounds the challenges we face
and intensifies the war for talent.”
Dr Rüdiger Grube Chairman and CEO, Deutsche Bahn AG,
Germany. Taken from the PwC 15th Annual CEO Survey
25Key trends in human capital 2012. A global perspective
HR rising to
the analytics
challenge
Human capital is a vital asset for organisations worldwide.
Business
leaders are looking for growth and human capital makes this
possible,
but is too often treated as purely an operational cost rather than
an
investment. While there is no doubt that the economic
environment
in countries worst affected by the crisis calls for prudence, it is
also
important that organisations adopt a mindset focused on driving
value
from their workforce, not just reducing its cost. HR has a vital
role to
play in this.
26 Key trends in human capital 2012. A global perspective
HR transformed
In response to this increasing demand for
strategic workforce management, there
have been extensive changes to the way
HR is delivered in many organisations.
These include a rapid development in the
skills and capability of HR professionals,
improvements in HR technology, and a
move towards centralised HR delivery
models that are structured by specialism.
In the best organisations, the result has
been an innovative change in the way HR
services are delivered – so much so, that
we’ve seen a rapid improvement in best
practice in many areas, including strategic
reward modelling, talent management and
workforce planning.
The bar has also been raised in terms
of best practice HR measurement and
analytics. Improvements in capability
and technology have allowed the best
organisations to advance measurement
practices. Many effective HR management
information methods are available and this
is a great opportunity for HR functions to
show that they can add real value.
A minority of CEOs get comprehensive reports on their
workforce
Q: When making decisions, how important is it to have
information on each of the following talent-
related areas? For those areas that are important to you, how
adequate is the information you
currently receive?
Percentage of CEOs who believe
the relevant information is
important or very important
Do not
receive
information
Adequate
but would
like it now
Not
adequate
Information
received is
comprehensive
HR Transformation: Key Changes to the HR function and
management information
1st Generation 2nd Generation
HR function • Review HR delivery model
• Development of Centres of
Excellence
• Re-engineering HR processes to
improve effectiveness
• Focused HR strategy execution
• Global standards for HR delivery
• Continued HR process excellence
• Senior executive sponsors for
HR interventions
HR
management
information
• Implement workforce measures/
balanced scorecards
• Use benchmarks to track
HR effectiveness
• ROI analysis of HR function activities
• Workforce analytics and forecasting
• Strategic workforce planning
• Alignment of HRMI across
process areas
Percentage of CEOs
Information
Gap:
CEOs believe
information is
important but
don’t receive
comprehensive
reports
Source: PwC’s 15th Annual Global CEO survey, 2012
Staff
productivity
Employees
views and
needs
Labour costsAssessments
of internal
advancement
Return on
investment
on human
capital
Costs of
employee
turnover
100%
80%
60%
40%
20%
0
27Key trends in human capital 2012. A global perspective
20%: Ad hoc/�no formal
approach
75%: established
measurement programme
<5%: full workforce
analytics capability
A minority of CEOs get comprehensive reports on their
workforce
The current state of human capital analyticsUnfulfilled potential
In a recent client poll we found that around
75% of organisations have an established
approach to people measurement
incorporating mainstream techniques such
as KPIs, dashboards and benchmarking.
However, no more than 5% of organisations
have, or are developing, a full analytics
capability. This comes at a time when
talent issues are back at the top of CEO
agendas and they are seeking more insight
and impact from HR on workforce analysis.
20% 75% 5%
28 Key trends in human capital 2012. A global perspective
Predictive analysis
HR is increasingly turning to analytics as
a key tool to provide evidence and insight
to support decision-making, but even so,
still lags behind the use of analytics in
other business disciplines such as sales
and marketing. If HR is to prove its worth
as a strategic function, it needs to go one
step further and explore patterns and
correlations in the data, to provide the
evidence and analysis business leaders
need to improve people performance.
Although predictive analytics in HR is
still in its infancy, an increasing number
of multinationals, particularly in the
financial services, professional services
and technology sectors are beginning to
build predictive solutions. Organisations
that are focused on talent to drive growth
are especially keen on developing solutions
that predict employee exit risks, or new
hire quality. The ultimate aim should be to
introduce predictive analysis that drives
workforce planning and produces results
that are genuinely helpful.
Predictive solutions in workforce management
Hiring Turnover Performance Engagement Workforce
planning
Predict new
hire quality
Predict
success of
hiring source
Predict flight
risks
Predict
retirement
Predict
performance
Predict
absenteeism
Predict
impact of
engagement
drivers
Predict impact
on business
performance
Predict
employee
demand
Predict supply
by role
Driving employee engagement is often
a key focus of HR strategy. Ultimately,
overall productivity levels and financial
results can be used as indicators of past
engagement levels. However, there is more
strategic value in using human capital
analytics such as absence and recruitment
rates, grievances, resignation rates and
productivity indicators to provide insight
into the impact of current engagement on
future business results. An increasing
number are, however, reflecting the need for
analytical skills in their hiring decisions for
the HR function.
29
Human capital reporting in the spotlight
While financial information will always
be at the heart of an organisation’s
reporting, stakeholders now expect
information to cover more intangible
aspects such as the risks and
opportunities that could influence
future prospects. Human capital – often
the most valuable intangible asset in
an organisation as well as the largest
controllable cost – is a key piece of
this jigsaw.
Human capital disclosures in corporate
reports have improved steadily over the
past decade, prompted by the greatly
increased scrutiny on organisations from
shareholders, regulators, governments
and other external stakeholders. It’s
become more common for organisations
to provide human capital measures
within their main annual report, often
supported by strategic analysis of the
organisation’s workforce management.
This trend is reflected globally, as
corporate reporting initiatives such
as the EC-sponsored project Valuing
Non-Financial Performance6 and the
International Integrated Reporting
framework being developed by the
International Integrated Reporting
Committee7 (IIRC), recognise the need
for better alignment of human capital
and broader business reporting.
Despite the improvements in human
capital reporting, it’s clear that there
is still a lot to be done. PwC’s annual
award for ‘people reporting’ in the
UK’s largest companies,8 for instance,
showed that only 33% of companies set
out a clear link between their people
strategy and business strategy, and only
4% referred to the ROI delivered by
their workforce. While organisations
are better at describing what human
capital is, they still struggle to provide
disclosures describing why it’s essential
to achieving business priorities. A
detailed description of the actual value
of human capital within an organisation
is very rare.
“ Human capital is central to the corporate reporting
model set out within the IIRC’s recently released
proposals for an International Integrated Reporting
Framework. The discussion paper, ‘Towards
Integrated Reporting: Communicating Value in
the 21st Century’, recognises that the drivers of
corporate performance have changed and that,
for many companies, the frequently cited mantra
‘people are the key to our success’ needs to be better
reflected within company disclosure. We are seeing a
rapid evolution in corporate reporting in response.”
Jessica Fries, Integrated Reporting, PwC UK and
IIRC Board Director
6 www.investorvalue.org
7 www.theiirc.org
8 Building Public Trust Awards UK
30 Key trends in human capital 2012. A global perspective
Addressing talent supply
Four out of five companies surveyed in
PwC’s Asia-Pacific study do not have
dedicated HR resources responsible for
talent management strategy
The ongoing talent supply problems faced
by organisations in Asia have inevitably
occupied a significant amount of HR’s
time, often at the expense of longer
term workforce planning and talent
management. Strong growth and rapidly
changing economies have meant that
workforce strategies in the region tend to
be reactive to changes in overall business
strategy, rather than proactively driving
business outcomes, and HR functions are
invariably operational and non-strategic.
The need to effectively plan and implement
changes in workforce structure is a key
challenge for many organisations as they
seek to take advantage of growing Asian
markets. For many, this will mean radically
reinventing their approach to talent,
and a targeted investment in strategic
HR processes.
Addressing talent supply
Four out of five companies surveyed in
PwC’s Asia-Pacific study do not have
dedicated HR resources responsible for
talent management strategy
80%
31
“ Short-term foresight and slow reaction to people issues are
barriers
to driving financial performance in the growing Asian markets.
We’ve seen a tendency for organisations to use a traditional
approach to workforce planning when a more strategic approach
is required. This entails annual forecasts of supply and demand;
however in this very dynamic region, we need much better
transparency and control on a monthly basis.”
Adam Salzer, Director in Consulting, PwC Hong Kong
32 Key trends in human capital 2012. A global perspective
Priorities for business
33Key trends in human capital 2012. A global perspective
Businesses remain ambitious despite
the economic environment and CEOs
continue to plan for growth. Intelligent
workforce planning will be a vital element
of any strategy and the organisations
that stand out against the competition
will be those that are able to harness
the newly developed potential of human
capital analytics.
There are important messages
to remember:
Learn from the best. The talent supply
chain should be managed with the same
rigour as every other vital resource. The
development of predictive analysis in
human capital measurement is a strong
opportunity for organisations at a time
when everyone is working to coax the most
out of their people. Best practice is already
emerging, and there’s much to learn from
those that are ahead of the curve.
Focus on productivity. Make sure all your
talent management interventions have the
right impact on productivity and contribute
to creating value. Keep a close eye on the
key measures and how your peers are
performing. CEOs need help and HR needs
to take a lead.
Concentrate on engagement. Employee
engagement is clearly a problem, both for
the West where low levels of engagement
are the legacy of the financial crisis, and
in Asia, where job-hopping has become
standard practice. Engaged employees are
productive employees.
Think carefully about reward. Too many
organisations are placing emphasis over
performance-based and variable pay, when
the evidence is mounting that incentives
don’t necessarily work. Different sections
of the workforce are motivated by different
things and non-financial rewards are
increasingly valued by employees.
Look out for rookies. The Millennial
generation has been hardest hit by the
downturn, but time will make them the
dominant force in future workforces.
Organisations in Asia are already
struggling with their propensity to switch
jobs frequently – finding ways to persuade
young people to stay should be a priority.
Invest in analytics. Organisations have
been late to recognise the value of good
quality HR management information
affecting their ability to be a strategic
contributor. HR strategy should
reflect a commitment to acquiring the
systems and skills to build credible
analytics capabilities.
But select your metrics wisely.
Technological advances and the growing
interest in human capital analytics means
that the volume of information has
increased exponentially, but not always to
great effect. The key to success is intelligent
and targeted use of the data available.
34 Key trends in human capital 2012. A global perspective
In conclusion
Organisations cannot realise their growth
potential without the people to make it happen.
Businesses that develop a well-informed and
proactive approach to strategic workforce
planning have an opportunity to gain a crucial
competitive edge. Getting talent management
right means you can worry less about
your talent problems and more about your
business opportunities.
Whatever the size or shape of your business,
we believe there are four fundamentals to
talent management:
35Key trends in human capital 2012. A global perspective
1. 2. 3. 4.
Align your business plan
and talent strategy – make
sure every aspect of your talent
strategy directly contributes
to your overall business plan
and to creating value. Change
anything that doesn’t.
Face the future – look at
where your business is heading,
not just where you’ve been.
Keep questioning whether your
talent management pipeline
will give you what you need
when you need it.
Pay attention to pivotal
roles – get the right talent
into the roles that have a
disproportionate ability
to create (or destroy)
business value.
Focus on the financials
– make measurement,
benchmarking and predictive
analytics part of your plan.
Look to your people ROI.
36 Key trends in human capital 2012. A global perspective
Behind the numbers
PwC Saratoga has developed and applied
meaningful metrics to help organisations to
maximise their ROI for over 30 years.
Today, we integrate employee attitudinal
research and metrics to drive execution
action and support clients who are looking
to develop and deploy dashboards,
employee surveys, predictive solutions,
conduct workforce planning initiatives and
benchmark the workforce and HR function.
For this study, we integrated findings from
our Saratoga teams in the US, Western
Europe, AsiaPac, LATAM and CEE, in order
to look closely at comparisons between
key workforce effectiveness measures,
drawing on our global database of over
2,400 organisations.
As part of our approach, we analyse data
submitted by client organisations for over
60 metrics. The following selected metrics
have been used within this report.
Metrics formulae
Human capital impact
Human capital return on investment
(HC ROI)
X : 1 (Profit before tax + Compensation +
Benefits) ÷ (Compensation + Benefits)
Revenue per FTE $ Revenue ÷ Total FTEs
Remuneration/Revenue % (Compensation + Benefits) ÷ Revenue
Compensation and benefits
Variable pay % (Performance related pay + Attendance-
related pay) ÷ Compensation
Performance-related pay % Performance-related pay ÷
Compensation
Average remuneration $ (Compensation + Benefits ) ÷ Total
FTEs
Human capital engagement
Resignation rate % Resignations ÷ Headcount
Resignation rate < 1 year % Resignations less than 1 year ÷
Headcount
less than 1 year
High performer turnover rate % High performer turnover ÷ High
performer
headcount
External recruitment rate % External recruits ÷ Headcount
Organisation and workforce structure
Rookie ratio % Headcount less than 2 years of service ÷
Headcount
Executive stability ratio % Executive Directors less than 3 years
service ÷ Executive directors
FTEs per HR Department FTE X : 1 FTEs ÷ HR Department
FTEs
37Key trends in human capital 2012. A global perspective
Contacts
To discuss the issues highlighted in this report, please contact
your local PwC contact, or one of the following:
Key contacts
Richard Phelps
Global Leader Human Resource
Management Consulting
+44 20 7804 7044
[email protected]
Justine Brown
Marketing
Human Resource Services
+44 113 289 4423
[email protected]
North America
Scott Olsen
+1 646 471 0651
[email protected]
Nik Shah
[email protected]
+1 703 918 1208
Western Europe
Peter De Bley
+32 2 710 43 21
[email protected]
Jon Andrews
+44 20 7804 9000
[email protected]
Central and Eastern Europe
Zsolt Szelecki
+3614619733
[email protected]
Middle East
Christopher Box
+974 4419 2852
[email protected]
Africa
Gerald Seegers
+27 (11) 797 4560
[email protected]
China /Hong Kong
Mandy Kwok
+852 2289 3900
[email protected]
Adam Salzer
+852 2289 5033
[email protected]
Singapore
Thorsen Barth
+65 6236 4382
[email protected]
India
Sankar Ramamurthy
+91 (124) 4620560
[email protected]
Australia
Victoria Keesing
+61 (2) 8266 0035
[email protected]
Brazil
Joao Lins
+55 11 3674 3941
[email protected]
Acknowledgements
Our thanks go to the contributors from
our Saratoga teams across the world,
who contributed to writing this report.
Particular thanks go to Jonathan Moses
(UK), Michael Wood (Australia),
Jon Burton (US), Abu Amin (Singapore),
Parul Dattani (Research) and
Seema Shah (Research).
38 Key trends in human capital 2012. A global perspective
Related PwC publications
Are you engaging the
right employees for the
right reasons?
www.pwc.com/hrs
Engaging your
pivotal talent
December 2011
www.pwc.com
Managing tomorrow’s people
Millennials at work
www.pwc.com/talentmanagement
15th Annual Global
CEO Survey.
Delivering results through talent
The HR challenge in a volatile world
www.pwc.com/hrs
A global study into
the impact of pay
and incentives on
senior executives.
Making executive pay work
The psychology of incentives
PwC Saratoga Asia-Pacific
www.pwc.com/saratoga
Breaking out
of the talent spiral
Key human capital
trends in Asia-Pacific
Millennials at work:
Reshaping the workplace,
2011
This report looks into the mind
of new graduates from all over
the world, who are entering
the workforce for the first
time, and how their attitude
and expectations have shifted
in response to the economic
downturn in many parts of
the world.
It also looks at the strategies
employers could consider
to continue attracting and
retaining these key talents.
Engaging your pivotal
talent, 2011
Companies often focus on
retaining star performers or
leadership talent, overlooking
pivotal roles – jobs that
have an outsized ability to
create (or destroy) the value
customers expect.
In this report we explore how
organisations are identifying
and engaging their pivotal
people and make some
suggestions to help proactive
organisations stay ahead.
US Human Capital
Effectiveness Report, 2012
As the US economy slowly
recovers, key challenges are
emerging for HR. Hiring
is trending upward, but
productivity is declining. The
employment uptick has brought
higher voluntary turnover
rates, but not for new hires.
Organisations that understand
and adapt to this seemingly
contradictory environment
will gain the most from their
investment in the workforce.
This report looks at data
from more than 300 US
organisations and offers
observations to help business
leaders understand the
dynamics of the US labour
market today.
Delivering results through
talent: The HR challenge in
a volatile world, 2012
PwC’s 15th Annual Global
CEO Survey found that
issues around talent are once
again top of mind. CEOs are
recognising that their current
strategies for managing talent
no longer fit – 78% of CEOs say
they will make a change.
This report takes a closer look
at business leaders’ talent
problems – and at the actions
leading businesses are taking.
Making executive pay
work: The psychology of
incentives, 2012
The debate about executive
pay has mostly focused on
whether shareholders are
getting what they want and
if current levels of executive
pay are acceptable. If pay
were genuinely motivating
executives towards higher
performance, there would
surely be less controversy about
the subject. But is it?
Our study in conjunction
with the London School of
Economics and Political
Science, reveals a number of
common behavioural traits,
which show clearly that
executives aren’t necessarily
motivated the way many
employers assume.
Breaking out of the talent
spiral 2012
As the Asia-Pacific talent
market continues to evolve,
companies face challenges
in terms of attracting talent,
retaining and rewarding
employees. These challenges
have resulted in many
organisations being trapped
in a talent spiral of ever-
increasing cost, which
ultimately impacts bottom lines
and shareholder value.
In this report our Asia-Pacific
Saratoga team report on key
trends in human capital across
the region.
39Key trends in human capital 2012. A global perspective
PwC firms help organisations and individuals create the value
they’re looking for. We’re a network of firms in 158 countries
with close to 169,000 people who are committed to
delivering quality in assurance, tax and advisory services. Tell
us what matters to you and find out more by visiting us at
www.pwc.com.
This publication has been prepared for general guidance on
matters of interest only, and does not constitute professional
advice. You should not act upon the information contained
in this publication without obtaining specific professional
advice. No representation or warranty (express or implied) is
given as to the accuracy or completeness of the information
contained in this publication, and, to the extent permitted by
law, PwC does do not accept or assume any liability,
responsibility or duty of care for any consequences of you or
anyone else acting, or refraining to act, in reliance on the
information contained in this publication or for any decision
based on it.
© 2012 PwC. All rights reserved. PwC refers to the PwC
network and/or one or more of its member firms, each of which
is a separate legal entity. Please see www.pwc.com/structure
for further details.
Design Services 27600 (07/12).
www.pwc.com/hrs

More Related Content

Similar to www.pwc.comhrsA look at the key workforce trends from a.docx

2019 HRflag Global 50 HR Services Listed Companies
2019 HRflag Global 50 HR Services Listed Companies2019 HRflag Global 50 HR Services Listed Companies
2019 HRflag Global 50 HR Services Listed CompaniesHRflag
 
Fundamental Cost Reduction - Manufacturship
Fundamental Cost Reduction - ManufacturshipFundamental Cost Reduction - Manufacturship
Fundamental Cost Reduction - ManufacturshipMichael McLean
 
Etude PwC sur le BFR (2013)
Etude PwC sur le BFR (2013)Etude PwC sur le BFR (2013)
Etude PwC sur le BFR (2013)PwC France
 
Hays-GSI-Report-2016
Hays-GSI-Report-2016Hays-GSI-Report-2016
Hays-GSI-Report-2016David Cawley
 
Hays Global Skills Index 2016
Hays Global Skills Index 2016Hays Global Skills Index 2016
Hays Global Skills Index 2016Hays
 
Etude PwC "Fit for business" sur les entreprises de l'Eurozone (nov. 2014)
Etude PwC "Fit for business" sur les entreprises de l'Eurozone (nov. 2014)Etude PwC "Fit for business" sur les entreprises de l'Eurozone (nov. 2014)
Etude PwC "Fit for business" sur les entreprises de l'Eurozone (nov. 2014)PwC France
 
The Irrepressible Entrepreneur
The Irrepressible EntrepreneurThe Irrepressible Entrepreneur
The Irrepressible EntrepreneurRegus
 
Hays Global Skills Index 2015
Hays Global Skills Index 2015Hays Global Skills Index 2015
Hays Global Skills Index 2015Hays
 
Hays global skills index 2015
Hays global skills index 2015Hays global skills index 2015
Hays global skills index 2015Hays Netherlands
 
What Asia Pacific business leaders think 2012
What Asia Pacific business leaders think 2012What Asia Pacific business leaders think 2012
What Asia Pacific business leaders think 2012Cristina Ampil
 
Global Capital Confidence Barometer | How can you reshape your future before ...
Global Capital Confidence Barometer | How can you reshape your future before ...Global Capital Confidence Barometer | How can you reshape your future before ...
Global Capital Confidence Barometer | How can you reshape your future before ...EY
 
2) Building The Future of Work.pdf
2) Building The Future of Work.pdf2) Building The Future of Work.pdf
2) Building The Future of Work.pdffaisalandrianto2
 
Leading in extraordinary times, the 2015 US CEO Survey
Leading in extraordinary times, the 2015 US CEO SurveyLeading in extraordinary times, the 2015 US CEO Survey
Leading in extraordinary times, the 2015 US CEO SurveyOmar Toor
 
EY Global Capital Confidence Barometer (12th Edition)
EY Global Capital Confidence Barometer (12th Edition)EY Global Capital Confidence Barometer (12th Edition)
EY Global Capital Confidence Barometer (12th Edition)EY
 
Hays Global Skills Index 2018
Hays Global Skills Index 2018Hays Global Skills Index 2018
Hays Global Skills Index 2018Hays
 
Small and Medium Enterprises
Small and Medium EnterprisesSmall and Medium Enterprises
Small and Medium EnterprisesDr Lendy Spires
 
Cgap small-and-medium-enterprises-jan-2011
Cgap small-and-medium-enterprises-jan-2011Cgap small-and-medium-enterprises-jan-2011
Cgap small-and-medium-enterprises-jan-2011Dr Lendy Spires
 
Opportunities in adversity
Opportunities in adversityOpportunities in adversity
Opportunities in adversityNicholas Bruneau
 

Similar to www.pwc.comhrsA look at the key workforce trends from a.docx (20)

2019 HRflag Global 50 HR Services Listed Companies
2019 HRflag Global 50 HR Services Listed Companies2019 HRflag Global 50 HR Services Listed Companies
2019 HRflag Global 50 HR Services Listed Companies
 
Fundamental Cost Reduction - Manufacturship
Fundamental Cost Reduction - ManufacturshipFundamental Cost Reduction - Manufacturship
Fundamental Cost Reduction - Manufacturship
 
Etude PwC sur le BFR (2013)
Etude PwC sur le BFR (2013)Etude PwC sur le BFR (2013)
Etude PwC sur le BFR (2013)
 
Hays-GSI-Report-2016
Hays-GSI-Report-2016Hays-GSI-Report-2016
Hays-GSI-Report-2016
 
Hays-GSI-Report-2016
Hays-GSI-Report-2016Hays-GSI-Report-2016
Hays-GSI-Report-2016
 
Hays Global Skills Index 2016
Hays Global Skills Index 2016Hays Global Skills Index 2016
Hays Global Skills Index 2016
 
Etude PwC "Fit for business" sur les entreprises de l'Eurozone (nov. 2014)
Etude PwC "Fit for business" sur les entreprises de l'Eurozone (nov. 2014)Etude PwC "Fit for business" sur les entreprises de l'Eurozone (nov. 2014)
Etude PwC "Fit for business" sur les entreprises de l'Eurozone (nov. 2014)
 
Tcb c-suite-challenge-2020-hot-button-issues
Tcb c-suite-challenge-2020-hot-button-issuesTcb c-suite-challenge-2020-hot-button-issues
Tcb c-suite-challenge-2020-hot-button-issues
 
The Irrepressible Entrepreneur
The Irrepressible EntrepreneurThe Irrepressible Entrepreneur
The Irrepressible Entrepreneur
 
Hays Global Skills Index 2015
Hays Global Skills Index 2015Hays Global Skills Index 2015
Hays Global Skills Index 2015
 
Hays global skills index 2015
Hays global skills index 2015Hays global skills index 2015
Hays global skills index 2015
 
What Asia Pacific business leaders think 2012
What Asia Pacific business leaders think 2012What Asia Pacific business leaders think 2012
What Asia Pacific business leaders think 2012
 
Global Capital Confidence Barometer | How can you reshape your future before ...
Global Capital Confidence Barometer | How can you reshape your future before ...Global Capital Confidence Barometer | How can you reshape your future before ...
Global Capital Confidence Barometer | How can you reshape your future before ...
 
2) Building The Future of Work.pdf
2) Building The Future of Work.pdf2) Building The Future of Work.pdf
2) Building The Future of Work.pdf
 
Leading in extraordinary times, the 2015 US CEO Survey
Leading in extraordinary times, the 2015 US CEO SurveyLeading in extraordinary times, the 2015 US CEO Survey
Leading in extraordinary times, the 2015 US CEO Survey
 
EY Global Capital Confidence Barometer (12th Edition)
EY Global Capital Confidence Barometer (12th Edition)EY Global Capital Confidence Barometer (12th Edition)
EY Global Capital Confidence Barometer (12th Edition)
 
Hays Global Skills Index 2018
Hays Global Skills Index 2018Hays Global Skills Index 2018
Hays Global Skills Index 2018
 
Small and Medium Enterprises
Small and Medium EnterprisesSmall and Medium Enterprises
Small and Medium Enterprises
 
Cgap small-and-medium-enterprises-jan-2011
Cgap small-and-medium-enterprises-jan-2011Cgap small-and-medium-enterprises-jan-2011
Cgap small-and-medium-enterprises-jan-2011
 
Opportunities in adversity
Opportunities in adversityOpportunities in adversity
Opportunities in adversity
 

More from ericbrooks84875

Fundamentals of Risk and InsuranceEmmEtt J. Vaughan • .docx
Fundamentals of Risk and InsuranceEmmEtt J. Vaughan   •   .docxFundamentals of Risk and InsuranceEmmEtt J. Vaughan   •   .docx
Fundamentals of Risk and InsuranceEmmEtt J. Vaughan • .docxericbrooks84875
 
Fungi reproduce ___________________________ by fragmentation, buddin.docx
Fungi reproduce ___________________________ by fragmentation, buddin.docxFungi reproduce ___________________________ by fragmentation, buddin.docx
Fungi reproduce ___________________________ by fragmentation, buddin.docxericbrooks84875
 
Full-Circle LearningMyLab™ Learning Full Circle for Mar.docx
Full-Circle LearningMyLab™ Learning Full Circle for Mar.docxFull-Circle LearningMyLab™ Learning Full Circle for Mar.docx
Full-Circle LearningMyLab™ Learning Full Circle for Mar.docxericbrooks84875
 
Functional Behavior Assessment ExampleStudent NameInes SalazarD.docx
Functional Behavior Assessment ExampleStudent NameInes SalazarD.docxFunctional Behavior Assessment ExampleStudent NameInes SalazarD.docx
Functional Behavior Assessment ExampleStudent NameInes SalazarD.docxericbrooks84875
 
Functional Requirements Document TemplateVersionDescription .docx
Functional Requirements Document TemplateVersionDescription .docxFunctional Requirements Document TemplateVersionDescription .docx
Functional Requirements Document TemplateVersionDescription .docxericbrooks84875
 
Fully answer any ONE of the following essay questions1.  Is the.docx
Fully answer any ONE of the following essay questions1.  Is the.docxFully answer any ONE of the following essay questions1.  Is the.docx
Fully answer any ONE of the following essay questions1.  Is the.docxericbrooks84875
 
Fully answer any ONE of the following essay questions1.  Is t.docx
Fully answer any ONE of the following essay questions1.  Is t.docxFully answer any ONE of the following essay questions1.  Is t.docx
Fully answer any ONE of the following essay questions1.  Is t.docxericbrooks84875
 
From the weeks chapter reading, we learn from the authors that,.docx
From the weeks chapter reading, we learn from the authors that,.docxFrom the weeks chapter reading, we learn from the authors that,.docx
From the weeks chapter reading, we learn from the authors that,.docxericbrooks84875
 
FTER watching the videos and reviewing the other materials in this.docx
FTER watching the videos and reviewing the other materials in this.docxFTER watching the videos and reviewing the other materials in this.docx
FTER watching the videos and reviewing the other materials in this.docxericbrooks84875
 
fter completing the reading this week, we reflect on a few key conce.docx
fter completing the reading this week, we reflect on a few key conce.docxfter completing the reading this week, we reflect on a few key conce.docx
fter completing the reading this week, we reflect on a few key conce.docxericbrooks84875
 
FS-3FORD MOTOR COMPANY AND SUBSIDIARIESCONSOLIDATED INCO.docx
FS-3FORD MOTOR COMPANY AND SUBSIDIARIESCONSOLIDATED INCO.docxFS-3FORD MOTOR COMPANY AND SUBSIDIARIESCONSOLIDATED INCO.docx
FS-3FORD MOTOR COMPANY AND SUBSIDIARIESCONSOLIDATED INCO.docxericbrooks84875
 
Fromm’s concept of the syndrome of decay included three personality .docx
Fromm’s concept of the syndrome of decay included three personality .docxFromm’s concept of the syndrome of decay included three personality .docx
Fromm’s concept of the syndrome of decay included three personality .docxericbrooks84875
 
From your readings in Chapter 4, choose one of the organizational sy.docx
From your readings in Chapter 4, choose one of the organizational sy.docxFrom your readings in Chapter 4, choose one of the organizational sy.docx
From your readings in Chapter 4, choose one of the organizational sy.docxericbrooks84875
 
From your daily briefs, Kaiser Health News Morning Briefing or P.docx
From your daily briefs, Kaiser Health News Morning Briefing or P.docxFrom your daily briefs, Kaiser Health News Morning Briefing or P.docx
From your daily briefs, Kaiser Health News Morning Briefing or P.docxericbrooks84875
 
From the perspective of the public safety field youre in, aspire to.docx
From the perspective of the public safety field youre in, aspire to.docxFrom the perspective of the public safety field youre in, aspire to.docx
From the perspective of the public safety field youre in, aspire to.docxericbrooks84875
 
From the following terms Orthodox Judaism, Hassidic Judaism.  Brief.docx
From the following terms Orthodox Judaism, Hassidic Judaism.  Brief.docxFrom the following terms Orthodox Judaism, Hassidic Judaism.  Brief.docx
From the following terms Orthodox Judaism, Hassidic Judaism.  Brief.docxericbrooks84875
 
From the end of Chapter 14, complete Discussion Question 3 What are.docx
From the end of Chapter 14, complete Discussion Question 3 What are.docxFrom the end of Chapter 14, complete Discussion Question 3 What are.docx
From the end of Chapter 14, complete Discussion Question 3 What are.docxericbrooks84875
 
From the e-Activity, take a position on this statement People that .docx
From the e-Activity, take a position on this statement People that .docxFrom the e-Activity, take a position on this statement People that .docx
From the e-Activity, take a position on this statement People that .docxericbrooks84875
 
From Chapter Seven How does horizontal growth differ from v.docx
From Chapter Seven How does horizontal growth differ from v.docxFrom Chapter Seven How does horizontal growth differ from v.docx
From Chapter Seven How does horizontal growth differ from v.docxericbrooks84875
 
From the e-Activity, determine the fundamental differences between t.docx
From the e-Activity, determine the fundamental differences between t.docxFrom the e-Activity, determine the fundamental differences between t.docx
From the e-Activity, determine the fundamental differences between t.docxericbrooks84875
 

More from ericbrooks84875 (20)

Fundamentals of Risk and InsuranceEmmEtt J. Vaughan • .docx
Fundamentals of Risk and InsuranceEmmEtt J. Vaughan   •   .docxFundamentals of Risk and InsuranceEmmEtt J. Vaughan   •   .docx
Fundamentals of Risk and InsuranceEmmEtt J. Vaughan • .docx
 
Fungi reproduce ___________________________ by fragmentation, buddin.docx
Fungi reproduce ___________________________ by fragmentation, buddin.docxFungi reproduce ___________________________ by fragmentation, buddin.docx
Fungi reproduce ___________________________ by fragmentation, buddin.docx
 
Full-Circle LearningMyLab™ Learning Full Circle for Mar.docx
Full-Circle LearningMyLab™ Learning Full Circle for Mar.docxFull-Circle LearningMyLab™ Learning Full Circle for Mar.docx
Full-Circle LearningMyLab™ Learning Full Circle for Mar.docx
 
Functional Behavior Assessment ExampleStudent NameInes SalazarD.docx
Functional Behavior Assessment ExampleStudent NameInes SalazarD.docxFunctional Behavior Assessment ExampleStudent NameInes SalazarD.docx
Functional Behavior Assessment ExampleStudent NameInes SalazarD.docx
 
Functional Requirements Document TemplateVersionDescription .docx
Functional Requirements Document TemplateVersionDescription .docxFunctional Requirements Document TemplateVersionDescription .docx
Functional Requirements Document TemplateVersionDescription .docx
 
Fully answer any ONE of the following essay questions1.  Is the.docx
Fully answer any ONE of the following essay questions1.  Is the.docxFully answer any ONE of the following essay questions1.  Is the.docx
Fully answer any ONE of the following essay questions1.  Is the.docx
 
Fully answer any ONE of the following essay questions1.  Is t.docx
Fully answer any ONE of the following essay questions1.  Is t.docxFully answer any ONE of the following essay questions1.  Is t.docx
Fully answer any ONE of the following essay questions1.  Is t.docx
 
From the weeks chapter reading, we learn from the authors that,.docx
From the weeks chapter reading, we learn from the authors that,.docxFrom the weeks chapter reading, we learn from the authors that,.docx
From the weeks chapter reading, we learn from the authors that,.docx
 
FTER watching the videos and reviewing the other materials in this.docx
FTER watching the videos and reviewing the other materials in this.docxFTER watching the videos and reviewing the other materials in this.docx
FTER watching the videos and reviewing the other materials in this.docx
 
fter completing the reading this week, we reflect on a few key conce.docx
fter completing the reading this week, we reflect on a few key conce.docxfter completing the reading this week, we reflect on a few key conce.docx
fter completing the reading this week, we reflect on a few key conce.docx
 
FS-3FORD MOTOR COMPANY AND SUBSIDIARIESCONSOLIDATED INCO.docx
FS-3FORD MOTOR COMPANY AND SUBSIDIARIESCONSOLIDATED INCO.docxFS-3FORD MOTOR COMPANY AND SUBSIDIARIESCONSOLIDATED INCO.docx
FS-3FORD MOTOR COMPANY AND SUBSIDIARIESCONSOLIDATED INCO.docx
 
Fromm’s concept of the syndrome of decay included three personality .docx
Fromm’s concept of the syndrome of decay included three personality .docxFromm’s concept of the syndrome of decay included three personality .docx
Fromm’s concept of the syndrome of decay included three personality .docx
 
From your readings in Chapter 4, choose one of the organizational sy.docx
From your readings in Chapter 4, choose one of the organizational sy.docxFrom your readings in Chapter 4, choose one of the organizational sy.docx
From your readings in Chapter 4, choose one of the organizational sy.docx
 
From your daily briefs, Kaiser Health News Morning Briefing or P.docx
From your daily briefs, Kaiser Health News Morning Briefing or P.docxFrom your daily briefs, Kaiser Health News Morning Briefing or P.docx
From your daily briefs, Kaiser Health News Morning Briefing or P.docx
 
From the perspective of the public safety field youre in, aspire to.docx
From the perspective of the public safety field youre in, aspire to.docxFrom the perspective of the public safety field youre in, aspire to.docx
From the perspective of the public safety field youre in, aspire to.docx
 
From the following terms Orthodox Judaism, Hassidic Judaism.  Brief.docx
From the following terms Orthodox Judaism, Hassidic Judaism.  Brief.docxFrom the following terms Orthodox Judaism, Hassidic Judaism.  Brief.docx
From the following terms Orthodox Judaism, Hassidic Judaism.  Brief.docx
 
From the end of Chapter 14, complete Discussion Question 3 What are.docx
From the end of Chapter 14, complete Discussion Question 3 What are.docxFrom the end of Chapter 14, complete Discussion Question 3 What are.docx
From the end of Chapter 14, complete Discussion Question 3 What are.docx
 
From the e-Activity, take a position on this statement People that .docx
From the e-Activity, take a position on this statement People that .docxFrom the e-Activity, take a position on this statement People that .docx
From the e-Activity, take a position on this statement People that .docx
 
From Chapter Seven How does horizontal growth differ from v.docx
From Chapter Seven How does horizontal growth differ from v.docxFrom Chapter Seven How does horizontal growth differ from v.docx
From Chapter Seven How does horizontal growth differ from v.docx
 
From the e-Activity, determine the fundamental differences between t.docx
From the e-Activity, determine the fundamental differences between t.docxFrom the e-Activity, determine the fundamental differences between t.docx
From the e-Activity, determine the fundamental differences between t.docx
 

Recently uploaded

internship ppt on smartinternz platform as salesforce developer
internship ppt on smartinternz platform as salesforce developerinternship ppt on smartinternz platform as salesforce developer
internship ppt on smartinternz platform as salesforce developerunnathinaik
 
Painted Grey Ware.pptx, PGW Culture of India
Painted Grey Ware.pptx, PGW Culture of IndiaPainted Grey Ware.pptx, PGW Culture of India
Painted Grey Ware.pptx, PGW Culture of IndiaVirag Sontakke
 
Framing an Appropriate Research Question 6b9b26d93da94caf993c038d9efcdedb.pdf
Framing an Appropriate Research Question 6b9b26d93da94caf993c038d9efcdedb.pdfFraming an Appropriate Research Question 6b9b26d93da94caf993c038d9efcdedb.pdf
Framing an Appropriate Research Question 6b9b26d93da94caf993c038d9efcdedb.pdfUjwalaBharambe
 
Capitol Tech U Doctoral Presentation - April 2024.pptx
Capitol Tech U Doctoral Presentation - April 2024.pptxCapitol Tech U Doctoral Presentation - April 2024.pptx
Capitol Tech U Doctoral Presentation - April 2024.pptxCapitolTechU
 
Proudly South Africa powerpoint Thorisha.pptx
Proudly South Africa powerpoint Thorisha.pptxProudly South Africa powerpoint Thorisha.pptx
Proudly South Africa powerpoint Thorisha.pptxthorishapillay1
 
Enzyme, Pharmaceutical Aids, Miscellaneous Last Part of Chapter no 5th.pdf
Enzyme, Pharmaceutical Aids, Miscellaneous Last Part of Chapter no 5th.pdfEnzyme, Pharmaceutical Aids, Miscellaneous Last Part of Chapter no 5th.pdf
Enzyme, Pharmaceutical Aids, Miscellaneous Last Part of Chapter no 5th.pdfSumit Tiwari
 
ECONOMIC CONTEXT - PAPER 1 Q3: NEWSPAPERS.pptx
ECONOMIC CONTEXT - PAPER 1 Q3: NEWSPAPERS.pptxECONOMIC CONTEXT - PAPER 1 Q3: NEWSPAPERS.pptx
ECONOMIC CONTEXT - PAPER 1 Q3: NEWSPAPERS.pptxiammrhaywood
 
Presiding Officer Training module 2024 lok sabha elections
Presiding Officer Training module 2024 lok sabha electionsPresiding Officer Training module 2024 lok sabha elections
Presiding Officer Training module 2024 lok sabha electionsanshu789521
 
Earth Day Presentation wow hello nice great
Earth Day Presentation wow hello nice greatEarth Day Presentation wow hello nice great
Earth Day Presentation wow hello nice greatYousafMalik24
 
Introduction to AI in Higher Education_draft.pptx
Introduction to AI in Higher Education_draft.pptxIntroduction to AI in Higher Education_draft.pptx
Introduction to AI in Higher Education_draft.pptxpboyjonauth
 
Final demo Grade 9 for demo Plan dessert.pptx
Final demo Grade 9 for demo Plan dessert.pptxFinal demo Grade 9 for demo Plan dessert.pptx
Final demo Grade 9 for demo Plan dessert.pptxAvyJaneVismanos
 
Incoming and Outgoing Shipments in 1 STEP Using Odoo 17
Incoming and Outgoing Shipments in 1 STEP Using Odoo 17Incoming and Outgoing Shipments in 1 STEP Using Odoo 17
Incoming and Outgoing Shipments in 1 STEP Using Odoo 17Celine George
 
Alper Gobel In Media Res Media Component
Alper Gobel In Media Res Media ComponentAlper Gobel In Media Res Media Component
Alper Gobel In Media Res Media ComponentInMediaRes1
 
POINT- BIOCHEMISTRY SEM 2 ENZYMES UNIT 5.pptx
POINT- BIOCHEMISTRY SEM 2 ENZYMES UNIT 5.pptxPOINT- BIOCHEMISTRY SEM 2 ENZYMES UNIT 5.pptx
POINT- BIOCHEMISTRY SEM 2 ENZYMES UNIT 5.pptxSayali Powar
 
“Oh GOSH! Reflecting on Hackteria's Collaborative Practices in a Global Do-It...
“Oh GOSH! Reflecting on Hackteria's Collaborative Practices in a Global Do-It...“Oh GOSH! Reflecting on Hackteria's Collaborative Practices in a Global Do-It...
“Oh GOSH! Reflecting on Hackteria's Collaborative Practices in a Global Do-It...Marc Dusseiller Dusjagr
 
Historical philosophical, theoretical, and legal foundations of special and i...
Historical philosophical, theoretical, and legal foundations of special and i...Historical philosophical, theoretical, and legal foundations of special and i...
Historical philosophical, theoretical, and legal foundations of special and i...jaredbarbolino94
 
call girls in Kamla Market (DELHI) 🔝 >༒9953330565🔝 genuine Escort Service 🔝✔️✔️
call girls in Kamla Market (DELHI) 🔝 >༒9953330565🔝 genuine Escort Service 🔝✔️✔️call girls in Kamla Market (DELHI) 🔝 >༒9953330565🔝 genuine Escort Service 🔝✔️✔️
call girls in Kamla Market (DELHI) 🔝 >༒9953330565🔝 genuine Escort Service 🔝✔️✔️9953056974 Low Rate Call Girls In Saket, Delhi NCR
 
Meghan Sutherland In Media Res Media Component
Meghan Sutherland In Media Res Media ComponentMeghan Sutherland In Media Res Media Component
Meghan Sutherland In Media Res Media ComponentInMediaRes1
 

Recently uploaded (20)

internship ppt on smartinternz platform as salesforce developer
internship ppt on smartinternz platform as salesforce developerinternship ppt on smartinternz platform as salesforce developer
internship ppt on smartinternz platform as salesforce developer
 
Painted Grey Ware.pptx, PGW Culture of India
Painted Grey Ware.pptx, PGW Culture of IndiaPainted Grey Ware.pptx, PGW Culture of India
Painted Grey Ware.pptx, PGW Culture of India
 
TataKelola dan KamSiber Kecerdasan Buatan v022.pdf
TataKelola dan KamSiber Kecerdasan Buatan v022.pdfTataKelola dan KamSiber Kecerdasan Buatan v022.pdf
TataKelola dan KamSiber Kecerdasan Buatan v022.pdf
 
Framing an Appropriate Research Question 6b9b26d93da94caf993c038d9efcdedb.pdf
Framing an Appropriate Research Question 6b9b26d93da94caf993c038d9efcdedb.pdfFraming an Appropriate Research Question 6b9b26d93da94caf993c038d9efcdedb.pdf
Framing an Appropriate Research Question 6b9b26d93da94caf993c038d9efcdedb.pdf
 
Capitol Tech U Doctoral Presentation - April 2024.pptx
Capitol Tech U Doctoral Presentation - April 2024.pptxCapitol Tech U Doctoral Presentation - April 2024.pptx
Capitol Tech U Doctoral Presentation - April 2024.pptx
 
Proudly South Africa powerpoint Thorisha.pptx
Proudly South Africa powerpoint Thorisha.pptxProudly South Africa powerpoint Thorisha.pptx
Proudly South Africa powerpoint Thorisha.pptx
 
Enzyme, Pharmaceutical Aids, Miscellaneous Last Part of Chapter no 5th.pdf
Enzyme, Pharmaceutical Aids, Miscellaneous Last Part of Chapter no 5th.pdfEnzyme, Pharmaceutical Aids, Miscellaneous Last Part of Chapter no 5th.pdf
Enzyme, Pharmaceutical Aids, Miscellaneous Last Part of Chapter no 5th.pdf
 
ECONOMIC CONTEXT - PAPER 1 Q3: NEWSPAPERS.pptx
ECONOMIC CONTEXT - PAPER 1 Q3: NEWSPAPERS.pptxECONOMIC CONTEXT - PAPER 1 Q3: NEWSPAPERS.pptx
ECONOMIC CONTEXT - PAPER 1 Q3: NEWSPAPERS.pptx
 
Presiding Officer Training module 2024 lok sabha elections
Presiding Officer Training module 2024 lok sabha electionsPresiding Officer Training module 2024 lok sabha elections
Presiding Officer Training module 2024 lok sabha elections
 
Earth Day Presentation wow hello nice great
Earth Day Presentation wow hello nice greatEarth Day Presentation wow hello nice great
Earth Day Presentation wow hello nice great
 
Introduction to AI in Higher Education_draft.pptx
Introduction to AI in Higher Education_draft.pptxIntroduction to AI in Higher Education_draft.pptx
Introduction to AI in Higher Education_draft.pptx
 
Final demo Grade 9 for demo Plan dessert.pptx
Final demo Grade 9 for demo Plan dessert.pptxFinal demo Grade 9 for demo Plan dessert.pptx
Final demo Grade 9 for demo Plan dessert.pptx
 
OS-operating systems- ch04 (Threads) ...
OS-operating systems- ch04 (Threads) ...OS-operating systems- ch04 (Threads) ...
OS-operating systems- ch04 (Threads) ...
 
Incoming and Outgoing Shipments in 1 STEP Using Odoo 17
Incoming and Outgoing Shipments in 1 STEP Using Odoo 17Incoming and Outgoing Shipments in 1 STEP Using Odoo 17
Incoming and Outgoing Shipments in 1 STEP Using Odoo 17
 
Alper Gobel In Media Res Media Component
Alper Gobel In Media Res Media ComponentAlper Gobel In Media Res Media Component
Alper Gobel In Media Res Media Component
 
POINT- BIOCHEMISTRY SEM 2 ENZYMES UNIT 5.pptx
POINT- BIOCHEMISTRY SEM 2 ENZYMES UNIT 5.pptxPOINT- BIOCHEMISTRY SEM 2 ENZYMES UNIT 5.pptx
POINT- BIOCHEMISTRY SEM 2 ENZYMES UNIT 5.pptx
 
“Oh GOSH! Reflecting on Hackteria's Collaborative Practices in a Global Do-It...
“Oh GOSH! Reflecting on Hackteria's Collaborative Practices in a Global Do-It...“Oh GOSH! Reflecting on Hackteria's Collaborative Practices in a Global Do-It...
“Oh GOSH! Reflecting on Hackteria's Collaborative Practices in a Global Do-It...
 
Historical philosophical, theoretical, and legal foundations of special and i...
Historical philosophical, theoretical, and legal foundations of special and i...Historical philosophical, theoretical, and legal foundations of special and i...
Historical philosophical, theoretical, and legal foundations of special and i...
 
call girls in Kamla Market (DELHI) 🔝 >༒9953330565🔝 genuine Escort Service 🔝✔️✔️
call girls in Kamla Market (DELHI) 🔝 >༒9953330565🔝 genuine Escort Service 🔝✔️✔️call girls in Kamla Market (DELHI) 🔝 >༒9953330565🔝 genuine Escort Service 🔝✔️✔️
call girls in Kamla Market (DELHI) 🔝 >༒9953330565🔝 genuine Escort Service 🔝✔️✔️
 
Meghan Sutherland In Media Res Media Component
Meghan Sutherland In Media Res Media ComponentMeghan Sutherland In Media Res Media Component
Meghan Sutherland In Media Res Media Component
 

www.pwc.comhrsA look at the key workforce trends from a.docx

  • 1. www.pwc.com/hrs A look at the key workforce trends from around the world using data from PwC’s Saratoga benchmarking database. Key trends in human capital 2012 A global perspective 2 Key trends in human capital 2012. A global perspective About PwC Saratoga PwC Saratoga is the recognised leader in the measurement and benchmarking of human capital in organisations, HR and finance function performance and transformation. Our specialists help clients to develop predictive analytics capability by identifying connections between HR, people, functional and organisational performance, using a range of quantitative and qualitative tools. This is supported by a global repository of metrics and qualitative best practice information from more than 2,400 organisations. 3Key trends in human capital 2012. A global perspective
  • 2. Introduction 4 Global trends in human capital 6 A multi-speed global economy 8 Productivity gaps widen 12 A rocky road for rookies 16 Survivors disengaged 20 HR rising to the analytics challenge 25 Priorities for business 32 In conclusion 34 Behind the numbers 36 Contacts 37 Related PwC publications 38 Contents 4 Key trends in human capital 2012. A global perspective Introduction Welcome to the latest in PwC’s detailed studies of Global Trends in Human Capital. In this fifth edition we look more closely at how organisations and the global
  • 3. workforce have been changed by the financial crisis and economic downturn. 5 Our 2010 Global Trends paper was written at a time of considerable upheaval, with many organisations cutting back sharply on costs and headcount as the recession took hold. Two years on, business leaders are more confident about the prospects for growth, in spite of continued economic turmoil. While competition is intense, many organisations are emerging leaner and more focused. The mantra is to maximise return on investment (ROI) in every area of the business, especially human capital. It’s all about talent management In this quest for growth, talent management remains a primary focus area for business leaders. According to our 15th Annual Global CEO Survey, 78% of CEOs plan to make changes to talent strategy in response to the global business environment. There is a clear need for professional skills and effective leadership to operate in challenging markets, while emerging markets require the talent to deliver continued growth. But only 30% of CEOs said they were confident that they would have the talent they needed to grow their organisation in the near future, and
  • 4. 31% said that talent constraints had already hampered innovation at their organisation. In such an environment, knowledge and insight – in the form of human capital data – is power. Human capital measurement and analytics has progressed far in recent years, evolving from the collection and redistribution of basic workforce data through HR systems to a more thoughtful and targeted approach that mirrors more general business data analytics. This means joining up data from sources within and outside HR, analysing trends and an increasing focus on predictive analytics. ‘Knowledge and insight – in the form of human capital data – is power.’ Talent strategy 78% 30% 31% 78% of CEOs plan to make changes to talent strategy in response to the global business environment 31% said that talent constraints had already hampered innovation at their organisation Only 30% of CEOs said they were confident that they would have the talent they needed
  • 5. to grow their organisation in the near future Key trends in human capital 2012. A global perspective 6 The global financial crisis has reinforced the contrast between economies and employment markets around the world. Western Europe – and, for the first time, parts of Central and Eastern Europe – have felt the impact of the global financial crisis and have seen revenue per employee fall. Asia, by contrast, has continued to grow. When existing demographic trends are added to the mix, it’s clear that multinational organisations are facing sharply contrasting human capital challenges from region to region. Four key trends have emerged: Global trends in human capital 7Key trends in human capital 2012. A global perspective 1. 2. 3. 4. Productivity gaps widen Productivity dropped sharply in developed economies in 2011, making the regional differences
  • 6. in productivity much more pronounced. Latin America and Asia-Pacific are now showing far higher levels of productivity than Europe, giving them a strong competitive edge. A rocky road for rookies One of the major consequences of the crisis is that organisations in the West have chosen experience over youth, cutting back on the recruitment of younger workers and banking on the experience of older workers to see them through. While this strategy has worked in the short term, it’s storing up talent chain supply problems for the future. Survivors disengaged The most significant – and worrying – legacy of the turmoil of the past few years has been the impact on employee engagement. Employees in the West who survived the cost-cutting cull have been left disillusioned and disengaged. The younger generation has been hit particularly hard as they see their opportunities dwindle and their career path blocked by older workers who can’t afford
  • 7. to retire. But poor employee engagement isn’t just a Western problem; it’s equally severe in Asia, in spite of the high levels of demand for younger talent, where job-hopping has become the norm. Best practice in human capital analytics has arrived The best organisations are leading the way in using analytics and the capabilities of the HR function to make sure that they get the most from the investment in their people. There’s been a huge investment in human capital analytics in recent years and it’s paying dividends for organisations that were ahead of the game. The advancements in data collection and analysis are an enormous opportunity for those who are prepared to take advantage of them. 8 A multi-speed global economy
  • 8. 9Key trends in human capital 2012. A global perspective It’s clear that the fallout from the global financial crisis has been far-reaching, both in terms of financial results and in the long- term impact on the way companies operate. There remains a clear divide between organisations in developed economies, which were inevitably hit hard during the crisis, and the fast-growing emerging economies, where talent supply remains a critical issue. The impact of the economic conditions is by no means limited to Western Europe and the US. There is evidence to suggest that the impact is now being felt within Central and Eastern Europe, with GDP per capita growth for some economies in Eastern Europe, such as the Czech Republic, falling to levels similar to the UK and US. Combined with rising wage costs in recent years, parts of the CEE region are moving beyond the period of demonstrably higher human capital ROI to levels resembling other European nations. The major economies in Asia, by contrast, have shown year-on-year increases in economic output during the crisis, driven by rapid industrialisation and an expanding workforce in the manufacturing and service industries. With low wage costs and/or continuing growth in most parts of Asia, many nations demonstrate far higher
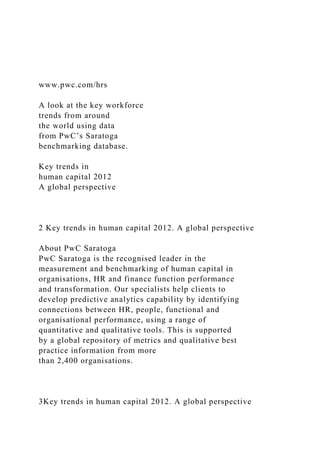
  • 9. human capital ROI than the West. 15% 10% 5% 0 -5% -10% $184,674 $180,733 $230,499 $228,472 $267,186 $344,432 $415,668 2006 2007 2008 2009 2010 2011 Source: World Bank GDP per capita growth China
  • 10. Brazil Japan US Czech R. UK India CEE UK Western Europe LATAM Asia Pacific US $180,733 $184,674 $230,499 $267,186 $282,781 $338,773 $0k $350k
  • 11. Annual growth in GDP per capita Revenue per FTE by region Revenue per FTE ($) 10 Key trends in human capital 2012. A global perspective Adapt and survive We’ve seen significant changes to employment markets in the West in the wake of the financial crisis, as countries adapt in order to maintain growth by investing in the better-performing sectors. In the US, the professional services sector has seen an increase in revenue per full-time employee (FTE) of 21.5%, as businesses look for expert help in managing the difficult economic conditions. In other industries though, employees are seeing fewer opportunities – the US technology sector saw a 28.3% reduction in revenue per FTE as organisations looked to reduce back-office expenditure. This is echoed in Western Europe, which also saw a fall in revenue generated in the technology sector. Engineering and manufacturing, and the chemicals industry have also suffered. The pharmaceuticals sector, though, has enjoyed a small increase in revenue in Europe, along with the insurance industry and retail and leisure sector, and should see continued investment and innovation generating job
  • 12. growth for Western economies. Revenue per FTE In the US, the professional services sector has seen an increase in revenue per full-time employee (FTE) of 21.5%, as businesses look for expert help in managing the difficult economic conditions Banking: Time for change? The banking sector in Europe has faced well-publicised problems in recent years, with profit levels suffering as a result. Five years ago, the sector was the most successful in Europe in terms of the level of shareholder return. But not any more. Revenue per FTE has fallen sharply. Pay remains high despite recent bonus pool reductions and banks continue to pay a higher average remuneration than any other sector. The result is a dramatic reduction in the value added by employees; Human Capital ROI (HC ROI) has fallen by 20% over the past five years. Performance-related pay in the sector currently stands at similar levels to 2006/07, when banks were reporting far higher levels of profit – showing that compensation reductions potentially still
  • 13. have some way to go. The next few years will be critical to the banking sector and success will depend to a large extent on the effectiveness of the pay reforms that are underway. There are many challenges ahead. Banking 2006/07 2007/08 2008/09 2009/10 2010/11 Human capital ROI 2.00 2.06 2.05 1.69 1.62 Average remuneration ($) 79,362 76,944 92,391 92,671 87,673 Performance-related pay (%) 8.7 17.1 16.5 15.8 14.4 21.5% 11Key trends in human capital 2012. A global perspective “ Recognising that the world is somewhat split down the middle between slow growth and rapid growth, you’d better be able to operate in both at the same time. You have to manage that difficult slow growth and then completely switch gears and go to high growth. You have to find ways of moving your resources – and for us it’s talent – from where it’s not being utilised to where it can be utilised.” Brian Duperreault, President and Chief Executive Officer of Marsh & McLennan Companies Inc. Taken from the PwC 15th Annual CEO Survey
  • 14. 12 Productivity gaps widen 13Key trends in human capital 2012. A global perspective LATAM CEE AsiaPac Western Europe UK US 10% 14% 15% 24% 26% 30% 0% 30%
  • 15. Remuneration/revenue by region Remuneration/revenue (%) The West can’t compete on productivity While developing economies are not immune to the downturn, they have managed to retain strong productivity levels, particularly when compared against Western Europe and the US. Productivity levels in Western Europe had remained relatively stable as organisations cut back on employee numbers during the downturn, but in 2011, productivity dropped sharply. This places regions such as Asia, Latin America and CEE in a continued position of strength in terms of competitiveness. Employee costs rise, for less return Further analysis shows that the fall in productivity in Europe is driven by an increase in average employee costs per head. This is largely because organisations have cut back on their recruitment of new, raw talent and so have lower numbers of younger and lower grade employees, which has in turn increased average remuneration levels. At the same time revenue has fallen, meaning that organisations are seeing a lower return on their remuneration investment. Lower return on remuneration investment
  • 16. Organisations have cut back on their recruitment of new, raw talent. This has increased average remuneration levels. At the same time revenue has fallen Static $55,000 $52,500 $50,000 $47,500 $45,000 $42,500 $40,000 24% 23.5% 23% 22.5% 22% 21.5% 21%
  • 17. 2007 2008 2009 2010 2011 Average remuneration ($) Remuneration/revenue (%) Average remuneration rises in Europe Average remuneration ($) Revenue/remuneration (%) 14 Key trends in human capital 2012. A global perspective Saratoga data shows that average remuneration has once again increased in Europe to $54,942 (an increase of over 15%). The level of average remuneration in the US continues to be significantly higher than in Europe, a consequence of the greater GDP per capita generated. A higher level of benefits in the US, which have continued to increase due to healthcare-related costs, and the longer number of hours that US employees work, also contribute to the higher average remuneration. We track the return that organisations are getting for their investment in their people through Human Capital Return on Investment (HC ROI), which is at its lowest level in recent years in Western Europe and the US, while in CEE the HC ROI fell significantly after a period of year-on- year increases. HC ROI is particularly competitive in
  • 18. the emerging markets of Asia-Pacific, in some cases almost twice the level seen in Western economies. But in the more developed economies in Asia-Pacific, HC ROI is only slightly higher than in Western Europe and the US – the result of higher employee costs. It will be difficult for many countries to sustain competitive HC ROI levels if salaries continue to rise at their current rate. US Western Europe CEE UK 0% 100% 18.2 15.1 3.4 19.7 5.9 7.1 12.5 8.51
  • 19. 75.8 77.7 84.1 71.8 Remuneration in Europe and the US Human Capital ROI Benefits PRP Other compensation UK Western Europe US CEE AsiaPac LATAM 1.1 1.11 1.34 1.57 1.70
  • 20. 3.40 0 3.5 ROI 15 Measuring workforce return on investment While it is dangerous to focus on one measure to demonstrate workforce ROI, our HC ROI metric combines in a single number the major components of P&L performance with the size and cost of the workforce. It captures the interplay between revenue generation, cost control and human capital management policy, something that revenue per employee and profit per employee can’t do. In fact, it’s possible for an organisation to report increases in revenue and profit per employee, but falling HC ROI, if these gains are being made with more expensive people. HC ROI only grows if profits increase in combination with a managed investment in people; in other words, the concept of ‘doing more with the same’ or ‘doing the same
  • 21. with less’. While fundamentally a formula combining profit with workforce costs, HC ROI is most usefully expressed as: Revenue - non-people costs FTEs x average remuneration This format provides insight to the varying influence of the key variables, and opportunities for change. Used as a modelling tool in this way, HC ROI can help show the impact of HR programmes, from reward strategy and performance orientation, to organisation design, workforce planning, resourcing strategy and employee engagement. High HC ROI Low HC Return on Investment High HighLow Low Rate of economic/profit growth Cost of workforce
  • 22. Developing (eg BRICs) Maturing (eg CEE) Undeveloped economies Post-industrial (e.g. Western Europe, North America) Economic maturity impacts HC ROI 16 A rocky road for rookies 17Key trends in human capital 2012. A global perspective Younger workers suffer in the West Younger workers have been the biggest casualty of the cutbacks and there has been a noticeable trend for organisations in Western Europe and the US to reduce the number of middle and lower grade employees. European metrics show that the number of executives with more than three
  • 23. years in the role has increased to 72.6%, while the number of employees with less than two years’ service (known as the Rookie Ratio) has fallen sharply to 21.9%. Overall, this represents a shift towards a higher proportion of senior employees; the organisational pyramid is becoming narrower at the bottom and wider at the top. The crisis has clearly limited the opportunities for younger employees in Western economies. There appears to be a strong demand for experienced employees to guide organisations out of economic difficulty, and investment in early talent has suffered as a result. In PwC’s 15th Global CEO survey,1 55% of business leaders within Western economies rate the recruitment and retention of ‘high-potential middle management’ as a key challenge, as opposed to just 32% for ‘young workers’. While cutting back on the recruitment of young talent may save on bottom-line costs in the short term, it will inevitably affect the availability of talent to fill key positions over time. Organisations need to be cautious during this period of careful cost management that they aren’t cutting off the talent pipeline at its source. 1 PwC 15th Annual Global CEO survey of over 1,200 business leaders – 2012 Recruitment and retention a key challenge
  • 24. 55% of business leaders within Western economies rate the recruitment and retention of ‘high-potential middle management’ as a key challenge 55% “ But what is interesting and what is changing is that among Western companies, the ability to hire, develop and retain talent in the developing economies has become a major point of competitive differentiation.” Marijn Dekkers, Chairman, Bayer AG Taken from the PwC 15th Annual CEO Survey 18 Older workers dig in A lack of new job opportunities for younger workers is slowing the rate of generational change in the workforce in some regions. In the US for instance, the expected growth in numbers of Generation Y employees hasn’t occurred, with the workforce representation of Generation X surpassing the 50% mark in 2008, and increasing to 53% in 2010. As more Baby Boomers retire, Generation X has now become the largest workforce presence. Evidence of a high proportion of Generation X employees can be seen in the average
  • 25. tenure findings in the US, which have gradually increased in recent years. There’s an expectation that average length of tenure will be driven down by new Generation Y employees, who want and expect a varied career and who aren’t particularly loyal to their employers; PwC’s Millennials survey2 showed that only one in five young employees expect to stay with their current employer in the long term. However, the analysis shows that Generation Y does not yet represent a great enough proportion of employees in the US to impact overall workforce trends. Asia-Pacific CEE LATAM Western Europe US 47 51 70 112 113
  • 26. 0 months 120 months Average tenure (months) 2 PwC ‘Millennials at work: Reshaping the workplace’ – December 2011 19 The hiring race continues in Asia The continuing talent supply problems in Asia, coupled with aggressive growth strategies and high levels of employee churn have resulted in recruitment rates that are approximately twice as high as in Europe and the US (at 22%). The average tenure for employees in Asian organisations is just under four years. Despite the prevailing economic uncertainty, we expect hiring demand will continue to rise in Asia. Even as labour costs rise in some fast-growing economies, business leaders have set out ambitious plans to expand workforces: 55% of Asia-Pacific CEOs expect to increase their company’s headcount over the next 12 months. As a result of this rapid growth, acquiring talent in the external market is becoming more challenging and expensive; 43% of CEOs tell us that it has become more difficult to hire talent in their industry. The problem is particularly acute in China and
  • 27. Hong Kong, and South-East Asia where the proportion rises to nearly 60%. This suggests that there is an urgent need to strengthen recruitment and workforce planning processes. “ As emerging markets accelerate – or maybe the rest of the world decelerates – there is a significant sense of urgency. There is the sense that it may already be too late to place your bets. A second factor to consider is that it is much more difficult to get into those markets because of their attitude change. They feel that post- 2008 they have less to learn from the West.” Lázaro Campos CEO, SWIFT, Belgium Taken from the PwC 15th Annual CEO Survey Source: PwC Saratoga analysis Asia-Pacific (overall) Asia-Pacific (advanced) Asia-Pacific (emerging) United States Western Europe 22% 21% 24% 10%
  • 28. 11% 0% 25% External recruitment rate 20 Survivors disengaged 21Key trends in human capital 2012. A global perspective Engagement is a problem Employee engagement is the mantra for HR, as it is critical to performance. Low levels of employee engagement tend to result in a higher turnover of employees, less discretionary effort and lower productivity. The data highlights the employee retention issues that are endemic in Asia. The median resignation rate for Asia is 15.2%, approximately twice as high as in Europe and the US. This is symptomatic of a job market where frequent changes of role are the norm for many employees; a recent survey of 2,200 managers in China showed that two-thirds had received a competing job offer in the previous 18 months.3 The turnover for new hires is even greater, with 19.2% resigning in the first year of
  • 29. service.4 The evidence suggests that this trend is likely to continue and is becoming an established element of employee culture in Asia. In contrast to Asia, the data from CEE shows a sharp reduction in resignation rates. At first glance this appears to be a positive indicator; however, local PwC experience suggests that resignation rates have fallen simply because employees are finding it more difficult to find a new job. This has already been seen in Latin America, where high unemployment rates and competition for jobs have driven down resignations to just 6.3%. LATAM Western Europe US UK CEE Asia-Pacific 6% 7% 8% 9%
  • 30. 10% 15% 0% 20% Asia-Pacific (overall) Asia-Pacific (advanced) Asia-Pacific (emerging) United States Western Europe 19% 20% 18% 14% 13% 0% 20% Resignation rate by region Resignation rate <1 year (%) First-year resignations 19.2%
  • 31. 19.2% of new hires in China resign in the first year of service 3 MRI China Group Talent Environment Index, 2010 4 ‘Breaking out of the talent spiral: Key human capital trends in Asia-Pacific’, PwC 2012 22 Key trends in human capital 2012. A global perspective The engagement problem in Western Europe is equally pressing. Unemployment is high and as a result many employees are choosing to stay in their current role for the sake of security. While this means that retention in the short term is good, the danger is that the continuing lack of job opportunities has limited the long-term career choices for employees – and there is evidence of employee unrest as a result. Getting reward right Employee and executive reward continue to be high on the agenda. Recent years have seen an increased focus on remuneration governance, with pressure from stakeholders to ensure reward policies are wholly aligned with achieving business objectives. Analytics have a critical role to play here in ensuring that organisations are paying employees at the right level through a reward structure that drives sustainable performance.
  • 32. In Asia, many organisations are feeling the dual impact of strong competition for talent, but a low level of engagement among employees. Variable pay features heavily in Asia, accounting for almost a fifth of total compensation, compared with 13% in the US and 11% in Western Europe, driven by higher financial returns. A primary focus of an organisation’s pay strategy should be to incentivise employees to deliver sustainable performance. The well-publicised failure of the executive pay model in the West to deliver this outcome has resulted in increasing pressure for reform from stakeholders. Research into incentives by PwC5 has shown that a total shareholder return approach to reward produces arbitrary outcomes, while studies into human reaction to risk suggest that modern long-term incentives (LTIs) are not having the desired impact on executive performance, and so are designed to fail. HR should closely analyse the LTIs that are so often used today to ensure they really do add value. Pay models need to be relevant to the business outcome, with ambiguity in pay structure one of the key causes of misalignment. Organisations that take an innovative approach are achieving the best outcomes here, and are able to strengthen their pay models through links between pay and sustainable long-term performance. 5 ‘ Making executive pay work: The psychology of incentives’
  • 33. PwC UK, 2012 “ Performance-related pay has now become ubiquitous and forms a major part of the pay package for companies globally. However, we have found that companies are struggling to align rewards with corporate strategy and individual performance management, and so frequently do not get the results they desire from their incentives spend.” Tom Gosling, partner and head of reward consulting, PwC UK 23 “ The demographic changes that we see occurring in many of the regions where we operate – shrinking populations, an ageing workforce and diversifying demographics – compounds the challenges we face and intensifies the war for talent.” Dr Rüdiger Grube Chairman and CEO, Deutsche Bahn AG, Germany. Taken from the PwC 15th Annual CEO Survey 25Key trends in human capital 2012. A global perspective HR rising to the analytics challenge
  • 34. Human capital is a vital asset for organisations worldwide. Business leaders are looking for growth and human capital makes this possible, but is too often treated as purely an operational cost rather than an investment. While there is no doubt that the economic environment in countries worst affected by the crisis calls for prudence, it is also important that organisations adopt a mindset focused on driving value from their workforce, not just reducing its cost. HR has a vital role to play in this. 26 Key trends in human capital 2012. A global perspective HR transformed In response to this increasing demand for strategic workforce management, there have been extensive changes to the way HR is delivered in many organisations. These include a rapid development in the skills and capability of HR professionals, improvements in HR technology, and a move towards centralised HR delivery models that are structured by specialism. In the best organisations, the result has been an innovative change in the way HR services are delivered – so much so, that we’ve seen a rapid improvement in best practice in many areas, including strategic
  • 35. reward modelling, talent management and workforce planning. The bar has also been raised in terms of best practice HR measurement and analytics. Improvements in capability and technology have allowed the best organisations to advance measurement practices. Many effective HR management information methods are available and this is a great opportunity for HR functions to show that they can add real value. A minority of CEOs get comprehensive reports on their workforce Q: When making decisions, how important is it to have information on each of the following talent- related areas? For those areas that are important to you, how adequate is the information you currently receive? Percentage of CEOs who believe the relevant information is important or very important Do not receive information Adequate but would like it now Not
  • 36. adequate Information received is comprehensive HR Transformation: Key Changes to the HR function and management information 1st Generation 2nd Generation HR function • Review HR delivery model • Development of Centres of Excellence • Re-engineering HR processes to improve effectiveness • Focused HR strategy execution • Global standards for HR delivery • Continued HR process excellence • Senior executive sponsors for HR interventions HR management information • Implement workforce measures/ balanced scorecards • Use benchmarks to track HR effectiveness
  • 37. • ROI analysis of HR function activities • Workforce analytics and forecasting • Strategic workforce planning • Alignment of HRMI across process areas Percentage of CEOs Information Gap: CEOs believe information is important but don’t receive comprehensive reports Source: PwC’s 15th Annual Global CEO survey, 2012 Staff productivity Employees views and needs Labour costsAssessments of internal advancement Return on investment on human
  • 38. capital Costs of employee turnover 100% 80% 60% 40% 20% 0 27Key trends in human capital 2012. A global perspective 20%: Ad hoc/�no formal approach 75%: established measurement programme <5%: full workforce analytics capability A minority of CEOs get comprehensive reports on their workforce The current state of human capital analyticsUnfulfilled potential
  • 39. In a recent client poll we found that around 75% of organisations have an established approach to people measurement incorporating mainstream techniques such as KPIs, dashboards and benchmarking. However, no more than 5% of organisations have, or are developing, a full analytics capability. This comes at a time when talent issues are back at the top of CEO agendas and they are seeking more insight and impact from HR on workforce analysis. 20% 75% 5% 28 Key trends in human capital 2012. A global perspective Predictive analysis HR is increasingly turning to analytics as a key tool to provide evidence and insight to support decision-making, but even so, still lags behind the use of analytics in other business disciplines such as sales and marketing. If HR is to prove its worth as a strategic function, it needs to go one step further and explore patterns and correlations in the data, to provide the evidence and analysis business leaders need to improve people performance. Although predictive analytics in HR is still in its infancy, an increasing number of multinationals, particularly in the financial services, professional services and technology sectors are beginning to
  • 40. build predictive solutions. Organisations that are focused on talent to drive growth are especially keen on developing solutions that predict employee exit risks, or new hire quality. The ultimate aim should be to introduce predictive analysis that drives workforce planning and produces results that are genuinely helpful. Predictive solutions in workforce management Hiring Turnover Performance Engagement Workforce planning Predict new hire quality Predict success of hiring source Predict flight risks Predict retirement Predict performance Predict absenteeism Predict impact of engagement
  • 41. drivers Predict impact on business performance Predict employee demand Predict supply by role Driving employee engagement is often a key focus of HR strategy. Ultimately, overall productivity levels and financial results can be used as indicators of past engagement levels. However, there is more strategic value in using human capital analytics such as absence and recruitment rates, grievances, resignation rates and productivity indicators to provide insight into the impact of current engagement on future business results. An increasing number are, however, reflecting the need for analytical skills in their hiring decisions for the HR function. 29 Human capital reporting in the spotlight
  • 42. While financial information will always be at the heart of an organisation’s reporting, stakeholders now expect information to cover more intangible aspects such as the risks and opportunities that could influence future prospects. Human capital – often the most valuable intangible asset in an organisation as well as the largest controllable cost – is a key piece of this jigsaw. Human capital disclosures in corporate reports have improved steadily over the past decade, prompted by the greatly increased scrutiny on organisations from shareholders, regulators, governments and other external stakeholders. It’s become more common for organisations to provide human capital measures within their main annual report, often supported by strategic analysis of the organisation’s workforce management. This trend is reflected globally, as corporate reporting initiatives such as the EC-sponsored project Valuing Non-Financial Performance6 and the International Integrated Reporting framework being developed by the International Integrated Reporting Committee7 (IIRC), recognise the need for better alignment of human capital and broader business reporting. Despite the improvements in human
  • 43. capital reporting, it’s clear that there is still a lot to be done. PwC’s annual award for ‘people reporting’ in the UK’s largest companies,8 for instance, showed that only 33% of companies set out a clear link between their people strategy and business strategy, and only 4% referred to the ROI delivered by their workforce. While organisations are better at describing what human capital is, they still struggle to provide disclosures describing why it’s essential to achieving business priorities. A detailed description of the actual value of human capital within an organisation is very rare. “ Human capital is central to the corporate reporting model set out within the IIRC’s recently released proposals for an International Integrated Reporting Framework. The discussion paper, ‘Towards Integrated Reporting: Communicating Value in the 21st Century’, recognises that the drivers of corporate performance have changed and that, for many companies, the frequently cited mantra ‘people are the key to our success’ needs to be better reflected within company disclosure. We are seeing a rapid evolution in corporate reporting in response.” Jessica Fries, Integrated Reporting, PwC UK and IIRC Board Director 6 www.investorvalue.org 7 www.theiirc.org 8 Building Public Trust Awards UK
  • 44. 30 Key trends in human capital 2012. A global perspective Addressing talent supply Four out of five companies surveyed in PwC’s Asia-Pacific study do not have dedicated HR resources responsible for talent management strategy The ongoing talent supply problems faced by organisations in Asia have inevitably occupied a significant amount of HR’s time, often at the expense of longer term workforce planning and talent management. Strong growth and rapidly changing economies have meant that workforce strategies in the region tend to be reactive to changes in overall business strategy, rather than proactively driving business outcomes, and HR functions are invariably operational and non-strategic. The need to effectively plan and implement changes in workforce structure is a key challenge for many organisations as they seek to take advantage of growing Asian markets. For many, this will mean radically reinventing their approach to talent, and a targeted investment in strategic HR processes. Addressing talent supply Four out of five companies surveyed in
  • 45. PwC’s Asia-Pacific study do not have dedicated HR resources responsible for talent management strategy 80% 31 “ Short-term foresight and slow reaction to people issues are barriers to driving financial performance in the growing Asian markets. We’ve seen a tendency for organisations to use a traditional approach to workforce planning when a more strategic approach is required. This entails annual forecasts of supply and demand; however in this very dynamic region, we need much better transparency and control on a monthly basis.” Adam Salzer, Director in Consulting, PwC Hong Kong 32 Key trends in human capital 2012. A global perspective Priorities for business 33Key trends in human capital 2012. A global perspective Businesses remain ambitious despite the economic environment and CEOs continue to plan for growth. Intelligent workforce planning will be a vital element
  • 46. of any strategy and the organisations that stand out against the competition will be those that are able to harness the newly developed potential of human capital analytics. There are important messages to remember: Learn from the best. The talent supply chain should be managed with the same rigour as every other vital resource. The development of predictive analysis in human capital measurement is a strong opportunity for organisations at a time when everyone is working to coax the most out of their people. Best practice is already emerging, and there’s much to learn from those that are ahead of the curve. Focus on productivity. Make sure all your talent management interventions have the right impact on productivity and contribute to creating value. Keep a close eye on the key measures and how your peers are performing. CEOs need help and HR needs to take a lead. Concentrate on engagement. Employee engagement is clearly a problem, both for the West where low levels of engagement are the legacy of the financial crisis, and in Asia, where job-hopping has become standard practice. Engaged employees are productive employees.
  • 47. Think carefully about reward. Too many organisations are placing emphasis over performance-based and variable pay, when the evidence is mounting that incentives don’t necessarily work. Different sections of the workforce are motivated by different things and non-financial rewards are increasingly valued by employees. Look out for rookies. The Millennial generation has been hardest hit by the downturn, but time will make them the dominant force in future workforces. Organisations in Asia are already struggling with their propensity to switch jobs frequently – finding ways to persuade young people to stay should be a priority. Invest in analytics. Organisations have been late to recognise the value of good quality HR management information affecting their ability to be a strategic contributor. HR strategy should reflect a commitment to acquiring the systems and skills to build credible analytics capabilities. But select your metrics wisely. Technological advances and the growing interest in human capital analytics means that the volume of information has increased exponentially, but not always to great effect. The key to success is intelligent and targeted use of the data available.
  • 48. 34 Key trends in human capital 2012. A global perspective In conclusion Organisations cannot realise their growth potential without the people to make it happen. Businesses that develop a well-informed and proactive approach to strategic workforce planning have an opportunity to gain a crucial competitive edge. Getting talent management right means you can worry less about your talent problems and more about your business opportunities. Whatever the size or shape of your business, we believe there are four fundamentals to talent management: 35Key trends in human capital 2012. A global perspective 1. 2. 3. 4. Align your business plan and talent strategy – make sure every aspect of your talent strategy directly contributes to your overall business plan and to creating value. Change anything that doesn’t. Face the future – look at where your business is heading, not just where you’ve been. Keep questioning whether your talent management pipeline
  • 49. will give you what you need when you need it. Pay attention to pivotal roles – get the right talent into the roles that have a disproportionate ability to create (or destroy) business value. Focus on the financials – make measurement, benchmarking and predictive analytics part of your plan. Look to your people ROI. 36 Key trends in human capital 2012. A global perspective Behind the numbers PwC Saratoga has developed and applied meaningful metrics to help organisations to maximise their ROI for over 30 years. Today, we integrate employee attitudinal research and metrics to drive execution action and support clients who are looking to develop and deploy dashboards, employee surveys, predictive solutions, conduct workforce planning initiatives and benchmark the workforce and HR function. For this study, we integrated findings from our Saratoga teams in the US, Western
  • 50. Europe, AsiaPac, LATAM and CEE, in order to look closely at comparisons between key workforce effectiveness measures, drawing on our global database of over 2,400 organisations. As part of our approach, we analyse data submitted by client organisations for over 60 metrics. The following selected metrics have been used within this report. Metrics formulae Human capital impact Human capital return on investment (HC ROI) X : 1 (Profit before tax + Compensation + Benefits) ÷ (Compensation + Benefits) Revenue per FTE $ Revenue ÷ Total FTEs Remuneration/Revenue % (Compensation + Benefits) ÷ Revenue Compensation and benefits Variable pay % (Performance related pay + Attendance- related pay) ÷ Compensation Performance-related pay % Performance-related pay ÷ Compensation Average remuneration $ (Compensation + Benefits ) ÷ Total FTEs Human capital engagement Resignation rate % Resignations ÷ Headcount Resignation rate < 1 year % Resignations less than 1 year ÷ Headcount
  • 51. less than 1 year High performer turnover rate % High performer turnover ÷ High performer headcount External recruitment rate % External recruits ÷ Headcount Organisation and workforce structure Rookie ratio % Headcount less than 2 years of service ÷ Headcount Executive stability ratio % Executive Directors less than 3 years service ÷ Executive directors FTEs per HR Department FTE X : 1 FTEs ÷ HR Department FTEs 37Key trends in human capital 2012. A global perspective Contacts To discuss the issues highlighted in this report, please contact your local PwC contact, or one of the following: Key contacts Richard Phelps Global Leader Human Resource Management Consulting +44 20 7804 7044 [email protected] Justine Brown Marketing Human Resource Services +44 113 289 4423 [email protected]
  • 52. North America Scott Olsen +1 646 471 0651 [email protected] Nik Shah [email protected] +1 703 918 1208 Western Europe Peter De Bley +32 2 710 43 21 [email protected] Jon Andrews +44 20 7804 9000 [email protected] Central and Eastern Europe Zsolt Szelecki +3614619733 [email protected] Middle East Christopher Box +974 4419 2852 [email protected] Africa Gerald Seegers +27 (11) 797 4560 [email protected] China /Hong Kong Mandy Kwok +852 2289 3900 [email protected] Adam Salzer +852 2289 5033 [email protected] Singapore Thorsen Barth
  • 53. +65 6236 4382 [email protected] India Sankar Ramamurthy +91 (124) 4620560 [email protected] Australia Victoria Keesing +61 (2) 8266 0035 [email protected] Brazil Joao Lins +55 11 3674 3941 [email protected] Acknowledgements Our thanks go to the contributors from our Saratoga teams across the world, who contributed to writing this report. Particular thanks go to Jonathan Moses (UK), Michael Wood (Australia), Jon Burton (US), Abu Amin (Singapore), Parul Dattani (Research) and Seema Shah (Research). 38 Key trends in human capital 2012. A global perspective Related PwC publications Are you engaging the right employees for the right reasons? www.pwc.com/hrs
  • 54. Engaging your pivotal talent December 2011 www.pwc.com Managing tomorrow’s people Millennials at work www.pwc.com/talentmanagement 15th Annual Global CEO Survey. Delivering results through talent The HR challenge in a volatile world www.pwc.com/hrs A global study into the impact of pay and incentives on senior executives. Making executive pay work The psychology of incentives PwC Saratoga Asia-Pacific www.pwc.com/saratoga Breaking out of the talent spiral Key human capital trends in Asia-Pacific
  • 55. Millennials at work: Reshaping the workplace, 2011 This report looks into the mind of new graduates from all over the world, who are entering the workforce for the first time, and how their attitude and expectations have shifted in response to the economic downturn in many parts of the world. It also looks at the strategies employers could consider to continue attracting and retaining these key talents. Engaging your pivotal talent, 2011 Companies often focus on retaining star performers or leadership talent, overlooking pivotal roles – jobs that have an outsized ability to create (or destroy) the value customers expect. In this report we explore how organisations are identifying and engaging their pivotal people and make some suggestions to help proactive organisations stay ahead.
  • 56. US Human Capital Effectiveness Report, 2012 As the US economy slowly recovers, key challenges are emerging for HR. Hiring is trending upward, but productivity is declining. The employment uptick has brought higher voluntary turnover rates, but not for new hires. Organisations that understand and adapt to this seemingly contradictory environment will gain the most from their investment in the workforce. This report looks at data from more than 300 US organisations and offers observations to help business leaders understand the dynamics of the US labour market today. Delivering results through talent: The HR challenge in a volatile world, 2012 PwC’s 15th Annual Global CEO Survey found that issues around talent are once again top of mind. CEOs are recognising that their current strategies for managing talent no longer fit – 78% of CEOs say they will make a change.
  • 57. This report takes a closer look at business leaders’ talent problems – and at the actions leading businesses are taking. Making executive pay work: The psychology of incentives, 2012 The debate about executive pay has mostly focused on whether shareholders are getting what they want and if current levels of executive pay are acceptable. If pay were genuinely motivating executives towards higher performance, there would surely be less controversy about the subject. But is it? Our study in conjunction with the London School of Economics and Political Science, reveals a number of common behavioural traits, which show clearly that executives aren’t necessarily motivated the way many employers assume. Breaking out of the talent spiral 2012 As the Asia-Pacific talent market continues to evolve, companies face challenges in terms of attracting talent,
  • 58. retaining and rewarding employees. These challenges have resulted in many organisations being trapped in a talent spiral of ever- increasing cost, which ultimately impacts bottom lines and shareholder value. In this report our Asia-Pacific Saratoga team report on key trends in human capital across the region. 39Key trends in human capital 2012. A global perspective PwC firms help organisations and individuals create the value they’re looking for. We’re a network of firms in 158 countries with close to 169,000 people who are committed to delivering quality in assurance, tax and advisory services. Tell us what matters to you and find out more by visiting us at www.pwc.com. This publication has been prepared for general guidance on matters of interest only, and does not constitute professional advice. You should not act upon the information contained in this publication without obtaining specific professional advice. No representation or warranty (express or implied) is given as to the accuracy or completeness of the information contained in this publication, and, to the extent permitted by law, PwC does do not accept or assume any liability, responsibility or duty of care for any consequences of you or
  • 59. anyone else acting, or refraining to act, in reliance on the information contained in this publication or for any decision based on it. © 2012 PwC. All rights reserved. PwC refers to the PwC network and/or one or more of its member firms, each of which is a separate legal entity. Please see www.pwc.com/structure for further details. Design Services 27600 (07/12). www.pwc.com/hrs