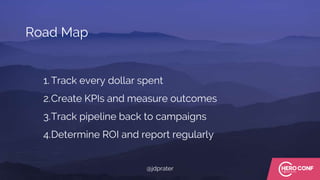
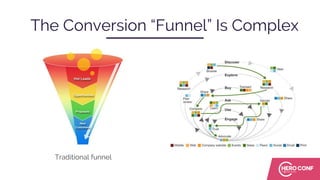
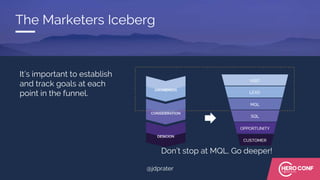
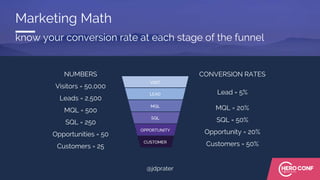
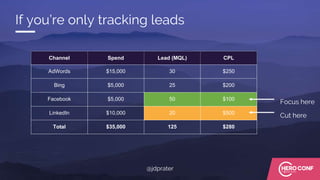
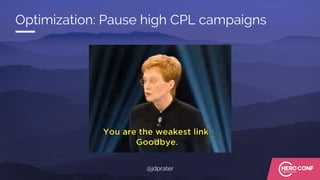
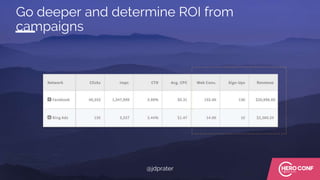
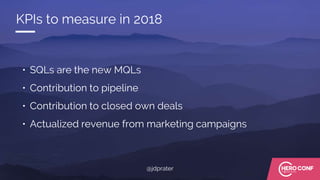
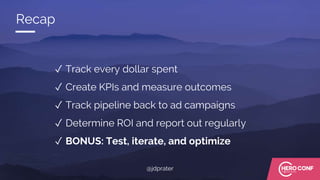
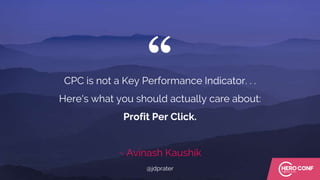
Improving PPC Campaign
Effectiveness through
Pipeline Measurement
JD Prater
Director of Growth Marketing
@jdprater
How many times
have you heard this?
@jdprater
How many times
have you heard this?
Clients:
We need to drive more leads.
@jdprater
How many times
have you heard this?
Sales:
These leads low quality.
I need better quality leads!
@jdprater
How many times
have you heard this?
CMO:
How many leads turned into customers
(revenue)?
@jdprater
How many times
have you heard this?
CEO:
Where should we double down on budget to
drive more revenue?
@jdprater
1. Track every dollar spent
2.Create KPIs and measure outcomes
3.Track pipeline back to campaigns
4.Determine ROI and report regularly
Road Map
@jdprater
1. Track every dollar spent
CMOs Want to
Accelerate
Revenue Growth
— CMO Council & SAP
— Accenture, C-level disruptive growth
Guess who is
most likely to
shoulder the
blame if growth
targets aren’t
met?
● Monitoring budgets & KPIs
● Visualize metrics quickly
● Project goals
Invest in an automated
tracking system
2. Create KPIs and measure outcomes
“
— Forrester Research
Less than 1% of leads will ever become
customers
@jdprater
@jdprater
The Conversion “Funnel” Is Complex
Traditional funnel
The Iceberg Principle
It’s important to establish
and track goals at each
point in the funnel.
The Marketers Iceberg
@jdprater
Don’t stop at MQL. Go deeper!
Goal = Engage / Nurture
● Newsletter Sign Ups
● Calls
● Downloads
● Demos
● Trialers
● Salesforce Opportunities
● Customers
Track all possible
conversion
touchpoints to
understand how
users engage with
your brand
throughout their
lifetime.
Which conversion online conversion
goals to track?
ALL of them!
Marketing Math
know your conversion rate at each stage of the funnel
CONVERSION RATES
Lead = 5%
MQL = 20%
SQL = 50%
Opportunity = 20%
Customers = 50%
NUMBERS
Visitors = 50,000
Leads = 2,500
MQL = 500
SQL = 250
Opportunities = 50
Customers = 25
@jdprater
Marketing Math
know your conversion rate at each stage of the funnel
CONVERSION RATES
Lead = 5%
MQL = 20%
SQL = 50%
Opportunity = 20%
Customers = 50%
NUMBERS
Visitors = 50,000
Leads = 2,500
MQL = 500
SQL = 250
Opportunities = 50
Customers = 25
Takeaway
The less companies know about their KPIs,
the less likely they are to meet their
revenue goals.
@jdprater
3. Track pipeline back to campaigns
@jdprater
“
~ Peter Drucker
If you can't measure it, you can't improve it
@jdprater
Channel Spend Lead (MQL) CPL
AdWords $15,000 30 $250
Bing $5,000 25 $200
Facebook $5,000 50 $100
LinkedIn $10,000 20 $500
Total $35,000 125 $280
Focus here
Cut here
If you’re only tracking leads
@jdprater
Optimization: Pause high CPL campaigns
@jdprater
Your optimizations may cost you revenue
Channel Spend Lead
(MQL)
CPL Customers Revenue ROAS ACV
AdWords $15,000 30 $250 4 $32,000 213% $8,000
Bing $5,000 25 $200 3 $15,000 300% $5,000
Facebook $5,000 50 $100 1 $4,000 120% $4,000
LinkedIn $10,000 20 $500 4 $32,000 320% $8,000
Total $35,000 125 $280 12 $83,000 243% $6,917
@jdprater
Better Optimization: Increase LinkedIn spend!
@jdprater
Your optimizations may cost you revenue
Channel Spend Lead
(MQL)
CPL Customers Revenue ROAS ARPU
AdWords $15,000 30 $250 4 $32,000 213% $8,000
Bing $5,000 25 $200 3 $15,000 300% $5,000
Facebook $5,000 50 $100 1 $6,000 120% $6,000
LinkedIn $10,000 20 $500 4 $32,000 320% $8,000
Total $35,000 125 $280 12 $85,000 243% $7,083
Takeaway
Not all leads and networks
are created equal
@jdprater
Bonus! You now have the data to ask for more budget
Channel Spend Lead
(MQL)
CPL Customers Revenue
LinkedIn $15,000 30 $500 6 $48,000
Channel Spend Lead
(MQL)
CPL Customers Revenue
LinkedIn $10,000 20 $500 4 $32,000
Projection: $5,000 more ad spend will net another $16,000 in revenue
@jdprater
Show me your ways!
@jdprater
Modern Marketer
@jdprater
Online Tracking
Visitors to Leads
Offline Tracking
Leads to Customers
We have a tracking dilemma
@jdprater
Use hidden fields to pass more data into CRM
@jdprater
Campaign
information
passed into CRM
Salesforce fields
Create marketing
SQL lead source
dashboards to
align with sales
Salesforce dashboard by source
Marketing
dashboards
Salesforce fields
Takeaway
Marketers need to get comfortable
navigating CRMs
@jdprater
Connecting CRM data back to ad performance
Online Tracking
Visitors to Leads
Offline Tracking
Leads to Customers
@jdprater
We like G-Connector for Salesforce to pull reports into Google Sheets or export into Excel
*you’ll need a Salesforce login to complete set-up
Pulling CRM Reports
@jdprater
Import conversions back into AdStage
@jdprater
Offline conversions mapped to online
campaigns
Show the value of your ad campaigns in the context
of business goals
@jdprater
4. Determine ROI and report regularly
“
—Hubspot
Marketers that calculate ROI are 1.6X more
likely to receive higher budgets.
@jdprater
What happens when you report on clicks to the
CMO?
@jdprater
What happens when you report on revenue?
@jdprater
Contribution to
Pipeline
@jdprater
Go deeper and determine ROI from
campaigns
@jdprater
• SQLs are the new MQLs
• Contribution to pipeline
• Contribution to closed own deals
• Actualized revenue from marketing campaigns
KPIs to measure in 2018
@jdprater
Walk out of that meeting like a boss
@jdprater
Recap
✓ Track every dollar spent
✓ Create KPIs and measure outcomes
✓ Track pipeline back to ad campaigns
✓ Determine ROI and report out regularly
✓ BONUS: Test, iterate, and optimize
@jdprater
“CPC is not a Key Performance Indicator. . .
Here's what you should actually care about:
Profit Per Click.
~ Avinash Kaushik
@jdprater
#SMX #22c @jdprater
JD Prater
JD is the Director of Growth Marketing
at AdStage.
Host of the PPC Show podcast. Let me
know if you’re interested in being a
guest!
@jdprater

Improving PPC Campaign Effectiveness Through Pipeline Measurement

  • 1.
    Improving PPC Campaign Effectivenessthrough Pipeline Measurement JD Prater Director of Growth Marketing @jdprater
  • 2.
    How many times haveyou heard this? @jdprater
  • 3.
    How many times haveyou heard this? Clients: We need to drive more leads. @jdprater
  • 4.
    How many times haveyou heard this? Sales: These leads low quality. I need better quality leads! @jdprater
  • 5.
    How many times haveyou heard this? CMO: How many leads turned into customers (revenue)? @jdprater
  • 6.
    How many times haveyou heard this? CEO: Where should we double down on budget to drive more revenue? @jdprater
  • 7.
    1. Track everydollar spent 2.Create KPIs and measure outcomes 3.Track pipeline back to campaigns 4.Determine ROI and report regularly Road Map @jdprater
  • 8.
    1. Track everydollar spent
  • 9.
    CMOs Want to Accelerate RevenueGrowth — CMO Council & SAP
  • 10.
    — Accenture, C-leveldisruptive growth Guess who is most likely to shoulder the blame if growth targets aren’t met?
  • 11.
    ● Monitoring budgets& KPIs ● Visualize metrics quickly ● Project goals Invest in an automated tracking system
  • 12.
    2. Create KPIsand measure outcomes
  • 13.
    “ — Forrester Research Lessthan 1% of leads will ever become customers @jdprater
  • 14.
  • 15.
    The Conversion “Funnel”Is Complex Traditional funnel
  • 16.
  • 17.
    It’s important toestablish and track goals at each point in the funnel. The Marketers Iceberg @jdprater Don’t stop at MQL. Go deeper!
  • 18.
    Goal = Engage/ Nurture ● Newsletter Sign Ups ● Calls ● Downloads ● Demos ● Trialers ● Salesforce Opportunities ● Customers Track all possible conversion touchpoints to understand how users engage with your brand throughout their lifetime. Which conversion online conversion goals to track? ALL of them!
  • 19.
    Marketing Math know yourconversion rate at each stage of the funnel CONVERSION RATES Lead = 5% MQL = 20% SQL = 50% Opportunity = 20% Customers = 50% NUMBERS Visitors = 50,000 Leads = 2,500 MQL = 500 SQL = 250 Opportunities = 50 Customers = 25 @jdprater
  • 20.
    Marketing Math know yourconversion rate at each stage of the funnel CONVERSION RATES Lead = 5% MQL = 20% SQL = 50% Opportunity = 20% Customers = 50% NUMBERS Visitors = 50,000 Leads = 2,500 MQL = 500 SQL = 250 Opportunities = 50 Customers = 25 Takeaway The less companies know about their KPIs, the less likely they are to meet their revenue goals. @jdprater
  • 21.
    3. Track pipelineback to campaigns @jdprater
  • 22.
    “ ~ Peter Drucker Ifyou can't measure it, you can't improve it @jdprater
  • 23.
    Channel Spend Lead(MQL) CPL AdWords $15,000 30 $250 Bing $5,000 25 $200 Facebook $5,000 50 $100 LinkedIn $10,000 20 $500 Total $35,000 125 $280 Focus here Cut here If you’re only tracking leads @jdprater
  • 24.
    Optimization: Pause highCPL campaigns @jdprater
  • 25.
    Your optimizations maycost you revenue Channel Spend Lead (MQL) CPL Customers Revenue ROAS ACV AdWords $15,000 30 $250 4 $32,000 213% $8,000 Bing $5,000 25 $200 3 $15,000 300% $5,000 Facebook $5,000 50 $100 1 $4,000 120% $4,000 LinkedIn $10,000 20 $500 4 $32,000 320% $8,000 Total $35,000 125 $280 12 $83,000 243% $6,917 @jdprater
  • 26.
    Better Optimization: IncreaseLinkedIn spend! @jdprater
  • 27.
    Your optimizations maycost you revenue Channel Spend Lead (MQL) CPL Customers Revenue ROAS ARPU AdWords $15,000 30 $250 4 $32,000 213% $8,000 Bing $5,000 25 $200 3 $15,000 300% $5,000 Facebook $5,000 50 $100 1 $6,000 120% $6,000 LinkedIn $10,000 20 $500 4 $32,000 320% $8,000 Total $35,000 125 $280 12 $85,000 243% $7,083 Takeaway Not all leads and networks are created equal @jdprater
  • 28.
    Bonus! You nowhave the data to ask for more budget Channel Spend Lead (MQL) CPL Customers Revenue LinkedIn $15,000 30 $500 6 $48,000 Channel Spend Lead (MQL) CPL Customers Revenue LinkedIn $10,000 20 $500 4 $32,000 Projection: $5,000 more ad spend will net another $16,000 in revenue @jdprater
  • 29.
    Show me yourways! @jdprater
  • 30.
  • 31.
    Online Tracking Visitors toLeads Offline Tracking Leads to Customers We have a tracking dilemma @jdprater
  • 32.
    Use hidden fieldsto pass more data into CRM @jdprater
  • 33.
  • 34.
    Create marketing SQL leadsource dashboards to align with sales Salesforce dashboard by source
  • 35.
    Marketing dashboards Salesforce fields Takeaway Marketers needto get comfortable navigating CRMs @jdprater
  • 36.
    Connecting CRM databack to ad performance Online Tracking Visitors to Leads Offline Tracking Leads to Customers @jdprater
  • 37.
    We like G-Connectorfor Salesforce to pull reports into Google Sheets or export into Excel *you’ll need a Salesforce login to complete set-up Pulling CRM Reports @jdprater
  • 38.
    Import conversions backinto AdStage @jdprater
  • 39.
    Offline conversions mappedto online campaigns Show the value of your ad campaigns in the context of business goals @jdprater
  • 40.
    4. Determine ROIand report regularly
  • 41.
    “ —Hubspot Marketers that calculateROI are 1.6X more likely to receive higher budgets. @jdprater
  • 42.
    What happens whenyou report on clicks to the CMO? @jdprater
  • 43.
    What happens whenyou report on revenue? @jdprater
  • 44.
  • 45.
    Go deeper anddetermine ROI from campaigns @jdprater
  • 46.
    • SQLs arethe new MQLs • Contribution to pipeline • Contribution to closed own deals • Actualized revenue from marketing campaigns KPIs to measure in 2018 @jdprater
  • 47.
    Walk out ofthat meeting like a boss @jdprater
  • 48.
    Recap ✓ Track everydollar spent ✓ Create KPIs and measure outcomes ✓ Track pipeline back to ad campaigns ✓ Determine ROI and report out regularly ✓ BONUS: Test, iterate, and optimize @jdprater
  • 49.
    “CPC is nota Key Performance Indicator. . . Here's what you should actually care about: Profit Per Click. ~ Avinash Kaushik @jdprater
  • 50.
    #SMX #22c @jdprater JDPrater JD is the Director of Growth Marketing at AdStage. Host of the PPC Show podcast. Let me know if you’re interested in being a guest! @jdprater