
Download to read offline
![BOHR International Journal of Operations Management Research and Practices
2022, Vol. 1, No. 1, pp. 87–96
https://doi.org/10.54646/bijomrp.011
www.bohrpub.com
Improving 3D Printing Laboratory Operations: A Case Study of
Lean Six Sigma Implementation
Octavio Zavala Castro1 and Hung-da Wan1,2,∗
1Department of Mechanical Engineering, The University of Texas at San Antonio, San Antonio, United States
2Center for Advanced Manufacturing and Lean Systems, The University of Texas at San Antonio,
San Antonio, United States
∗Corresponding author: hungda.wan@utsa.edu
Abstract. Managing a three-dimensional (3D) printing facility was found to be more challenging than using the
technology. Our research laboratory provides 3D printing services to students and faculty who need the technology
to fulfill their education or research objectives. Students enrolled in Senior Design classes, in particular, rely on
the availability of services to support their capstone projects. While demand increases, the laboratory becomes
less efficient and sometimes chaotic. To improve the operations, Lean Six Sigma methods were applied to enhance
effectiveness and efficiency. Through a DMAIC project, we enhanced the availability of resources for requestors and
prevented delay or accumulation of work. The new operating procedures enabled the laboratory to provide quicker
services with fewer mistakes. This case study demonstrates that Lean Six Sigma is not only useful in manufacturing
but also in research and educational settings.
Keywords: Lean Six Sigma, DMAIC project, 5S, visual control, standardized work.
INTRODUCTION
In recent years, the use of three-dimensional (3D) printing
technology has been booming in many areas. Fields like
manufacturing, medicine, and especially education have
incorporated it with great success [5]. The popularity of
using 3D printing in engineering education comes from
the simplicity of its operation, compared to traditional
machining processes, and the spontaneous delivery of
results, which has a significant impact on the learning
experience [16].
This advantage is particularly reflected in the capstone
projects, for which the engineering students develop and
present their own designs in the final year of the engineer-
ing curriculum [18]. With originality and innovation, the
students create various designs to be prototyped to prove
the concepts. Oftentimes, the engineering students choose
to prototype their computer-based design models through
3D printing. As a result, a well-managed 3D printing
laboratory is important for engineering education.
Within our academic department, a research laboratory
was in charge of managing department-owned 3D printers
in order to provide 3D printing services to students and
faculty who were in need of the technology to fulfill their
education or research objectives. This laboratory manages
multiple 3D printers, including Dimension SST 1200es and
Mojo, with similar design frameworks [2].
The 3D printing technology used by all the printers is the
fused deposition method [8]. Consequently, the printing
materials being managed by the laboratory staff are mainly
ABS and the soluble support material. As a well-known
problem, the soluble support material deteriorates rapidly
over time when exposed to the air. Therefore, material
handling usually requires extra time and management
efforts [18].
Initially, the operations of the laboratory were manage-
able when the number of requests for the 3D printing
service was not too high. However, over the past decade,
mechanical engineering has become one of the most pop-
ular college majors in the United States. According to the
87](https://image.slidesharecdn.com/bijomrp20221111-230121113014-83587aae/75/Improving-3D-Printing-Laboratory-Operations-A-Case-Study-of-Lean-Six-Sigma-Implementation-1-2048.jpg)
![88 Octavio Zavala Castro and Hung-da Wan
American Society of Engineering Education, enrollment of
mechanical engineering students increased from 91,856 in
2009 to 135,672 in 2018, with a 47.7% growth [14].
A similar trend was experienced in our academic depart-
ment, and due to the increased demand for 3D printing
services, deficiencies and even chaos were observed in
the laboratory’s operations. With an urgency to improve
the operations of the laboratory for higher efficiency and
effectiveness, we initiated an improvement project that
incorporates Lean Six Sigma methods to reduce non-value-
add activities, streamline the process flow, and create a
better work environment.
Originating in the manufacturing sector, Lean Six Sigma
methods have been proven effective in various settings,
including education [12]. With the use of Lean Six Sigma
tools, we expected to enhance the availability of resources
for students and faculty and also prevent the accumulation
of work or delays.
After carefully studying the operations and observing
the observed issues, new guidelines and operating proce-
dures were developed to improve efficiency and effective-
ness. Under the new procedures, the laboratory is able to
provide quicker services with fewer mistakes.
This case study demonstrates that Lean Six Sigma is
not only a useful methodology in manufacturing settings
but is also useful in research and educational settings.
The goal of this paper is to provide documentation of our
practical experience with Lean Six Sigma applied in an
educational setting and to help readers in similar situations
gain insights into what actions are available and viable.
The following sections illustrate the methods used in this
study as well as the results.
METHODOLOGY FOR PROCESS
IMPROVEMENT
Lean Six Sigma has shown great impact on the operations
of various systems and is definitely effective in higher
education [17]. One of the most popular problem-solving
methodologies in Lean Six Sigma is the DMAIC method-
ology, which is an acronym for a five-phase procedure
explained below [13]:
• D: Define the goals of the improvement activity.
• M: Measure the existing system.
• A: Analyze the system to identify ways to eliminate
the gap between the current performance of the sys-
tem or process and the desired goal.
• I: Improve the system.
• C: Control the new system.
DMAIC is a data-driven quality strategy used to
improve processes. It is an integral part of a Six Sigma
initiative, but in general, it can be implemented as a stan-
dalone quality improvement procedure or as part of other
process improvement initiatives [3]. We can use DMAIC to
follow well-defined steps to make operations more effec-
tive and efficient.
However, DMAIC only defines the overall procedure
for problem solving. For specific problems, we need other
Lean Six Sigma tools to identify improvement opportuni-
ties and potential solutions. Based on the types of issues
observed earlier in the laboratory, the following methods
have been selected by the project team for improving the
operations of this research laboratory:
• SIPOC diagram
• Why-Why diagram
• 5S Method from Toyota Production System
• Standardized work
• Total productive maintenance (TPM)
More information about the selected tools will be
explained in the following sections.
DMAIC—DEFINE PHASE
Project Definition
The first phase of DMAIC is to define the problem,
the objectives, and the scope of the project. This project
emerged because there is an urgent need to make the 3D
printing process in the laboratory more efficient by avoid-
ing mistakes and delays. The laboratory primarily focuses
on helping undergraduate students who are enrolled in the
senior design classes, as well as researchers and teachers.
By printing their designs, students and researchers can
conduct tests on the prototypes.
With this project, we are looking to reduce the time of
the process, maximize the use of resources provided by the
faculty, as well as prevent the accumulation of work. The
following areas of improvement have been identified as the
scope of the project:
• General arrangement and organization of the facility
• Material management
• File management
• Machine maintenance
• Standard procedure for future operators
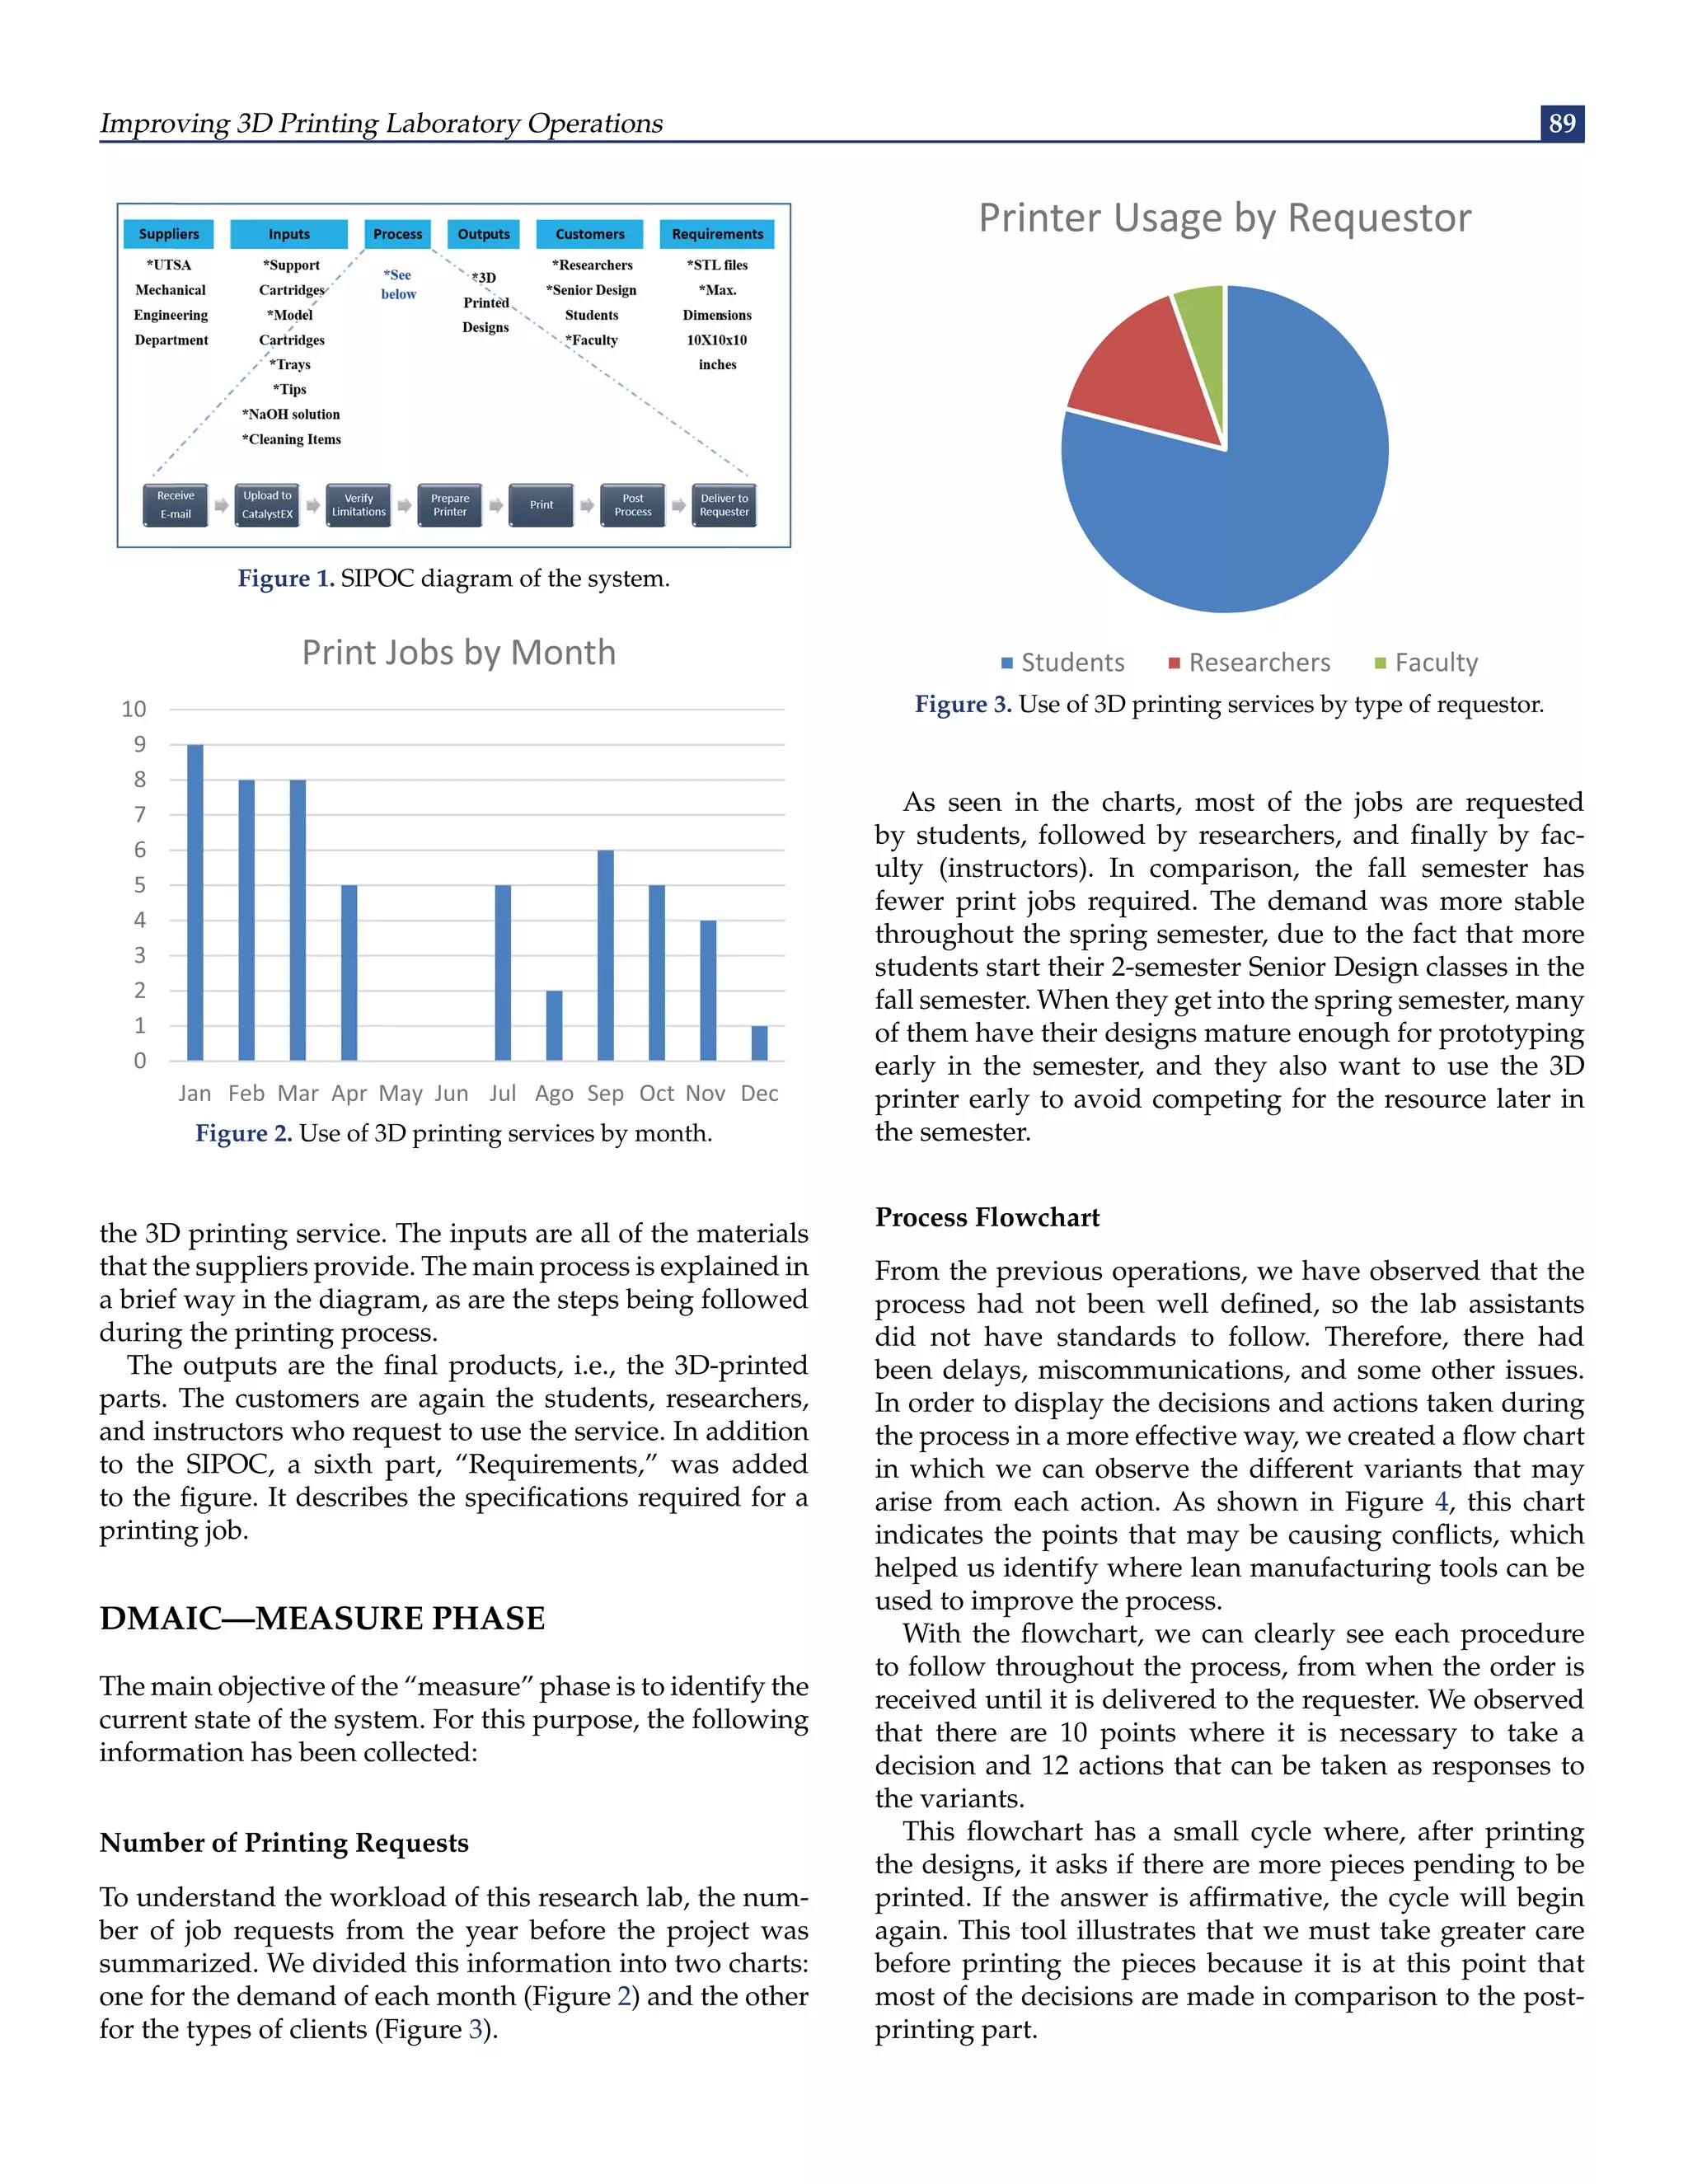
SIPOC Diagram
SIPOC is an acronym for Supply-Process-Input-Output-
Customer, which uses lists and flowcharts to visually
define a system [3]. To understand the scope and general
operations, the SIPOC diagram was used in this study
to identify all relevant elements involved in the process.
The diagram explains, in a simple and visual manner,
the participation of all parties as well as the steps of the
process, and it has been a preferred tool in the define phase
of many Lean Six Sigma projects [4].
As shown in Figure 1, the supplier of this system refers to
all students and faculty of the department who need to use](https://image.slidesharecdn.com/bijomrp20221111-230121113014-83587aae/75/Improving-3D-Printing-Laboratory-Operations-A-Case-Study-of-Lean-Six-Sigma-Implementation-2-2048.jpg)
![90 Octavio Zavala Castro and Hung-da Wan
Figure 4. Detailed process flowchart to show all decision points.
DMAIC—ANALYZE PHASE
The spirit of the “Analyze” phase in Six Sigma is to identify
the root causes of the problems. Therefore, in this phase,
we utilized the Why-Why diagram [3] to identify the
potential causes of different operational areas in order to
develop countermeasures in the next phase. As shown in
Refs. [6] and [10], the why-why analysis can be performed
in a variety of formats, including the 5-why method, a
fishbone diagram, or in tabular form. Here, we used the
tree-diagram format to identify the multiple root causes for
each issue.
Material Handling
First, the handling of printer cartridges (raw materials) had
been a serious issue in the operations. Material handling
was one of the objectives outlined in the project charter
because we have observed a repetitive problem with the
accumulation of partially used cartridges.
Using the Why-Why diagram, as shown in Figure 5, we
found a few different causes that resulted in the accumula-
tion of cartridges. Later in this paper, the countermeasures
to prevent the accumulation will be developed.
As shown in the diagram, the first cause is the defec-
tive material. Exposure to moisture caused the cartridges
of support material to harden. Because of the material’s
hardening, bubbles were created during the printing pro-
cess. These bubbles in the soluble support material create
instability at the moment of printing the designs.
They may also cause problems with the nozzle head of
the printer. The nozzle head is the part responsible for
heating the material, and due to these bubbles, it can get
stuck at the moment that the machine tries to extrude it.
Another cause of the accumulation of the partially used
cartridges, as shown in the Why-Why diagram, was the
schedule of the operators. The average time for the printer
to complete a job is 20 hours. Sometimes, it is difficult
to follow the correct procedures to wrap up the process
immediately after the printing is completed, because this
may happen very late, very early, or during the weekend.
The last cause that may be creating the accumulation of
the cartridges is the operator’s ignorance of the percentage
of leftover contents in the cartridges. For the operator, it
is easier to open a new cartridge instead of looking for
partially used cartridges that can complete the job without
a changeover. These causes have been captured in Figure 5.
Machine Maintenance
Another improvement area identified for this project
is machine maintenance. In the previous semesters, we](https://image.slidesharecdn.com/bijomrp20221111-230121113014-83587aae/75/Improving-3D-Printing-Laboratory-Operations-A-Case-Study-of-Lean-Six-Sigma-Implementation-4-2048.jpg)
![Improving 3D Printing Laboratory Operations 91
Figure 5. Why-Why diagram for causes of cartridge accumulation.
Figure 6. Why-Why diagram for causes of machine malfunction.
encountered a serious mechanical problem with the printer
where the toggle bar was stuck. As shown in Figure 6, a
Why-Why diagram was used to determine the causes of
this problem.
Based on the diagram, we found two root causes that
may have created the mechanical problem. The first is that
the operator ignores the procedure and does not know that
the support material can be heated and melt even when the
machine is not printing. The second cause for this problem
is that there is no preventive maintenance program, and
thus the liquefier tip has not been changed in a very long
time.
File Management
For this project, another area for improvement has been
identified as the file management. This is because there
was no control over the files loaded onto the computer
managing the 3D printers. While it is true that all the files
can be retrieved by searching the archived emails, which
is how we receive the orders, it is also true that during the
communication between the requester and the lab staff, the
STL files for printing can be confused, ignored, or lost.
When an order was received during the current process,
the STL files were downloaded from the email and then
copied to the computer in the printer desk or onto a flash
drive. However, there is a lack of control over the files
received. If the files sent cannot be printed at once, some
files are left pending, and because of the lack of control, a
second operator needs to download the files again, creating
a rework.
Since the causes of the file management issues were
more straightforward, the project team did not develop
a Why-Why diagram for them but recorded the potential
causes directly. Following the identification of potential
root causes of various issues, the next Six Sigma step is to
improve the operations by developing countermeasures.
DMAIC–IMPROVE PHASE
After the root causes of the issues were identified in differ-
ent areas, the project team decided to address these causes
by implementing lean tools, including 5S, standardized
work, and total productive maintenance (TPM) [1]. The
results of the implementation have been summarized as
follows:
5S Implementation
In the analysis phase, we found the causes that are gen-
erating the accumulation of cartridges, but we needed to
find a way to control the problem that already existed. We](https://image.slidesharecdn.com/bijomrp20221111-230121113014-83587aae/75/Improving-3D-Printing-Laboratory-Operations-A-Case-Study-of-Lean-Six-Sigma-Implementation-5-2048.jpg)
![92 Octavio Zavala Castro and Hung-da Wan
Figure 7. 5S implementation in computer area.
decided to apply the Toyota Production System’s 5S tool in
the laboratory, which is expected to help reduce waste and
control materials in a systematic way [9].
The 5S is a methodology to help develop a quality
work environment, both physically and mentally, through
five actions: sort, set in order, shine, standardize, and
sustain [1]. The 5S philosophy applies in any work area
and has been an important method to develop a visual
workplace [7].
In the laboratory, we have three spaces designated to
the 3D printing process: the computer desk, the post-
processing tank, and the cabinet where the materials and
tools used in the printer are kept. 5S was implemented
in these areas with very satisfactory results. Below, these
results will be explained in detail, showing the progress of
each area.
The computer desk area is next to the printer and is
where the computer is located. The CAD designs are sent
to the printers from this computer. This desktop is divided
into four sections, and in three of them, cartridges are
stored at different levels of content. The following issues
were identified, as shown in Figure 7(a):
1. Unnecessary items: Empty boxes in the top shelf
2. Accumulation of material: Empty, half, and full car-
tridges were mixed in the same area
3. Unsafe location of computer: The computer was
located on the edge, next to the post-processing tank,
exposed to splashing
After implementing 5S, the locations of different items
are defined and standardized with labels to ensure all
operators know where to keep the materials. Figure 7(b)
illustrates the results after 5S with the following improve-
ments:
1. Support material was cataloged from lower to higher
level of contents.
2. Model material was cataloged from lower to higher
level of contents.
3. New cartridges and trays were located in an accessi-
ble location.
4. Current cartridges were kept next to the printer.
5. The computer was relocated away from the edge near
the tank.
5S was also implemented in the cabinet area. In this area,
we stored all of the materials and new cartridges. 5S helps
to maintain order and control of the items. As shown in
Figure 8, all shelves are now clearly labeled to standardize
the locations of supplies, tools, and accessories.
Next, 5S was also implemented in the post-process tank
area. The post-processing tank is the last step in the 3D
printing process, where the support material is dissolved.
Implementing 5S makes the area cleaner with standardized
locations for tools and supplies. It significantly reduces the
time it takes the operator to locate the required items.
Finally, 5S was also implemented on file management in
the printer computer, which stores all the print job requests](https://image.slidesharecdn.com/bijomrp20221111-230121113014-83587aae/75/Improving-3D-Printing-Laboratory-Operations-A-Case-Study-of-Lean-Six-Sigma-Implementation-6-2048.jpg)
![Improving 3D Printing Laboratory Operations 93
Figure 8. 5S implementation in cabinet area.
and associated STL files. The major change was to separate
the STL files from other files, and then we created folders
that specified the time in which they were printed.
When the operators receive an order, they will now
follow a new procedure to rename the STL files and save
them to the specified folder. With the 5S implementation, it
would be easier to keep track of the job requests and locate
the files.
Standardized Work
As emphasized in the verb “standardized work,” the heart
of this method is an active process for the organization and
specification of uniform work steps to be performed [1].
The best practices to develop a standardized work pro-
cedure are to use visual aids [11]. As identified in the
Why-Why diagram, the operator often did not know the
procedure clearly.
Therefore, the project team designed a checklist with all
of the steps of the process. This checklist is an effort at
standardizing the work so that we can ensure the opera-
tors know the right procedure at any time. As shown in
Figure 9, this list was divided into six stages, and a color
was assigned to each of them to make it easier to read and
understand.
Another action taken in order to solve one of the root
causes of the problem of the material sticking, based on the
Why-Why diagram, was the use of a new sealed box. The
partially used cartridges used to be stored in sealed bags
to prevent moisture; however, these bags were sometimes
not completely closed, and they tended to tear after use. By
substituting the bag for a sealed box as a new standard, it
is possible to store more cartridges at the same time, and
they will be more durable.
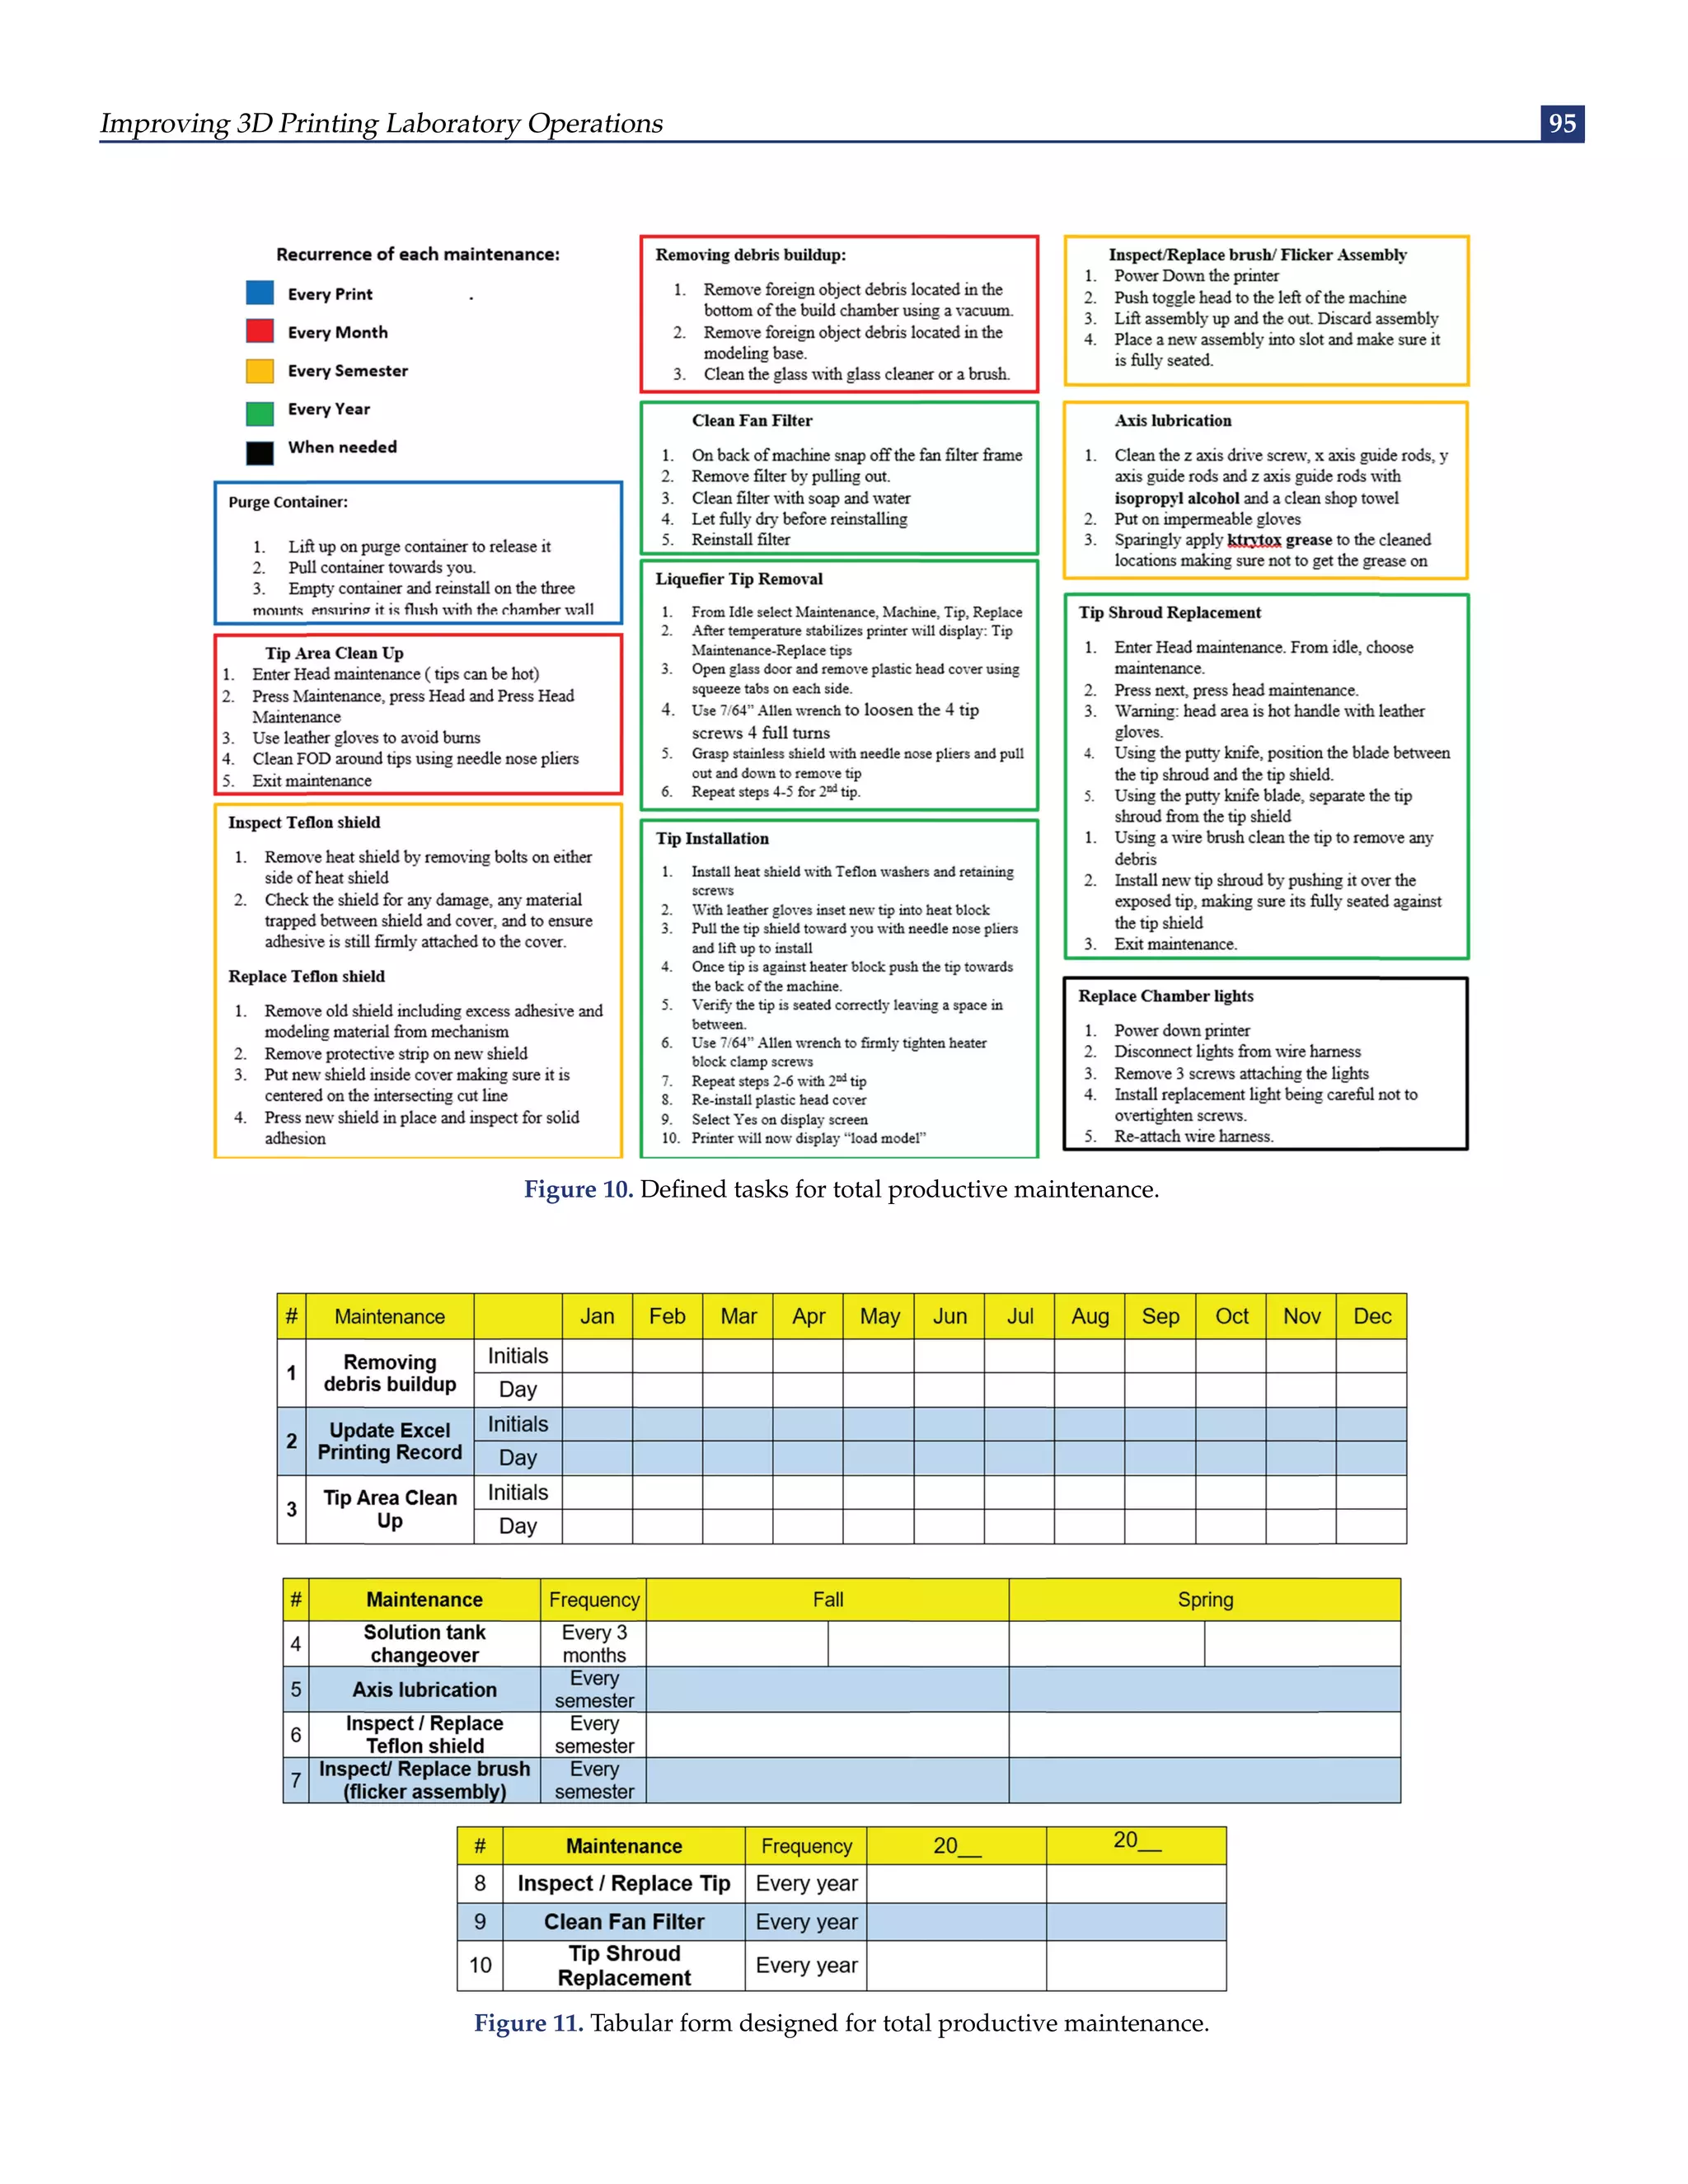
Total Productive Maintenance
TPM is a holistic approach to developing and maintain-
ing equipment and process reliability that involves all
personnel acting together to control and improve their
workplace [1]. TPM emphasizes proactive and preventa-
tive maintenance to maximize the operational efficiency of
equipment. It blurs the distinction between the roles of pro-
duction and maintenance by placing a strong emphasis on
empowering operators to help maintain their equipment.
For the problem of the support material sticking in the
printer, we found that one of the root causes was that
there was no preventive maintenance in place. Therefore,
as shown in Figure 10, we developed a standard procedure
with a checklist that describes the steps required for every
maintenance task to keep the machine in an optimal state.
A corresponding paper form, as shown in Figure 11, was
created to track the time of the maintenance tasks, which
also serves as a reminder for future tasks.](https://image.slidesharecdn.com/bijomrp20221111-230121113014-83587aae/75/Improving-3D-Printing-Laboratory-Operations-A-Case-Study-of-Lean-Six-Sigma-Implementation-7-2048.jpg)
![94 Octavio Zavala Castro and Hung-da Wan
Figure 9. Standardized operating procedure in six stages.
DMAIC—CONTROL PHASE
The spirit of the control phase is to sustain the results and
prevent the previous problems from happening again [15].
To have control over this process, several tabular forms
similar to Figure 11 and some checklists have been devel-
oped in order to enforce the new standard operating
procedures.
1. Tabular form for printer desk material control
2. Tabular form for cabinet material control
3. Tabular form for maintenance control
4. Maintenance steps work sheet
5. Checklist of printing process
Additionally, we started using online document storage
to make the information available in real time to all staff
members. The communication between operators is greatly
improved as a result of this initiative. Now everyone
knows exactly which steps of the requested jobs have been
completed and which are pending.](https://image.slidesharecdn.com/bijomrp20221111-230121113014-83587aae/75/Improving-3D-Printing-Laboratory-Operations-A-Case-Study-of-Lean-Six-Sigma-Implementation-8-2048.jpg)
![96 Octavio Zavala Castro and Hung-da Wan
CONCLUSION
In this case study, the DMAIC methodology was adopted
to guide the improvement project. Different Lean Six Sigma
tools were applied at every phase of this methodology,
following the logic to describe the process and issues,
understand the gaps, and solve the problems. New forms
and procedures were created to control the operations,
from materials handling and data management to print-
ing and maintenance, so that the improved performance
would be sustained.
The main improvement made in this project was the
reduced time and effort spent on managing the print jobs,
raw materials, and equipment. This improvement is essen-
tial, as students and researchers need their prototypes as
soon as possible to conduct their research. Now we are able
to deliver the results in a timely manner and within a more
predictable timeframe.
This case proved that the Lean Six Sigma tools are as
effective in a small 3D printing laboratory as they are in
large companies. By using this methodology, we were able
to identify the problems, solve them, and control the results
in a systematic way.
The goal of this paper is to present a case study that pro-
vides insights into practicing Lean Six Sigma in the setting
of an educational and research environment. Despite the
fact that this paper contains no theoretical breakthroughs
or technological innovations, we hope that the lessons
learned and experiences gained from this improvement
project will be useful to other Lean Six Sigma practitioners
in similar situations. We also hope this paper will encour-
age more Lean Six Sigma practitioners in other sectors to
share their successes.
REFERENCES
[1] Allen, J., Robinson, C., Stewart, D. (2001). Lean manufacturing?: a plant
floor guide. Dearborn, MI: Society of Manufacturing Engineers.
[2] Balogun, V. A., Kirkwood, N., & Mativenga, P. T. (2015). Energy
consumption and carbon footprint analysis of Fused Deposition
Modelling: A case study of RP Stratasys Dimension SST FDM.
Energy consumption and carbon footprint analysis of Fused Depo-
sition Modelling: A case study of RP Stratasys Dimension SST FDM.,
6(8), 1–6.
[3] Breyfogle, F. W. (2003). Implementing Six Sigma: Smarter Solutions
Using Statistical Methods (2ed). Hoboken, NJ:John Wiley & Sons.
[4] Brown, C. (2019). Why and how to employ the SIPOC model. Journal
of Business Continuity & Emergency Planning. 12(3), 198–210.
[5] Ford, S. and Minshall, T. (2019). Where and How 3d Printing is Used
in Teaching and Education. Additive Manufacturing. 25, 131–150.
[6] Hassan, M. F. and Jalaludin, I. M. (2016). Application of why-why
analysis to improve predictive maintenance strategy for injection
molding machine. Information Technology Journal. 15(4), 130–136.
[7] Hirano, H. (1995). 5 Pillars of the Visual Workplace: The sourcebook for
5S Implementation. Portland, OR: Productivity Press.
[8] Jayanth, N., Senthil, P., & Prakash, C. (2018). Effect of chemical
treatment on tensile strength and surface roughness of 3D-printed
ABS using the FDM process. Virtual and Physical Prototyping, 13(3),
155–163.
[9] Jiménez, M., Romero, L., Domínguez, M., & del Mar Espinosa, M.
(2015). 5S methodology implementation in the laboratories of an
industrial engineering university school. Safety science, 78, 163–172.
[10] Kumar, J., Kataria, K. K., Luthra, S. (2020). Quality circle: a method-
ology to enhance the plant capacity through why-why analysis.
International Journal of Mathematical, Engineering and Management
Sciences. 5(3), 463–472.
[11] Mancha, J., Puente, M., Kuriger, G., et al. (2015). Work Measurement
and Standard Work Instruction Improvement: A Molding Plant.
Industrial and Systems Engineering Research Conference. Nashville, TN,
USA, May 2015.
[12] Nethada, N. and Wan, H. (2019). Eight-Step Improvement on a
Materials Engineering Laboratory Class. Institute of Industrial and
Systems Engineering (IISE) Annual Conference, Orlando, FL, USA, May
2019.
[13] Pyzdek, T. and Keller, P. (2018). The Six Sigma Handbook (5ed). New
York, NY: McGraw-Hill Education.
[14] Roy, J. (2019). Engineering by the Numbers. American Society of
Engineering Education. https://ira.asee.org/by-the-numbers/
accessed 20 October 2022.
[15] Srinivasan, K., Muthu, S., Devadasan, S. R., & Sugumaran, C. (2016).
Six Sigma through DMAIC phases: a literature review. International
Journal of Productivity and Quality Management, 17(2), 236–257.
[16] Stamper, R. E. and Dekker, D. L. (2000). Utilizing Rapid Prototyping
to Enhance Undergraduate Engineering Education. Proceedings of the
30th ASEE/IEEE Frontiers in Education Conference. Kansas City, USA,
October 2000, pp. 1–4.
[17] Sunder, M. V. (2016). Lean Six Sigma in Higher Education Institu-
tions. International Journal of Quality and Service Sciences. 8(2), 159–178.
[18] Wan, H. (2015). 3D Printing for Engineering Students – Understand-
ing and Misunderstanding. ASEE Gulf-Southwest Annual Conference,
San Antonio, TX, USA, March 2015.](https://image.slidesharecdn.com/bijomrp20221111-230121113014-83587aae/75/Improving-3D-Printing-Laboratory-Operations-A-Case-Study-of-Lean-Six-Sigma-Implementation-10-2048.jpg)
This document presents a case study on improving the operations of a 3D printing laboratory through the implementation of lean six sigma methodologies. It details the challenges faced due to increased demand for 3D printing services and outlines the steps taken using the DMAIC process to enhance efficiency, including material management and standard operating procedures. The results demonstrate that lean six sigma is applicable not only in manufacturing but also in educational settings, leading to quicker service and reduced errors.


