SlideShare a Scribd company logo
1 of 146
Shourya
JSW STEEL COATED PRODUCTS LIMITED
KALMESHWAR
ISO 9001: 2015,ISO 14001:2015, ISO45001:2007,ISO 50001:2018 CERTIFIED UNIT
Quality Circle : SHOURYA
34th National Convention on Quality Concept
Welcomes You
Theme -: Self-Reliant India through Quality Concept 1
Shourya
SR. No DESCRIPTION Slide No
1 Introduction 6 - 16
2 Awards and CSR & Management initiatives 17 - 18
3 Introduction of Department and Quality Circle 19 - 21
4 Identification of problems 22 - 27
5
Selection of problem
• Categorization in A,B,C - A,B,C Analysis
• 3 – P Analysis (Ranking, weightage, Pareto Diagram)
28 – 41
6
Definition of problem
• Gantt Chart
• Introduction
• Process Description through flow diagram
• Problem Description in brief
• Explanation of problem – its impact.
• Setting of Objectives and Goals
42 - 59
7
Analysis of problem
• Data collection
60 - 66
Index
2
Shourya
SR. No DESCRIPTION Slide No
8
Cause and Effect analysis
• Affinity Diagram
• Cause and effect diagram (Fish bone diagram)
67 - 70
9
Root cause analysis
• Why-Why Analysis
• Identification by Validation
• Summary of Problem using 5 W and 1 H Analysis
71 - 84
10
Data analysis
• Data Collection
• Bar Graph •
• Comparative study
• Pie-Chart
85- 98
11
Development of solution
• Development of solutions through brain storming
• ICITE matrix
• Time Bound and responsibility shared action Plan.
99 - 108
12 Foreseeing probable Resistance and points to overcome them 109 - 112
Index
3
Shourya
SR. No DESCRIPTION Slide No
13
Trial implementation & Check Performance
• Smart Analysis
• PDCA Cycle
• Comparative study before QC and during trial.
• Trial and Actual plan
113 - 122
14
Regular implementation
• Data collection after regular implementation.
• Comparative study before and after QC graphs.
• Tangible and Intangible benefits
123 - 132
15
Follow up and Review and Recurrence Prevention
• Check lists
• Gantt chart with reason for Variation
• Kaizen
133 - 146
Index
4
Shourya
SHRI O.P.JINDAL
(August 7, 1930 – March 31, 2005)
“ Where others saw walls, he saw doors ”
Our Founder Chairman
5
Shourya
• JSW Group is a major player in steel industry
amongst the leading conglomerates in India, it is a
$14 billion company. It has become a single largest
steel plant in India through speed and innovation in
short span of time
• JSW STEEL LTD. is India's leading integrated steel
manufacturer with capacity of 18 MTPA
• Its Key Infrastructure Sectors are :
Integrated Steel Plant
Downstream Plant
Steel Energy Infrastructure Cement Ventures
Paints Realty
Introduction of JSW Steel
6
Shourya
With our strong VPV, JSW is a mark of trust and quality that millions of
customers around the world depend on
VISION
TO BRING POSITIVE TRANSFORMATION TO EVERY LIFE
WE TOUCH
PURPOSE
ACCELERATE THE GROWTH AND PROSPERITY OF THE
COMMUNITIES WE LIVE IN BY
VALUES
Confidence Courage Commitment Compassion Collaboration
7
Shourya
ACHIEVEMENTS OF JSW STEEL
JSW Salem Won Deming Prize in
2019
Steel Minister’s Trophy Recognized by
World Steel
Associations
President
Donald
Trump
Acknowledges
JSW Steel’s
efforts in the
US
CSR Award
2020 Energy
Management
Award
8
Shourya
Some CSR Activities
 Our JSW Foundation is committed to creating more smiles at every step of the journey. The
organization is in constant pursuit of making life better for communities with its various initiatives in
the fields of health, education, livelihood and sports along with art and culture.
9
Shourya
0757: Shop floor mantra for continuous improvement
10
Shourya
JSW STEEL COATED PRODUCTS, KALMESHWAR
State : Maharashtra
District : Nagpur
Location : MIDC Area of Kalmeshwar
Estb : 1st August, 1985
Area : 147 Acres
No. of Employees : 680
Capacity : 0.66 Million Ton / Year
Kalmeshwar
11
Shourya
HR Slitter CPL
MILL-1 CGL-1
MILL-2
MILL-3
CGL-2
GALVALUME
Finishing lines
CCL-1/CCL-2
Dispatches
HR COIL
Cold Rolling Galvanizing
Pickling
HR Slitting
CR/GP Slitting
Colour Coating
Overview of JSW Kalmeshwar
•The first plant in India featuring the Hitachi 6 Hi cold
reversing facility from Japan
•A special combination to process thinner gauge and thicker
gauge (Up to 3.15 mm – G/HRGI Production)
•A first-of-its-kind continuous pickling Line
•It manufactures licensed BIEC – a specialized Galvalume
product
•Its central location makes its products accessible to domestic
partners across India
12
Shourya
Joint
Press
Pretreat
ment
Tanks
Cold Rolling Process
Color Coating Process
Shear
Pickling Process
Galvanizing Process
Uncoiler
Shear Welder Wet Loop Pit Pickling Tanks Exit Looper Side Trimmer Shear
Cold Rolling Mill Un coiler
Shear Welder
Entry Looper
Furnace
Zinc Pot
Jet Cooling
Quench
Tank
Skin Pass Mill cum
Tension leveler
Chromate
Tank
Exit
Looper
Shear
Guard
Film
Unit
Exit Loop
Entry Loop
Back
Coater
Oven Water
Cooling
Dryer
Prime
Coater
Top Coater
Oven
Oven
Process Flow
13
Shourya
Major Equipment's in Lines with there uses
Acid Pickling Tank in Continuous Pickling
Line (CPL) - To Remove Oxide layers.
Cold Rolling Mill (CRM) - It is used to reduce
thickness of Coil
Cold Rolling Skin Pass Mill (SKP) – It is used
to clear defects and make elongation.
Zinc pot and Furnace is used in Galvanizing line (CGL-1 & 2) – Galvanizing is done to prevent
the rust of coil.
Color Coating Line (CCL) – It is used to coat
the coil with color.
Zinc pot Furnace
14
Shourya
Our Products and Esteem Customers
Products
Cold Rolled (CR)
Color Coated Products Galvanized
Galvalume
Customers
15
Shourya
Applications
Roofing Sheets Steel Pipes TMT Bars
Stainless Steel Automobile Chequered Plates
16
Shourya
Our Credentials
Sr No NATIONALAWARDS YEAR
1 The Honorable Ramkrishna Bajaj National Quality Award 2019
2
JSW Kalmeshwar is awarded with National Energy Conservation award in appreciation of
efforts in energy conservation in the mini Blast Furnace Sector
2018
3 Silver certificate of merit, India Manufacturing Excellence Award 2017
Sr No STATE AWARDS YEAR
1 GHR (G H Raisoni) Award for innovative Practices in manufacturing 2019
2
Certificate of Merit at State Level Award for Energy Conservation & Management in metal
& steel Sector
2017-18
3 1ST Position, Best Domestic Customer, Concor Award 2017
4 3RD Position by MEDA for Energy Conservation 2016
17
Shourya
Our Achievements
Our quality circle ‘YUKTI’ have also
won some CCQC and NCQC awards in
2019
We have also won CCQC
Platinum Award in Nagpur
Chapter 2020
18
Shourya
Our Inspiration
Mr. Paresh Shah
Plant Head
Mr. Devendra Vaidya
HOD, Operation
Department
Mr. Abhay Girare
HOD, Business
Excellence
19
Shourya
Our Team Members and Details of QC
QUALITY CIRCLE NAME SHOURYA
TITLE IMPROVEMENT IN HR TO CR YIELD
PROJECT STARTED ON May 01, 2020
PROJECT COMPLETED ON July 20, 2020
NO. OF MEETINGS 22
ATTENDANCE 94%
PERIODICITY OF MEETINGS On Every Wednesday
VENUE Mill Conference Hall
Sagar Patil Shraddha Chikhale Mahesh Werulkar
Dhanesh Vijayan
Rohit Gupta
Leader
Facilitator Team Member
Team Member
Team Member
20
Shourya
Flow of Our Presentation
12
11
10
9
8
7
6
5
4
3
2
1 Problem Identification
Follow-Up / Review
Categorization Problem
Selection of problem
Analyzing the problem
Identifying the causes
Finding out root cause
Data analysis
Developing solutions
Foreseeing resistance
Trial check performance
Regular implementation
We Followed DEMING
WHEEL, PDCA 12-Step
Methodology To Solve
Our Problem
 DEMING Wheel (PDCA 12-Step Methodology) :
 Sample PDCA Model
21
Shourya
Step – 1 :
Identification of Problems
Tools Used : Brain Storming
“All improvement happens project by project and
in no other way”
- Joseph M Juran
22
Shourya
Identification of Problems
DESCRIPITION CATEGORY
1. Gamma ray problem B
2. High Leaderend generation A
3. High Oil Consumption A
4. Roll coolant leakage in hose pipe B
5. Frequent nozzle choking C
6. Roll lock get open during running B
7. High ph of DM water B
8. Non-availability of crane due to
breakdown
A
9. Roll coolant carryover B
10. High roll consumption A
11. Hydraulic leakage from bending
cylinder
C
12. Morg oil leakage C
DESCRIPITION CATEGORY
13. Delay in SAP C
14. Thickness variation A
15. CR Sheet A
16. Delivery Tension Reel Drive
Problem
B
17. (Air oil) Mist Leakage B
18. Morg Oil Pressure C
19. Black surface A
20. PLC Communication error B
21.Heat exchanger problem B
22. Proximity switches malfunction B
23. WR + IMR bending Cylinder
leakage
A
24. Improper calibration C
25. CR baby A
26. Error in Magna Scale C
23
Shourya
DESCRIPITION CATEGORY
41. CR trimming A
42. Drives tripped B
43. HR Trimming A
44. High noise generation A
45. Gamma Ray shutter closed in
running
C
46. Fumes generation A
47. Slippery Area A
48. Wrinkle A
49. Alignment problem B
50. Poor shape due to buckling C
51. Coolant Contamination C
52. Width Variation A
53. Poor trimming in HR A
Identification of Problems
DESCRIPITION CATEGORY
27. Chattering Mark A
28. DC breaker tripping C
29. ETR Motor high temperature B
30. Gauge Reading error B
31. HMI error C
32. Level 2 PC Malfunctioning C
33. CR Arising A
34. Band Generation A
35. Ridge Formation in CR coil A
36. Rusty Patches A
37. ASD Failure B
38. EBA Failure C
39. Coolant leakages A
40. Air leakages A
24
Shourya
DESCRIPITION CATEGORY
67. Spalling of rolls A
68. Frequent tripping of crane A
69. HR end cut A
70. Sliver in HR coil A
71. Shortage of DM water A
72. HDPE liner came out from clamp B
73. Flapper guide finger issue B
74. Auxiliary tripped B
75. High DM water consumption A
76. Hydraulic leakage from main jack
cylinder
A
77. Oil spillage after taking out roll
from mill
B
78. Frequent tightening of side guide
Cassette
B
Identification of Problems
DESCRIPITION CATEGORY
54. HR side slit A
55. Miss roll generation A
56. Feeding delay in Hard Grade coil A
57. Bearing pitting mark C
58. Bearing seize problem C
59. Side guide roller change for damage B
60. HR baby A
61. High waste Oil generation A
62. CPC not available at POR B
63. Gamma ray error A
64. Skidding problem A
65. Shear non-availability at POR B
66. Tension reel fault A
25
Shourya
DESCRIPITION CATEGORY
93. Shortage of rolling oil A
94. Shortage of coil storage area A
95. Roll bite Problem C
96. Shortage of rolls A
97. Shortage of manpower A
98. Deflector roll temperature problem C
99. Side roll bearing failure B
100. Mandrel gripper failure C
101. Mandrel Bearing failure C
102. OBBS failure B
103. Wedge Display measurement
problem
B
104. Auto Zeroing problem A
105. Levelling problem A
Identification of Problems
DESCRIPITION CATEGORY
79. Scratch mark A
80. V-Notch in coils A
81. Holes in Coil A
82. BUR roll damage mark A
83. Improper coil winding A
84. OD wrap get shifted during taking
out coil
C
85. High power consumption C
86. Side tracking in all the lines B
87. Shearing problem C
88. Passline failure problem B
89. Failure of WR and IMR locker B
90. Pipe hose leakage C
91. Cobble guard problem C
92. Tilting problem A
26
Shourya
 So, we Identified 105 number of problems and categorized them into A, B
and C category which we have explained in next step
There are mainly 5
Types of
Brainstorming
1. Conventional
Method
2. Affinity Method
3. Idea based Method
4. KPI based method
5. Direct method
For Identification of
Problems, we mainly
used the Conventional
Method.
 Brainstorming :
Identification of Problems
27
Shourya
Step – 2 :
Selection of Problems
Tools used : ABC Analysis
Pie Chart
3P Analysis
Bar Graph
Stacked Bar Graph
Pareto Chart
“It is not enough to do your best; you must know what to do, and then do
your best”
W. Edwards Deming
28
Shourya
Step 2 : Selection of Problem
Categorization of Problem : Using ABC analysis
A : Problems which can be
solved within the
Department
B : Problems which can be
solved with the help of
other Department
C : Problems which needs
help from the Management
TYPE PROBLEMS NO TOTAL PERCENTAGE
A 2,3,8,10,14,15,19,23,25,27,33,34,35,3
6,39,40,41,43,44,46,47,48,52,53,54,5
5,56,60,61,63,64,66,67,68,69,70,71,7
5,76,79,80,81,82,83,92,93,94,96,97,1
04,105
51 56.67%
B 1,4,6,7,9,16,17,20,21,22,29,30,37,42,
49,59,72,73,77,62,65,74,78
23 25.56%
C 5,11,12,13,18,24,26,28,31,32,38,45,50
,51,57,58
16 17.78%
 After Categorization of problems into A, B and C Category, we made a pie chart
29
Shourya
Step 2 : Selection of Problem
57%
25%
18%
PERCENTAGE
A B C
B
C
A
• After plotting Pie Chart, we found that A
Category has more number of
problems with the highest percentage
than other categories.
• So we decided to solve this category
problems first, as other categories can
be controlled easily by controlling A
category which posses no other serious
issues.
 Thus, we analyze the percentage of each category by using pie chart. Further, we
use 3PAnalysis to solve A category problem.
Pie Chart :
30
Shourya
3PAnalysis to solve identified A category problems
Step 2 : Selection of Problem
1st P –
PROPRIETERY :
(Nominal groupings) based
on company’s policy and
strategic planning.
2nd P –
PRIORITY : Selection of
one from above with
specific concern of dept.
On weightage system.
3rd P –
PREFERENCE : Final
selection of one problem
from sensitive group, based
on data collection.
3PAnalysis
31
Shourya
1st P – PROPRIETERY
 From brainstorming, we have identified five sensitive aspects of our work area as the proprieties of our company.
 We have classified all categories of problems based on nature of work in following aspects.
Proprietary Problem Nos. Total %
Utilization 8,23,39,56,63,64,66,68,76,92,93,96,97,104,105 15 28.85
Material Yield 2,15,25,33,41,43,54,55,60,69,70,71,79,80,81,82,83 18 34.62
Quality 14,19,27, 34,35,36,48,52,53 9 17.31
Cost 10,3,40,61,67,75 6 11.54
Safety 44,46,47,94 4 7.69
Step 2 : Selection of Problem
32
Shourya
Step 2 : Selection of Problem
1st P – PROPRIETERY
Thus, after analyzing the Proprietary, we found that ‘Material Yield’ has the higher
number of percentage. So, we decided to give ranking using Priority method i.e. 2 P
0
2
4
6
8
10
12
14
16
18
20
Total
Total
Proprietery
Proprietary
Utilization Material Yield Quality Cost Safety
33
Shourya
2nd P – PRIORITY
 1 P- Proprietary grouping, further prioritized by Ranking Method using ECT technique
( ECT = Effect, Cost and Time, respectively )
Sr.
No
Priority
Team Members Name
Total Percentage
Shraddha Rohit Mahesh Dhanesh Sagar
1 Utilization 3 4 3 2 4 16 21.92%
2
Material
Yield
5 4 5 5 4 23 31.51%
3 Quality 4 2 1 3 3 13 17.81%
4 Cost 1 2 3 4 1 11 15.07%
5 Safety 2 1 2 2 3 10 13.70%
Step 2 : Selection of Problem
34
Shourya
2nd P – PRIORITY
 In this 2 P, each member of our group gave there rankings according to the ECT. Thus, we found
that Material Yield has highest percentage. So we selected Material Yield related problems to solve.
Step 2 : Selection of Problem
35
Shourya
3rd P – PREFERENCE
Step 2 : Selection of Problem
,
Sr. No
Material Yield Related
Problems
Effect Cost Time Total
1 High Leader end generation 5 5 4 14
2 CR Sheet 3 1 2 6
3 CR baby 2 2 1 5
4 CR Arising 1 3 3 7
5 CR trimming 5 1 2 8
6 HR Trimming 5 1 1 7
7 HR side slit 3 4 2 9
8 Miss roll generation 1 3 2 6
9 HR baby 1 1 1 3
 After 2 P, we further elaborated each ‘Material Yield’ related problems which has major contribution.
36
Shourya
3rd P – PREFERENCE
Step 2 : Selection of Problem
Sr. No
Material Yield Related
Problems
Effect Cost Time Total
10 HR end cut 4 2 1 7
11 Sliver in HR coil 2 4 3 9
12 Shortage of DM water 1 3 4 8
13 Scratch mark 3 2 2 7
14 V-Notch in coils 5 1 1 7
15 Holes in Coil 1 3 2 6
16 BUR roll damage mark 3 5 1 9
17 Improper coil winding 2 4 2 8
 Cont..
37-
Shourya
3rd P – PREFERENCE
Step 2 : Selection of Problem
0 5 10 15 20 25 30
High Leader end generation
CR Sheet
CR baby
CR Arising
CR trimming
HR Trimming
HR side slit
Miss roll generation
HR baby
HR end cut
Sliver in HR coil
Shortage of DM water
Scratch mark
V-Notch in coils
Holes in Coil
BUR roll damage mark
Improper coil winding
Stacked Bar Graph
Effect Cost Time Total
38
Shourya
3rd P – PREFERENCE
Sr. No Material Yield Problems
Diverted Qty
(MT)
Cumulative %Cum
1 P-2 : High Leaderend Generation 1299.3 1299.3 45.84%
2 P-15 : CR Sheet 36.6 2255.8 79.59%
3 P-25 : CR Baby coils 79.4 2378.241 83.91%
4 P-33 : CR Arising 20.8 2481.041 87.54%
5 P-41 : CR Trimming 41.7 2560.441 90.34%
6 P-43 : HR Trimming 956.5 2613.241 92.21%
7 P-54 : HR side slit 31.8 2654.941 93.68%
8 P-55 : Miss Roll generation 8.9 2691.541 94.97%
9 P-60 : HR Baby coils 11.8 2723.341 96.09%
Step 2 : Selection of Problem
Note : In this table, P indicates problem
• After that, we also made a ‘Pareto Chart’
39
Shourya
Sr. No Quality Related Problems
Diverted
Qty (MT)
Cumulative %Cum
10 P-69 : HR end cut 52.8 2745.336 96.87%
11 P-70 : Sliver in HR coil 18.2 2766.136 97.60%
12 P-71 : Shortage of DM water 1.82 2784.336 98.24%
13 P-79 : Scratch Mark 122.441 2801.171 98.84%
14 P-80 : V Notch in Coils 102.8 2812.971 99.25%
15 P-81 : Holes in coil 10.43 2823.401 99.62%
16 P-82 : BUR rolls damage mark 21.995 2832.301 99.94%
17 P-83 : Improper coil winding 16.835 2834.121 100.00%
 Based on the above data, we plotted a Pareto chart
Step 2 : Selection of Problem
 Cont..
40
Shourya
 After Plotting and
analyzing the Pareto
chart we found that, P-2
has highest number of
diversion.
So, we selected our Problem
as
“Improvement
In HR To CR
Yield”
Step 2 : Selection of Problem
Vital Few Useful Many
41
Shourya
Step – 3 :
Definition of Problem
Tools used : Gantt Chart
Flow Diagram
Data Collection
Clustered Graph
Pie-Chart
“ Quality control starts and ends with training”
- Kaoru Ishikawa
42
Shourya
Step 3 : Definition of Problem
 Scheduled Gantt Chart :
SR No ACTIVITIES 1 2 3 4 5 6 7 8 9 10 11
12-
18
18-
22
REMARKS
1 Identification of Work related problems Planned for 1 Week
2 Selection of Problems Planned for 1 Week
3 Define the Problems Planned for 1 Week
4 Analyze the problem Planned for 1 Week
5 Identification of causes Planned for 1 Week
6 Finding out the root causes Planned for 1 Week
7 Data analysis Planned for 2 Weeks
8 Developing solutions Planned for 1 Week
9 Foreseeing Probable resistance Planned for 1 Week
10 Trial Implementation and check performance Planned for 2 Weeks
11 Regular Implementation Planned for 1 Week
12 Follow Up/Review Planned for 1 Week
Team Name : SHOURYA
Title : IMPROVEMENT IN HR TO CR YIELD
Start Date : 1st May 2020
End Date : 20th July 2020
Leader : Shraddha Chikhale
Facilitator : Rohit Gupta
Members : Sagar Patil
Dhanesh Vijayan
Mahesh Werulkar
43
Shourya
- It is a Metal forming process in which an Ingot is passed
between hard rollers to get a desired shape, thickness and
surface finish.
Ingot : A piece of relatively pure metal, usually metal, that is
cast into a shape for further processing.
 Definition of Rolling :
 Cold Rolling :
- If the temperature of the metal is below its recrystallization
(between 400-700 °C) temperature, the process is known as cold rolling.
(Advantages : Good dimensional accuracy and Surface
Finish)
 Reversible Rolling Mill :
- A reversing mill is a rolling mill in which the work piece is
passed forward and backward through a pair of rolls.
The reversing mill is so named because the steel runs back and
forth between the rollers, reducing the thickness incrementally
with each pass.
- A reversing mill can be used to reduce material to gauge.
Rolling
Step 3 : Definition of Problem
44
Shourya
TECHNICAL SPECIFICATIONS
1 Speed 1200 mpm
2 Input Rolling Thickness 1.2 to 6 mm
3 Output Rolling Thickness 0.13 to 3.5 mm
4 Width 500 to 1290 mm
5 Thickness control Auto gauge control
6 Flatness control Intermediate roll shifting/ roll bending
6 Hi Reversible Rolling Mill
 HITACHI Cold Rolling Mill :
 Grades :
JDHCG04ACN JDHST29ACN JDHCG04BCN JDHST46ILZ
JDHCG04B1N JDHST29DCN JDHCG06BCN JVHGLE4AS0
JDHCG04BCN JDHST46ILZ JDHSH41ALN JVHGLH4AS0
JDHCG06BCN JDHCG04ACN JDHST29ACN JVHWT02A00
JDHSH41ALN JDHCG04B1N JDHST29DCN TBLCO8
 Context :
- Our Plant is the first in India featuring Hitachi 6 Hi cold
reversing Mill from Japan.
- A Hitachi 6 Hi Cold Rolling Reversible Mill is installed
for cold rolling of the pickled coils to the desired thickness
as per the customers requirements.
- Mill has the capacity and capability to produce cold
rolled sheet of table top flatness.
- Finished product of mill ( CR Coils ) are processed further
in coating lines.
Step 3 : Definition of Problem
45
Shourya
Step 3 : Definition of Problem
DTR ETR POR
Mill Stand
Coil selection
from plan
Coil charging in
POR mandrel
Pass schedule
preparation for
selected coils
Feeding of coil
from POR to DTR
After giving load
and tension rolling
start
Taking out feeding coil from
one side and scrap from
other side
Diverting / Parting
of Coil
Send to Next Process
Salvage
Quality
Check
 Basic Layout of 6 HI Mill :
 Process Description of Mill through Flow Chart :
Delivery
Tension Reel
Entry
Tension Reel
Pay Off Reel
46
Shourya
Step 3 : Definition of Problem
Loading of coil on entry
skid
Putting of coil on pay off
reel
Removing of coil
Output product of mill
Rolling of coil to get
specified thickness
Scheduling (as per plan)
Rolling process of 6HI
mill
Feeding of 1st pass
Note : Here we have shown pictorial representation of our Mill 47
Shourya
Supplier Input
CPL
HR Coil
Width Range : 700-1270 mm
Thickness : 1.6 – 4.5 mm
Coil – Inner/Outer Dia :
Coil Weight : 25 Ton (Max)
Utility DM Water
Ph : 5.5 - 6.5
Conductivity : 10
(Max)
MSEB Power
Bao Steel,
Bajrang Steel,
GPI, Sino steel,
Superior Forge,
Union Electric.
Rolls
Houghton,
Witmans
Advanced Fluid
Rolling Oil
Process Output Customer
6HI CRM - 1
(HITACHI)
Max. Mill Speed
1200 MPM
CR Coil
Thickness: 0.12 mm – 3.0 mm
Width range: 700 –1270 mm
Coil – Inner/Outer dia: 508/1850
Coil wt: 25 Ton (Max)
CR Leader end: upto 400 Kg
CR Baby: 500 Kg < Wt< 2000 Kg
HR Baby: 500 Kg < Wt< 2000 Kg
Galvalume
CCL
CGL
Step 3 : Definition of Problem
 Mill Processing Details :
48
Shourya
 Generation of Leader End at Mill :
- In Reversible Mill, CR coils are finalized either at DTR side or ETR Side
and Leader End generate at the opposite end of the final product.
- Also, in ID there is leader end which goes with CR coil to further
processing lines i.e., CGL1, CGL2 and Galva.
- At these lines, leader end at the ID gets cut for reducing the stoppage of
lines.
- These cut portion i.e., leader end at Mill and coating lines directly
impacts to yield which is a direct loss to our company.
Step 3 : Definition of Problem
Leader End Finished CR Coil
Unrolled Part ( Roll bite to Mandrel)
49
Shourya
Step 3 : Definition of Problem
 What is Leader End ?
- It is an unrolled portion of coil which is generated in Reversible Cold Rolling Mill.
 How Leader End is generated in Mill ?
- While processing the HR coil from POR to DTR, some unrolled HR is left in
ID due to process limitation, as end to end rolling is not possible in cold
reversible mill
 Why unrolled portion in ID ?
- End of HR coil is gripped in gripper and 1.5 wraps (min) is taken in mandrel also Length of material from
mandrel to roll bite is not processed in gauge required.
- This unrolled portion of HR in ID,
 provides base for coil build up
 prevents coil from collapse
 How Leader End is generated in processing lines ?
- Galvanizing lines are continuous processing lines, and they process only prime material
which is as per gauge and shape requirement. As there is HR and off gauge in ID of CR
coils, which is sent from cold rolling mills, so this material in ID is parted and removed.
Leader End
50
Shourya
Step 3 : Definition of Problem
Here we shown
how leader end
is generated at
galvalume line
due to black
patches
51
Shourya
 Why Leader End generation is high?
- The norms which are set to cut the Leader End is 400 kg.
- But if some problems are identified prior to HR wraps, then
operator cut this portion so as to avoid the line stoppage.
- This portion of coil which they cut sometimes come more than 400 kg
- So this higher weight of Leader End becomes direct loss to our
company and ultimately affects the yield.
 List of problems which are identified prior to HR wraps, resulted in high Leader End generation :
HR in ID Off- Gauge Buckling
Step 3 : Definition of Problem
52
Shourya
Black Patches Edge Waviness
Description
Norms
%
Percentage of Leader
Ends
Leader End Mill 1.1% 1.15 %
Leader End (CGL1) 2.0% 2.02 %
Leader End (CGL 2) 2.0% 2.08 %
Leader End (Galva) 2.0% 2.42 %
 Percentage of Leader Ends at various Lines due to above problems which are below 400 kg are :
 From the table drawn, it is found that Percentage of Leader
End at Galva is more than its norms i.e., 2.42 % which is
much more higher than other lines.
 Due to this higher Leader End, delay and division takes place
in lines.
 So to avoid this, we first calculated the number of coils which
are diverted due to the above problems in each month since the
problem started.
Edge Damage
Step 3 : Definition of Problem
53
Shourya
 Diversion Quantities in galvalume month wise :
Problems
Dec 19
(MT)
Jan 20
(MT)
Feb 20
(MT)
Mar 20
(MT)
Apr 20
(MT)
Grand
Total MT
Percentage
HR in ID 1.2 0.84 2.13 1.86 0 6.03 3.79%
Off -Gauge 3.2 0.98 1.415 0.84 0 6.435 4.05%
Buckling 8.72 5.48 3.68 4.89 0 22.77 14.33%
Black Patches 36.41 11.73 20.32 10.625 0 79.085 49.77%
Edge Crack 4.115 10.739 5.82 0.88 0 21.554 13.56%
Edge Waviness 12.19 5.99 3.26 1.59 0 23.03 14.49%
 Further we have also shown quality assurance report where we have identified more number of
problems from other coating lines.
Step 3 : Definition of Problem
54
Shourya
Step 3 : Definition of Problem
We are getting this
Quality Assurance report
from quality dept. where
the problems of all the
processing lines are
shown
Quality Assurance Report :
 To further elaborate this, we made a Clustered Chart and Pie Chart for proper detail clarification so as
to get which problem has higher impact and affecting to it; which results in high Leader End.
55
Shourya
5%
6%
11%
52%
13%
13%
Percentage
HR in ID Off-Guage Buckling
Black Patches Edge Crack Edge Waviness
- From Pie Chart we found that, Black Patches have
highest number of diversion percentage i.e. 52 %
- It is much more higher than other problems.
- It is accountable for the major problematic part of
yield loss.
- Further, we also made graph related to diversion as
shown in next slide.
0 50 100 150 200
HR in ID
Off-Guage
Buckling
Black Patches
Edge Crack
Edge Waviness
Percentage - With the help of this Clustered Chart we found that,
Black Patches contribute major in all problems.
- It has total of 161.41 Qty (MT) of Diverted coils
Step 3 : Definition of Problem
23.03
21.554
79.085
22.77
6.435
6.03
56
Shourya
Step 3 : Definition of Problem
 Emails from the coating lines expressing their concerns and disappointment regarding their issues
57
Shourya
Step 3 : Definition of Problem
System generated yield report is shown above
58
Shourya
Impact of Problem :
Improvement in
HR to CR yield
due to Black
Patches
Quality Related
Production Related
Internal Customer Complaint Increases by 0.42%
Production Yield Reduced by 2.42 %
Delay time Increases by 4 hr /month
Utilization Decreases by 0.5% per month
Diversion Increases by 0.6% per month
Goals and Objectives of our QC are :
Step 3 : Definition of Problem
Goal: To Improve HR to CR yield from 2.42% To 2%.
Objective:
1. To reduce leader end generation at coating lines
2. To reduce diversion
3. To increase mill utilization by avoiding delays for coolant leakage arresting
4. To provide good CR coils to further processing line by reducing Black Patches
5. To maintain roll coolant parameters within norms
59
Shourya
Step – 4 :
Analysis of Problem
Tools used : Data Collection
“It is only the last turn of a bolt that tightens it; the rest is just movement”
-Shigeo Shingo
60
Shourya
 First we gathered the data of particular coils from Galvalume Line :
NNote : Leader Ends are also known as Coil Ends
Step 4 : Analysis of Problem
Coil End Report (Galva) :
61
Shourya
 After that we segregated the Black patches coils having Leader Ends above and below 400 kg using
Pivot Table; of Mill and Galvalume Line of each month as shown below :
Cum till June Galva
Incharge Below 250
Kg
251-300
Kg
301-350
Kg
351-400
Kg
401-450
Kg
451-500
Kg
501-1000
Kg
Above 1000
Kg
Grand Total
Kg
ANKIT 1 31 63 82 48 19 47 1 292
DHIRENDER 33 68 36 34 12 18 1 202
GANESH 1 8 22 22 23 12 11 13 112
JITENDRA 3 13 24 36 18 4 13 111
KUMRAWAT 1 1 3 1 4 10
TASLIM 1 24 65 53 48 19 18 1 229
Grand Total 7 109 242 230 174 67 111 16 956
Percentage 0.73% 11.40% 25.31% 24.06% 18.20% 7.01% 11.61% 1.67% 100.00%
61.51% 38.49%
Note :
Here we have
shown only a
sample of June,
2020
Pain area,
38% to be
reduced to
20%
Step 4 : Analysis of Problem
No of Coils
62
Shourya
Step 4 : Analysis of Problem
Cum till June Galva
Incharge Below 250
Kg
251-300
Kg
301-350
Kg
351-400
Kg
401-450
Kg
451-500
Kg
501-1000
Kg
Above 1000
Kg
Grand Total
Kg
ANKIT 1 31 63 82 48 19 47 1 292
DHIRENDER 33 68 36 34 12 18 1 202
GANESH 1 8 22 22 23 12 11 13 112
JITENDRA 3 13 24 36 18 4 13 111
KUMRAWAT 1 1 3 1 4 10
TASLIM 1 24 65 53 48 19 18 1 229
Grand Total 7 109 242 230 174 67 111 16 956
Percentage 0.73% 11.40% 25.31% 24.06% 18.20% 7.01% 11.61% 1.67% 100.00%
61.51% 38.49%
 Our main concern area is coil ends above
400kg
 So we have collected the data of coil end
above 400 kg (<400 kg) affected due to
black patches as shown in our next slide.
63
Shourya
 Data of Coil Ends above 400 Kg
DATE SHIFT CR BATCH
CR THK
(MM)
CR WIDTH
(MM)
CR WT
(MT)
COIL END
WT (MT)
REASON FOR COIL END
GENERATION
10.07.2020 C KM2A0G0322 0.306 1220 20.06 0.46 HR AND BLACK PATCH
10.07.2020 C KM1A0G0299 0.406 1220 20.02 0.67 Loose shape/CB/Shifting
10.07.2020 C KM1A0G0298 0.406 1220 19.95 0.4 HR AND BLACK PATCH
10.07.2020 C KM1A0G0297 0.406 1220 20.15 0.8 Loose shape/CB/Shifting
10.07.2020 C KM2A0G0326 0.406 1220 20.2 0.45 HR AND BLACK PATCH
11.07.2020 A KM2A0G0327 0.406 1220 19.82 0.41 HR AND BLACK PATCH
11.07.2020 A KM1A0G0305 0.478 1220 24.75 0.46 HR AND BLACK PATCH
11.07.2020 B KM1A0G0270 0.444 1220 12.61 0.58 Loose shape/CB/Shifting
11.07.2020 B KM1A0G0314 0.406 1220 20.1 0.44 HR
11.07.2020 B KM2A0G0346 0.312 1220 20.2 0.45 HR
11.07.2020 B KM2A0G0344 0.306 1220 20.31 0.47 HR
12.07.2020 A KM1A0G0325 0.362 1220 19.86 0.46 HR AND BLACK PATCH
12.07.2020 A KM1A0G0333 0.462 1220 22.03 0.44 HR AND BLACK PATCH
12.07.2020 A KM2A0G0365 0.462 1220 20 0.53 LOOSE SHAPE,SHIFTING D/S
Step 4 : Analysis of Problem
64
Shourya
 Also checked all Roll Coolant parameters of Oil
Shift Wise Norms A B C
6 Hi (M1)
(WITMA
NS
LUBRO
DL 603)
Total Oil (%) 2.00 - 3.50 2.89 2.20 2.09
Scum (%) 1.00 (Max) 0.30 0.20 0.16
Iron (ppm) 400 (Max) 346 389 249
pH 5.50 - 6.50 5.96 6.42 5.39
Conductivity
(μs/cm)
300 (Max) 196 223 223
 Checked Emulsion of oil :
Whitman OIL
Line Parameters checked Requirements Results
6 HI (M1)
Chloride (PPM) 60 Max. 54.00
Sap value (mg KOH/gm) 180 Min. 179.26
Acid value(mg KOH/gm) 30 Max. 29.41
Active oil % 85 Min. 81.565
Tramp oil % 15 Max. 9.85
 We collected Shift wise data and found from the above Roll Coolant Parameters of Oil and Emulsion of Oil that it
has no such significant effect to our problem. As all are in the required range of targeted norms.
Step 4 : Analysis of Problem
65
Shourya
Checked some Components of our Mill :
1. We have also taken some planned shutdown to analyze whether there is Maintenance
related problems or not.
2. Thus, we checked each and every component of our mill which may directly effects
to Black Patches and increases our Leader Ends.
3. Following are the job list which we checked while shutdown :
• Roll Coolant Nozzle
• Roll Coolant Pipe / Hose Leakage
• Effectiveness of Air Wiper system for Coolant removal from strip
• Dripping of accumulated coolant over strip in running
• Effectiveness of fume exhaust system to check dripping of condensate fumes
• Roll coolant header (cobble guard) condition for any leakage and puncture
• Scope of extra air wiping system
Step 4 : Analysis of Problem
66
Shourya
Step – 5 :
Identification Of Causes
Tools used : Affinity Diagram
Fish-Bone Diagram
“Having no problem is the biggest problem of all”
-Taichi Onho
67
Shourya
By Brainstorming Method, we listed out all various probable causes. And by using
this probable causes, we mapped Affinity Diagram.
MAN METHOD MATERIAL MACHINE
• Unskilled
Operator
• Improper
Knowledge
• Low Observation
Skills
• SOP not followed
• Coolant
Parameters not
maintained
• SOP Not followed
• Wiping Nozzle not
operated at the
right time
• Coolant
Parameters not
maintained
• Roll coolant level
not maintained
• Improper Pickling
• Line Speed
variation
• Rolling oil
quality not
adequate
• Improper pH of
DM water
• Acid carryover
in HR coil
• Improper pH of
roll coolant
• Poor anti
staining quality
of emulsion
• Inadequate
Pneumatic system
Pressure
• Coolant leakage in
system
• Gap between air
wiping knife not
properly set
• Insufficient time lag
for auto coolant
blow off
Step 5 : Identification of Causes
68
Shourya
Step 5 : Identification of Causes
Fishbone
 After listing out probable causes, we made FISHBONE
Diagram for further analysis (Cost and Effect Diagram)
Brainstorming
69
Shourya
Step 5 : Identification of Causes
Improvement
in HR to Cr
Yield
MAN
MACHINE
METHOD
MATERIAL
Unskilled Operator
Coolant Parameters not maintained
Low Observation Skills
SOP not followed
Improper Knowledge
Roll coolant level not maintained
SOP Not followed
Wiping Nozzle not operated at the right time
Improper Pickling
Line Speed variation
Rolling oil quality not adequate
Poor anti staining quality of emulsion
Acid carryover in HR coil
Improper pH of roll coolant
Improper pH of DM
water
Inadequate Pneumatic system Pressure
Insufficient time lag for auto
coolant blow off
Coolant leakage in system
Gap between air wiping knife
not properly set
FISHBONE Diagram (Cost and Effect Diagram) :
Note : Black = Causes ; Yellow = Sub Causes 70
Shourya
Step – 6 :
Root Cause Analysis
Tools used : WHY-WHY Analysis
FISH-BONE Analysis
5W-1H Technique
“It is not enough to do your best; you must know what to do, and then do your best”
-W. Edwards Deming
71
Shourya
 WHY-WHYAnalysis of valid root causes
Identification of man related causes
Man related
Cause Remarks Significant
Unskilled Operator
Training to be given to
operators
Significant
Improper
Knowledge
Some workers don’t have
deep knowledge
Non Significant
Low Observation
Skills
Training to be given to
operators
Non Significant
SOP not followed
Not aware of importance of
SOP compliance
Non Significant
Coolant Parameters
not maintained
Not following SOP for
maintaining and monitoring
of roll coolant parameters
Significant
Step 6 : Root Cause Analysis
72
Shourya
Step 6 : Root Cause Analysis
Man Related causes :
Identification of man related causes
Man related
Cause Remarks Significant
Unskilled Operator Training to be given to operators Significant
Coolant Parameters not
maintained
Not following SOP for maintaining and
monitoring of roll coolant parameters
Significant
73
Shourya
Identification of material related causes
Material
related
Cause Remarks Significant
Rolling oil quality
not adequate
Complaint to be raised of
supplier
Non Significant
Poor anti staining
quality of emulsion
Complaint to be raised of
supplier to provide better
anti staining property of
emulsion
Non Significant
Improper pH of
roll coolant
Pickling quality to be
improved
Significant
Acid carryover in
HR coil
SOP to be updated to
improve pickling quality
Non Significant
Improper pH of
DM water
DM water pH to be
monitored and immediate
action to be taken in case of
any deviation
Non Significant
Step 6 : Root Cause Analysis
74
Shourya
Step 6 : Root Cause Analysis
Material Related causes :
Identification of material related causes
Material related
Cause Remarks Significant
Improper pH of roll
coolant
Pickling quality to be improved Significant
75
Shourya
Identification of machine related causes
Machine
related
Cause Remarks Significant
Inadequate
Pneumatic system
Pressure
Air pressure to be monitored
and maintained regularly
Significant
Insufficient time
lag for auto coolant
blow off
Coolant blow off time to be
increased from 20 sec to 30
sec
Significant
Gap between air
wiping knife not
properly set
Gap between air knife slit to
be checked and maintained
on regular basis
Significant
Coolant leakage in
system
Coolant leakage to be
arrested immediately
Significant
Aging of equipment
New wiping system to be
procured
New pipe line to be installed
Non significant
Machine
Mill Photo
Step 6 : Root Cause Analysis
76
Shourya
Step 6 : Root Cause Analysis
Machine Related causes :
Identification of machine related causes
Machine related
Cause Remarks Significant
Inadequate Pneumatic
system Pressure
Air pressure to be monitored and
maintained regularly
Significant
Insufficient time lag for auto
coolant blow off
Coolant blow off time to be increased
from 20 sec to 30 sec
Significant
Gap between air wiping
knife not properly set
Gap between air knife slit to be checked
and maintained on regular basis
Significant
Coolant leakage in system
Coolant leakage to be arrested
immediately
Significant
77
Shourya
Identification of Method related causes
Method
Cause Remarks Significant
SOP Not followed
Not aware of importance of
SOP compliance
Non significant
Line stoppage
Line stoppage will cause
more black patch generation
Non significant
Improper Pickling
Pickling quality to be
improved
Non significant
Roll coolant level
not maintained
Not effective
Non significant
Wiping Nozzle not
operated at the right
time
Training to be given to
operators for timely operation
of air wiping nozzle
Significant
Step 6 : Root Cause Analysis
78
Shourya
Step 6 : Root Cause Analysis
Method Related causes :
Identification of Method related causes
Method
Cause Remarks Significant
Wiping Nozzle not operated
at the right time
Training to be given to operators for
timely operation of air wiping nozzle
Significant
79
Shourya
 List of Significant Causes :
Sr. No Category Significant Causes
1 Man Unskilled Operator
Coolant Parameters not maintained
2 Method Wiping Nozzle not operated at the right time
3 Machine Inadequate Pneumatic system Pressure
Insufficient time lag for auto coolant blow off
Gap between air wiping knife not properly set
Coolant leakage in system
4 Material Rolling oil quality not adequate
Acid carryover in HR coil
 Man Related causes :
WHY ? WHY ? VALID
Unskilled
Operator
Lack of basic
Knowledge
Lack of Training
Proper Training
given related to
the production
Need for training
not identified
N
WHY ?
 WHY-WHYAnalysis of valid root causes
Man
Method
Machine
Material
Man
Method
Machine
Material
Step 6 : Root Cause Analysis
Note : Green = Valid ; Black = Invalid 80
Shourya
 WHY-WHYAnalysis of valid root causes
Coolant
Parameters not
maintained
Lack of knowledge
about parameters
Lack of Training
Proper Training
given related to
maintaining of
coolant parameters
 Man Related causes :
Wiping Nozzle
not operated at
the right time
- Valve malfunctioning
- Wiping nozzles not
operated on time
Malfunctioning of
FRL Unit
Debris in Air
Training to be
given to operators
for timely
operation of air
wiping nozzle
 Method Related causes :
WHY ?
WHY ?
WHY ? WHY ?
WHY ?
VALID
N
VALID
N
Air leakages in pipe
Air pressure to be
monitored and
maintained regularly
Pipeline Erosion
Inadequate
Pneumatic system
Pressure
Erosive
Environment
Ageing of pipeline
WHY ? WHY ?
WHY ? VALID
N
 Machine Related causes :
Step 6 : Root Cause Analysis
Note : Green = Valid ; Black = Invalid 81
Shourya
Gap between air
wiping knife not
properly set
- Due to shearing of
bolts
- Scum stuck between
it Impact from
strip breakage
Gap between air
knife slit to be
checked and
maintained on
regular basis
As per planned
maintenance gap
not checked
Ageing factor
Coolant leakage
in system
Hose and pipe
Ageing factor Pipeline erode
Vibration in
pipeline
Not done proper
clamping
Coolant leakage to
be arrested
immediately
WHY
WHY ? WHY ?
VALID
N
VALID
N
WHY ?
WHY ?
WHY ?
WHY ?
 Machine Related causes :
 Material related causes :
Inappropriate
rolling oil
properties
Required norms
not maintained by
supplier
Complaint to be
raised to supplier
Inadequate quality
of rolling oil
WHY ? WHY ? VALID
N
Acid carryover in
HR coil
Squeeze rolls
damaged
Lack of inspection
procedure
SOP to be updated to improve
pickling quality
WHY ? WHY ? VALID
N
Step 6 : Root Cause Analysis
Note : Green = Valid ; Black = Invalid 82
Shourya
Improvement
in HR to Cr
Yield
MAN
MACHINE
METHOD
MATERIAL
Unskilled Operator
Coolant Parameters not maintained
Low Observation Skills
SOP not followed
Improper Knowledge
Roll coolant level not maintained
SOP Not followed
Wiping Nozzle not operated at the right time
Improper Pickling
Line Speed variation
Rolling oil quality not adequate
Poor anti staining quality of emulsion
Acid carryover in HR coil
Improper pH of roll coolant
Improper pH of DM
water
Inadequate Pneumatic system Pressure
Insufficient time lag for auto
coolant blow off
Coolant leakage in system
Gap between air wiping knife
not properly set
Note : Black = Causes ; Yellow = Sub Causes
 After listing out probable causes, we made FISHBONE Diagram for further analysis (Cost
and Effect Diagram)
Step 6 : Root Cause Analysis
83
Shourya
Questions Analysis
What is the
situation?
High weight leader end due to black
patches
Where is the
problem?
At coating lines which is next process after
rolling
When does it
occur?
Due to heavy coolant carryover
Which factors
get affected?
Production and power consumption
Why does it
happen?
Coolant leakage at mill from coolant hoses
How does it
happen?
Blackish patches are generated in coil
when coolant get dried over sheet
 5W-1H Analysis : ( What, Where, When, Which, Why-How )
5W &
1H
Analysis
What
When
Why
How
Where
Which
Step 6 : Root Cause Analysis
84
Shourya
Step – 7 :
Data Analysis On Causes
Tools used : Data collection
Bar-Graph
Comparative Study
Stratification Graph
Pie - Chart
“Without a standard there is no logical basis for making decisions or taking decisions”
-Joesph M Juran
85
Shourya
0
100
200
300
400
500
600
700
2020.02.01
2020.02.03
2020.02.05
2020.02.07
2020.02.09
2020.02.11
2020.02.13
2020.02.15
2020.02.17
2020.02.19
2020.02.21
2020.02.23
2020.02.25
2020.02.27
2020.02.29
Feb-20 (Liters/Day)
 Oil Consumption Trend :
1. From the above graphs , It is inferred that our consumption was initially at higher side (Nov-19 to Feb-20)
than its expected norms (7500 Ltr per Month) as shown.
2. In the month of Feb-20, the range is much more higher. So we collected the Feb-20 day wise data and
observed that ‘The Coolant Parameters’ were not within our Range. So further we studied Coolant
Parameters.
TGT -250 Ltr/Day
 Observations and Findings :
Step 7 : Data Analysis on causes
7206
8536
7956
9115
8413
0
8589
0
1000
2000
3000
4000
5000
6000
7000
8000
9000
10000
Nov, 19 Dec, 19 Jan, 20 Feb, 20 Mar, 20 Apr, 20 May, 20
Litres
Month
Oil Consumption (Litres/Month)
Lockdown
Target (7500Ltr/Day)
86
Shourya
Step 7 : Data Analysis on causes
Oil Consumption Trend in the month of February
DM Board of Oil Consumption
Here as we
see, trend
in the
month of
Feb is
much more
higher than
its norms
i.e., above
0.5 L/T
Higher
Range
 We have also Collected data of oil concentration in Lit/Ton
87
Shourya
0
0.5
1
1.5
2
2.5
3
3.5
4
Concentration % (Feb-20)
 Coolant parameters : Oil Concentration
- From the above graph as shown, after studying The Coolant parameters it is found that we are not getting required
Oil Concentration.
Expected range - 2.00% to 3.50%
Actual range – Below 2.00%
Note : Here we have shown the data of feb-20, as the oil concentration was too less as compared to other month
TGT – 2 to 3.5%
 Observations and Findings :
Step 7 : Data Analysis on causes
1.75%
1.80% 2.00%
1.40%
1.68%
0.00%
1.88%
0.00%
0.50%
1.00%
1.50%
2.00%
2.50%
3.00%
3.50%
4.00%
4.50%
Nov, 19 Dec, 19 Jan, 20 Feb, 20 Mar, 20 Apr, 20 May, 20
Conc.
%
Month
Oil Concentration % ( Month Wise)
Target (2.0 to 3.5%)
Lockdown
88
Shourya
 Coolant parameters : pH Concentration
- From the above graph as shown, after studying The Coolant parameters it is found that we are not getting
required Oil Concentration.
Expected range - 5.50 to 6.50
Actual range – Below 5.50
Note : Here we have shown the data of feb-20, as the pH level was too less as compared to other month
0
0.5
1
1.5
2
2.5
3
3.5
4
4.5
5
5.5
6
6.5
7
7.5
pH Level
TGT – 5.5 to 6.5
 Observations and Findings :
Step 7 : Data Analysis on causes
4.67
4.9
5
2.89
4.89
0
5.1
0
0.5
1
1.5
2
2.5
3
3.5
4
4.5
5
5.5
6
6.5
7
7.5
Nov, 19 Dec, 19 Jan, 20 Feb, 20 Mar, 20 Apr, 20 May, 20
pH
Level
Month
pH range (5.5-6.5)
Target (5.50 to 6.50)
Lockdown
89
Shourya
0
100
200
300
400
500
600
700
800
900
1000
Fe concentration (PPM)
- From the above graph as shown, after studying The Coolant parameters it is found that we are not getting required
Iron Content.
Expected range – Below 400 (PPM)
Actual range – Above 400 (PPM)
Note : Here we have shown the data of feb-20, as the Iron content was too high as compared to other month
 Coolant parameters : Iron Content
 Observations and Findings :
TGT – Below 400 PPM
Step 7 : Data Analysis on causes
600
589 542
789
550
0
643
0
100
200
300
400
500
600
700
800
900
Nov, 19 Dec, 19 Jan, 20 Feb, 20 Mar, 20 Apr, 20 May, 20
Iron
Content
Month
Iron Content (PPM)
Target (Below 400 PPM)
Lockdown
90
Shourya
Step 7 : Data Analysis on causes
Here as we
see,
Process
Parameters
in the
month of
Feb of our
DM Board
Higher
Range
DM Board of Process parameters
Oil
Iron Content
PH
91
Shourya
- To check whether wiping nozzle (Air Knife) is impacting or not to Black Patches, we have performed
following activities during our Planned Shutdown.
Sr. No Activities Observation Remarks
1 Pneumatic valve checked All valves are ok and in working Condition No Impact
2
Pressure of Pneumatic
system Checked
Pressure is ok (5 to 6 kg / cm² ) No Impact
3
Checked Condition of FRL
unit
All three filters, regulator and lubricator are
functioning good and OK
No Impact
4 Dry air at Line calculated
No moisture contained in line and air is suitable
for working condition
No Impact
5 Air Knife gap checked
Gap Checked with filler gauge and Found equal
throughout its length
No Impact
6 Blow OFF time Checked Blow OFF time : 20 sec i.e., OK No Impact
Step 7 : Data Analysis on causes
 Malfunctioning of Wiping Nozzle :
Note : From the above data, we found that there were no problems contributing to Black Patches 92
Shourya
Step 7 : Data Analysis on causes
Air Knife gap checked Pneumatic valve checked
Checked FRL unit
Pressure of Pneumatic
system Checked
 Above are the images that we have checked related to the Malfunctioning of
Wiping Nozzle in system but NO IMPACT was found due to it
93
Shourya
SR.
NO
ACTIVITIES OBSERVATION REMARKS
1
Coolant nozzle header in
cobble guard checked
No leakage found in cobble guard nozzle No impact
2
Coolant leakage from pipe line
checked
No leakage found in coolant pipe line No impact
3
Coolant leakage from strip
coolant header checked
No leakage found in strip coolant header No impact
4
Inspection done for coolant
accumulated in gamma ray
runner
Gamma ray runner found free from accumulated
coolant
No impact
 Coolant leakages in system :
Note : From the above data, no impact was found in ‘Black Patches’
- To check whether Coolant leakages is impacting or not to Black Patches, we have performed following
activities during our Planned Shutdown.
Step 7 : Data Analysis on causes
94
Shourya
Step 7 : Data Analysis on causes
 Above are the images that we have checked related to the coolant leakages in system but NO
IMPACT was found due to it
 So we have not found any impact of above activities (Wiping Nozzle and Coolant Leakages) on
our issue (i.e., Black Patches), so the issue has not been taken into the account.
Coolant leakage from Pipe
Line checked
Coolant nozzle header in
Cobble Guard checked
Checked coolant accumulation
in Gamma Ray Unit
95
Shourya
Step 7 : Data Analysis on causes
Data Analysis on Root Causes for Validation
Month Coolant parameters
Wiping Nozzle mal-
functioning
Coolant leakages
in system
Total
Nov-20 2 0.5 1.8 4.3
Dec-20 1.8 1.23 0.1 3.13
Jan-20 4 0.68 0.32 5
Feb-20 3.7 1.67 0.2 5.57
Mar-20 6.1 1.1 1.84 9.04
Apr-20 0 0 0 0
Total 17.6 5.18 4.26
96
Shourya
Step 7 : Data Analysis on causes
Data Analysis on Root Causes for Validation
0
2
4
6
8
10
12
14
16
18
Coolant parameters Wiping Nozzle mal-functioning Coolant leakages in system
No
of
times
it
affected
Root Causes
Nov-20 Dec-20 Jan-20 Feb-20 Mar-20 Apr-20
Note : Stratification graph shows that, Coolant Parameters are major reason behind the Black patches 97
Shourya
95.36%
2.12% 2.52%
Impact in %
Coolant parameters Wiping Nozzle malfunctioning
Coolant Leakages in system
Also, From the pie-chart as
shown, contribution of each
affecting factors, i.e.,
1. Coolant parameters :
95.36%
2. Wiping nozzle
malfunctioning : 2.52%
3. Coolant leakages in
system : 2.12%
As the coolant parameters
are playing major role in
generation of black patches.
So we have focused mainly
on Coolant Parameters
Step 7 : Data Analysis on causes
98
Shourya
Step – 8 :
Development of solutions
Tools used : Brain-Storming
ICTIE Matrix
Responsibility Chart
“The starting point for improvement is to recognize the need”
- Masaaki Imai
99
Shourya
 For Developing solutions, we used Brainstorming Method and we got simple ideas to overcome this Problem.
SR.
NO.
POSSIBLE SOLUTIONS
1. Addition of emulsifier (WA10382) to improve oil concentration
2. Mixing of pH booster (WA10128)
3. Change of magnetic separator cycle time (ON/OFF) .
4. pH of DM water should be maintained
5. Additives of oil to be maintained
6. Controlled rate of oil addition for reducing oil consumption
7. Scum generation to be minimised with regular skimming
8. Synthetic oil to be used
Step 08 : Development of Solutions
We used ‘Brainstorming’
technique with our Associates
to find out possible solutions
100
Shourya
SR.
NO.
POSSIBLE SOLUTIONS REMARKS
1.
Addition of
emulsifier to
improve oil
concentration
• Standard quality of emulsifier to be used.
• It helps to mix oil and water easily to boost oil
concentration
• At our Mill, we used WA10382 emulsifier to get
required coolant concentration
2.
Scum generation
to be minimised
with regular
skimming
• Regular skimming is not possible due to limited
capacity of sump pit
• During production, continuous waste generation
takes place due to which sump pit already gets
occupied
• As it takes more time to separate oil and water at
ZLD ( Zero Liquid Discharge ), so draining is not
possible at fixed interval
Step 08 : Development of Solutions
Sump Pit
101
Shourya
SR.
NO.
POSSIBLE SOLUTIONS REMARKS
3.
Change of
magnetic
separator cycle
time (ON/OFF) .
• Proper (ON/OFF) cycle to be maintained to
remove Fe at control rate.
• Earlier the cycle timing was 10/40 min, but it
causes loss of oil along with iron.
• So we reduced cycle time to 5/30 min which helps
us to remove iron at controlled rate
4.
pH of DM water
should be
maintained
• By Maintaining DM water in range, we get proper
pH of emulsion
• Previous we were getting low pH of DM water
due to which coolant pH maintaining was not
possible.
• pH Buffer is also added to maintain the pH of DM
water in required range
Step 08 : Development of Solutions
102
Shourya
SR.
NO.
POSSIBLE SOLUTIONS REMARKS
5.
Synthetic oil to
be used
• Using this oil, we get proper oil concentration with
low oil consumption.
• Not possible as it is costlier
• Mill condition is not suitable for using this oil
6
Controlled rate
of oil addition for
reducing oil
consumption
• We have made pan for 30 L capacity with stopper
at oil top up area, consumption of oil can be easily
controlled
• Earlier we were adding approximate oil without
any measured instrument, resulting in more
addition of oil than its required limit.
• Now by using stopper, we have managed addition
of excess oil into the Coolant tank.
Step 08 : Development of Solutions
103
Shourya
SR.
NO.
POSSIBLE SOLUTIONS REMARKS
7
Additives of oil to be
maintained
• Oil must have proper additives such as anti Staining, Anti oxidant and Anti
Corrosive agents for getting required quality of finished product.
• Anti-Staining agents to be used for preventing excess adhesiveness on strip
surface
• Anti oxidants agents to be used to prevent oxide formation in Coolant.
• Anti Corrosive agents to be used to prevent the equipment ( Agitator, Coolant
Tank Inner surface, Magnetic Separator and Self Cleaning Filter, Backwash
Filter, Coolant pipeline, etc. ) which are in continuous contact with coolant.
8
Mixing
of pH
booster
• Standard quality of pH Booster to be used. For e.g. (WA10128)
• Due to low pH, separation of oil from water is not possible.
• Layer of oil gets formed over emulsion
• Creating problems in ETP ( Effluent Treatment Plant) like variation in colour
such as brown, reddish and black colour)
• Due to which more time required for waste treatment process at ZLD
• Frequent skidding problems taking place in Mill while operating any coil.
Step 08 : Development of Solutions
104
Shourya
SR.
NO.
FACTORS AFFECTING RESULTS
1.
Addition of emulsifier (WA10382) to improve oil
concentration
Build up proper concentration
2. Mixing of pH booster (WA10128) Required pH range obtained
3. Change of magnetic separator cycle time (ON/OFF) . Fe content and oil losses decreases
4. pH of DM water should be maintained Required Roll Coolant pH range obtained
5. Additives of oil to be maintained
Generation of Black patches has been reduced due to effective
anti staining properties
6 Controlled rate of oil addition for reducing oil consumption Oil consumption decreases
• After finding out the possible solutions for maintaining coolant parameters, we observed that the
intensity of black patches has been reduced significantly.
• In further processing lines, leader end generation has been reduced.
• Weight of leader end, earlier which was above 400 kg has now been reduced to below 400 kg
(within norms).
• It helps us in improving Hr to Cr yield which ultimately increases rate of production of Mill
and further coating lines ( Galva)
 Impact on Generation of Leader End
Leader End Photo
Step 08 : Development of Solutions
105
Shourya
Sr.
No.
Possible Solutions
Impact Of
Idea
Cost
Innovation
quotient
Time
Ease of
Implementation
Total
30+ Accepted
>30 NA
1.
Addition of emulsifier (WA10382)
to improve oil concentration
9 6 4 9 8 36
2. Mixing of pH booster (WA10128) 7 8 5 8 6 34
3.
Scum generation to be minimised
with regular skimming 4 6 3 5 7 25
4.
pH of DM water should be
maintained
6 5 6 7 4 28
5. Additives of oil to be maintained 7 6 5 8 6 32
6
Controlled rate of oil addition for
reducing oil consumption
5 7 5 6 6 29
7
Change of magnetic separator
cycle time (ON/OFF) . 8 6 6 7 7 34
8 Synthetic oil to be used 5 8 3 2 5 21
Step 08 : Development of Solutions
 We used ICTIE (Matrix for the best solution), also we have given numbers out of 10. 106
Shourya
Sr. No Probable Solution Suggested By Accepted / Rejected Remarks
1 Addition of emulsifier (WA10382) Shraddha Accepted Effective way for
building concentration
and maintaining pH
2 Mixing of pH booster (WA10128) Rohit Accepted
3 Scum generation to be minimised Mahesh Werulkar Rejected Not Feasible
4 Maintaining pH of DM water Shraddha Rejected Already in range
5 Additives of oil to be maintained Dhanesh Vijayan Accepted
Plays major role in
improving quality of
strip surface
6 Controlled rate of oil addition Rohit Rejected
Proper training should
be given for oil
addition
7
Change of magnetic separator cycle
time (ON/OFF) .
Sagar Accepted
Effective and easy way
to prevent oil losses
8 Synthetic oil to be used Mahesh Werulkar Rejected
Costlier and not
suitable for Mill
Step 08 : Development of Solutions
 Responsibilities were given to respective team members to monitor the solutions 107
Shourya
Sr.
No
Activity Responsibility
Target Days to
complete
Why to be done
1
Addition of emulsifier
(WA10382)
Shraddha 2 days
To ensure proper
concentration of
emulsion
2
Mixing of pH booster
(WA10128)
Rohit 2 days
To obtain required pH
level
3
Additives of oil to be
maintained Dhanesh Vijayan 3 days
To maintain proper
anti staining
properties of coolant
4
Change IN magnetic
separator cycle time
(ON/OFF) .
Sagar 4 days
To maintain required
Fe content along with
less oil losses
Step 08 : Development of Solutions
 Responsibility Chart :
 The Members monitored each activity and their remarks were used to find the best solution. 108
Shourya
Step – 9 :
Foreseeing Probable Resistance
Tools used : Brainstorming
“If you can't describe what you are doing as a process, you don't know what you're doing”
- W. Edwards Deming
109
Shourya
Addition of
emulsifier to
improve oil
concentration
Faced Difficulties while
Selection of proper
emulsifier
By studying properties of
emulsifier which gives
better concentration
Lack of information about
’ How much quantity of
emulsifier to be added ?
Decided Standard quantity
to be added by taking
various trials
Mixing of pH
booster
Selected pH booster
already available to us
was not satisfying mill
condition
Standard range decided to
add pH booster in coolant
With the help of quality
person and oil supplier we
have selected suitable pH
booster
Use of excessive pH
booster leads to mill
problem (skidding)
 Using Brainstorming, we noted down what resistances might be incurred with the selected Solution and worked
on overcoming these Resistances
Step 9 : Foreseeing Probable Resistance
Resistance - 1
Resistance - 2
110
Shourya
Change of
magnetic
separator
cycle time
(ON/OFF) .
Not getting required quality
of strip surface (Formation
of black patches increased)
Studied Standard quantity
of Anti Agents for getting
good quality of oil
Excessive use of additives
results in poor Coolant
property
Standard range of
additives was fixed
according to coolant
reports
Due to frequent change in
magnetic separator cycle,
operational efficiency
reduce.
Due to more ON and less
OFF time leads to more oil
losses along with iron
To overcome this, we
decided standard
ON/OFF time
To overcome this, we set
standard cycle time
Step 9 : Foreseeing Probable Resistance
Additives of
oil to be
maintained
Resistance - 4
Resistance - 3
111
Shourya
Improvement in HR to
CR yield
High Leader End in
Galvalume Line
Addition of
emulsifier to
improve oil
concentration
Mixing of pH
booster
Additives of oil to be
maintained
Change of magnetic
separator cycle time
(ON/OFF) .
Overview of problem :
Step 9 : Foreseeing Probable Resistance
112
Shourya
Step – 10 :
Trial Implementation and Check
Performance
Tools used : SMART Analysis
PDCA cycle
5W-1H Technique
Control Chart
“Quality has to be caused, not controlled”
- Philip B. Crosby
113
Shourya
S SPECIFIC/ SIMPLE Yes, It can be possible to achieve
M MEASURABLE
Yes, we can monitor it on daily/shift basis to check abnormalities
for Improving HR to CR Yield
A ACCOUNTABLE Yes, it accounts for increase in Yield from 95% to 95.5%.
R REALISTIC
Yes, system is sophisticated by continual improvement and
monitoring at Mill
T TIME BOUND
High Leader End weight due to Black Patches is reduced within
time period of Nov-19 to June-20
 For Verifying the recommendation of solutions, we use PDCA analysis
Step 10 : Trial Implementation and Check Performance
114
Shourya
• Trial to be taken for quantity
added and results achieved will
be recorded, for emulsifier, pH
booster and additives addition
• Training and Knowledge
sharing
• Regular checking of oil
concentration
• Checking and maintaining the pH
Level
• Regular Checking the norms of
oil additives
• To monitor magnetic separator
cycle time
• For Reducing High Leader End
Generation
• Addition of Emulsifier
• Mixing of pH booster
• Additives of oil to be maintained
• Change in Magnetic Separator
Cycle time (ON/OFF)
• Take appropriate actions to fulfill
the regular implementations for
reducing weight of Leader End
PLAN DO
CHECK
ACT
 For
Effective
Trial and
Implementa
tion we used
PDCA Cycle
for reducing
Leader End
Step 10 : Trial Implementation and Check Performance
115
Shourya
PLAN Type Description
What is to be planned
for reducing Leader end
?
Maintaining roll coolant parameters by:
1. Addition of emulsifier
2. Mixing of pH booster
3 Additives of oil to be maintained
4. Change IN magnetic separator cycle time (ON/OFF) .
Why is to be planned ? To reduce black patch generation to achieve minimum
rate of leader End generation
Who is responsible ? QC Team
When to be planned ? 01 June 2020
Where to implement the
plan ?
Galvalume line
How to Implement the
plan ?
1. By studying properties of emulsifier which gives
better concentration
2. Standard range decided to add pH booster in
coolant to maintain pH range of emulsion
3. Standard range of additives was fixed to improve
anti staining properties of emulsion
4. Standard ON/OFF time of magnetic separator to
maintain iron content in emulsion
DO Type Description
What is to be done ? 1. To implement our plan of using standard
additives
2. Carryout proper training and education and
following proper guidelines
Why is to be done ? To maintain the required coolant properties for
minimizing black Patches.
Who is responsible ? Operation and Quality Assurance Team
When it is to be done ? 01 July, 2020
Where it is to be done ? At 6Hi Mill
How it is to be done ? With the help of Operation person and oil supplier we
have decided to increase the quality of Roll Coolant
and reduce black patch generation to reduce leader
end generation
 We Further used 5W-1H Technique for each of element of PDCA Cycle of the Oil Additives to be maintained:
Step 10 : Trial Implementation and Check Performance
116
Shourya
CHECK Type Description
What is to be checked ? Regular monitoring of Leader End generation at
galvalume End due to black patch
Why it is to be checked ? To achieve minimum Leader End regularly
Who is Responsible ? QC Members
When it is to be checked ? In Every shift ( A, B, C)
Where it is to be checked ? At galvalume
How to Check ? By doing regular follow-up with galvalume shift
Incharge
By collecting data for leader end generation due to
black patch on daily basis
ACT Type Description
What action is to be taken ? We will standardize the time and quantity for
addition of various additives in emulsion by making
SOP for each parameters
Why to act ? To sustain the results achieved
Who is responsible ? Operation and maintenance department
When to act ? After successful trial implementation & customer
feedback
Where to act ? Galvalume lines
How to act ? With the help of Operator, Shift In charge and
maintenance Crew and daily analysis of leader end
generation and emulsion parameters
 We Further used 5W-1H Technique for each of element of PDCA Cycle of the Oil Additives to be maintained:
Step 10 : Trial Implementation and Check Performance
117
Shourya
Plan : For reducing Leader End Generation
1.Addition of emulsifier
2. Mixing of pH booster
3 Additives of oil to be maintained
4. Change IN magnetic separator cycle time
(ON/OFF).
Act :
1.As satisfied results are observed, we have
decided to continue these roll coolant
parameters at mill.
2. Regular feedback taken from customer end
(Galvalume)
Check :
1.Black patch generation at galvalume end
(Below 400 kgs)
2.Checked Coolant Parameters such as Oil
conc., Iron content, pH Level
 PDCA (Plan-Do-Check-Act) Cycle :
Step 10 : Trial Implementation and Check Performance
Before After
Magnetic cycle time in HMI
Before After
For good surface of coil : Emulsifier, pH
Booster, Additives are used
Do :
118
Shourya
SR No Shift Coils
Weight of Leader
End at Mill (MT)
Weight of Leader End
at Galvalume (MT)
Remarks
1 A KM1A0G0448 0.25 0.34 No black patch found
2 B KM1A0G0447 0.21 0.38 No black patch found
3 C KM1A0G0405 0.24 0.35 No black patch found
4 A KM1A0G0406 0.22 0.34 No black patch found
5 B KM1A0G0388 0.2 0.35 No black patch found
6 C KM1A0G0445 0.23 0.35 No black patch found
7 A KM1A0G0453 0.21 0.4 No black patch found
8 B KM1A0G0451 0.24 0.39 No black patch found
9 C KM1A0G0452 0.2 0.32 No black patch found
10 A KM1A0G0455 0.25 0.38 No black patch found
11 B KM1A0G0460 0.23 0.34 No black patch found
12 C KM1A0G0467 0.21 0.37 No black patch found
 Trial performance Checklist of Leader End :
Step 10 : Trial Implementation and Check Performance
119
Shourya
 Oil parameters Shift Wise performance sheet :
Date Parameters
Shift Wise Data
Date
Shift Wise Data
Date
Shift Wise Data
Norms A B C A B C A B C
1-Sept-20
OIL % 1.5-3.5 2.2 1.6 3.1
11-Sept-20
2.36 2.99 3.45
21-Sept-20
1.89 1.79 2.86
Iron ppm 0-600 436 582 468 379 459 458 496 582 489
ph 5.5-6.5 5.7 6.1 5.9 5.89 5.49 5.72 6.2 5.89 5.73
2-Sept-20
OIL % 1.5-3.5 1.89 1.79 2.86
12-Sept-20
2.47 2.33 1.56
22-Sept-20
2.2 1.6 3.1
Iron ppm 0-600 496 582 489 273 269 386 436 582 468
ph 5.5-6.5 6.2 5.89 5.73 5.61 5.89 5.73 5.7 6.1 5.9
3-Sept-20
OIL % 1.5-3.5 1.94 2.96 3.42
13-Sept-20
2.2 1.6 3.1
23-Sept-20
1.94 2.96 3.42
Iron ppm 0-600 572 546 473 436 582 468 572 546 473
ph 5.5-6.5 5.84 6.39 6 5.7 6.1 5.9 5.84 6.39 6.45
4-Sept-20
OIL % 1.5-3.5 3.12 3.48 3.16
14-Sept-20
1.89 1.79 2.86
24-Sept-20
2.2 1.6 3.1
Iron ppm 0-600 329 426 548 496 582 489 436 582 468
ph 5.5-6.5 5.62 6.12 6.03 6.2 5.89 5.73 5.7 6.1 5.9
5-Sept-20
OIL % 1.5-3.5 2.2 1.6 3.1
15-Sept-20
1.94 2.96 3.42
25-Sept-20
2.36 2.99 3.45
Iron ppm 0-600 436 582 468 572 546 473 379 459 458
ph 5.5-6.5 5.7 6.1 5.9 5.84 6.39 6.09 5.89 5.49 5.72
6-Sept-20
OIL % 1.5-3.5 1.89 1.79 2.86
16-Sept-20
2.36 2.99 3.45
26-Sept-20
1.94 2.96 3.42
Iron ppm 0-600 496 582 489 379 459 458 572 546 473
ph 5.5-6.5 6.2 5.89 5.73 5.89 5.49 5.72 5.84 6.39 6.13
7-Sept-20
OIL % 1.5-3.5 2.36 2.99 3.45
17-Sept-20
2.2 1.6 3.1
27-Sept-20
2.2 1.6 3.1
Iron ppm 0-600 379 459 458 436 582 468 436 582 468
ph 5.5-6.5 5.89 5.49 5.72 5.7 6.1 5.9 5.7 6.1 5.9
8-Sept-20
OIL % 1.5-3.5 2.2 1.6 3.1
18-Sept-20
1.94 2.96 3.42
28-Sept-20
1.89 1.79 2.86
Iron ppm 0-600 436 582 468 572 546 473 496 582 489
ph 5.5-6.5 5.7 6.1 5.9 5.84 6.39 6.74 6.2 5.89 5.73
9-Sept-20
OIL % 1.5-3.5 2.2 1.6 3.1
19-Sept-20
2.36 2.99 3.45
29-Sept-20
2.2 1.6 3.1
Iron ppm 0-600 436 582 468 379 459 458 436 582 468
ph 5.5-6.5 5.7 6.1 5.9 5.89 5.49 5.72 5.7 6.1 5.9
10-Sept-20
OIL % 1.5-3.5 1.94 2.96 3.42
21-Sept-20
1.89 1.79 2.86
30-Sept-20
1.89 1.79 2.86
Iron ppm 0-600 572 546 473 496 582 489 496 582 489
ph 5.5-6.5 5.84 6.39 6.48 6.2 5.89 5.73 6.2 5.89 5.73
Step 10 : Trial Implementation and Check Performance
 We have shown here the data of Oil Parameters of September Month 120
Shourya
 Performance chart of Leader End generation :
Step 10 : Trial Implementation and Check Performance
Leaderend in feb, 2020
0
0.2
0.4
0.6
0.8
1
1 2 3 4 5 6 7 8 9 10 11 12 13 14 15 16 17 18 19 20 21 22 23 24 25 26 27 28 29
Leaderend
Wt
(Ton)
Date
Leaderend generation performance chart
Leaderend in feb, 2020 Leaderend in Sept, 2020
121
Shourya
Step 10 : Trial Implementation and Check Performance
 Trial and Implementation of Oil 122
Shourya
Step – 11 :
Regular Implementation
Tools used : Data Collection
Line Graph
Bar Graph
Area Graph
“Cost is more important than quality but quality is the best way to reduce the cost”
-Genichi Taguchi
123
Shourya
 Month wise Production yield performance of leader end:
Month
Target
Yield
Actual
Yield
Total
Yield loss
% of Leader
end due to
Black patch
above 400 Kg
November-19 95.26% 95% -0.26 40%
December-19 95.26% 95.12% -0.14 38%
January-20 95.26% 94.98% -0.28 42%
February-20 95.26% 95.02% -0.24 35%
AVG. 95.26% 95.03% -0.23 93%
Month
Target Yield Actual Yield Total Yield loss
% of Leader end due to
Black patch above 400 Kg
March-2020 95.26% 95.49% 0.23 22%
April-2020 0 0 0 0
May-2020 95.26% 95.39% 0.13 20%
June-2020 95.26% 95.48% 0.22 15%
July-2020 95.26% 95.56 0.24 12%
August -2020 95.26% 95.86 0.16 8%
September - 2020 95.26% 95.77 0.17 10%
October -2020 95.26% 95.81 0.21 8%
AVG. 95.26% 95.44% 0.18 20%
 Month wise yield before QC  Month wise yield after QC
Step 11 : Regular Implementation
Lockdown
124
Shourya
Month
% of leader end
below 400 Kg
Month
% of leader
end below 400
Kg
Nov-19 76.00% May-20 79.00%
Dec-19 85.30% Jun-20 89.00%
Jan-20 83.12% July-20 85.00%
Feb-20 82.15% Aug-20 81.23%
Mar-20 84.23% Sept-20 86.89%
Apr-20 0 Oct-20 91.26%
 Data collection after regular implementation :
Step 11 : Regular Implementation
Lockdown
125
Shourya
 Line Graph : Showing Leader End of each months of previous shown data after regular
implementation :
Step 11 : Regular Implementation
0.00%
10.00%
20.00%
30.00%
40.00%
50.00%
60.00%
70.00%
80.00%
90.00%
100.00%
Nov-19 Dec-19 Jan-20 Feb-20 Mar-20 Apr-20 May-20 Jun-20 Jul-20 Aug-20 Sep-20 Oct-20
%
of
Leader
End
Month
% of leader end below 400 Kg
Lockdown
126
Shourya
Month HR to CR Yield
November, 19 85.89%
December, 19 87.77%
January, 20 84.68%
February, 20 80.13%
March, 2020 81.22%
April, 2020 0.00%
May, 2020 94.96%
June, 2020 95.48%
July, 20 95.56%
August, 20 95.86%
September, 20 95.77%
October, 20 95.81%
 Month Wise Yield Performance Chart :
Step 11 : Regular Implementation
85.89% 87.77%
84.68%
80.13% 81.22%
0.00%
94.96% 95.48% 95.56% 95.86% 95.77% 95.81%
0.00%
20.00%
40.00%
60.00%
80.00%
100.00%
120.00%
HR
to
CR
Yield
Month
HR to CR Yield
Before QC After QC
Lockdown
127
Shourya
 Month Wise Oil Concentration Chart :
Step 11 : Regular Implementation
Month
Oil Concentration (2-
3.5)%
November, 19 1.75%
December, 19 1.80%
January, 20 2.00%
February, 20 1.40%
March, 2020 1.68%
April, 2020 0.00%
May, 2020 1.88%
June, 2020 2.90%
July, 20 3.10%
August, 20 3.20%
September, 20 3.44%
October, 20 1.88%
1.75% 1.80%
2.00%
1.40%
1.68%
0.00%
1.88%
2.90%
3.10%
3.20%
3.44% 3.41%
0.00%
0.50%
1.00%
1.50%
2.00%
2.50%
3.00%
3.50%
4.00%
HR
to
CR
Yield
Months
Oil Concentration (2-3.5)%
After QC
Before QC
Lockdown
128
Shourya
 Month Wise pH Performance Chart :
Step 11 : Regular Implementation
4.65
4.9 5
2.89
4.89
0
5.1
5.77
5.89
6.2
6.09 6.15
0
1
2
3
4
5
6
7
November,
19
December,
19
January,
20
February,
20
March,
2020
April, 2020 May, 2020 June, 2020 July, 2020 August, 20 September,
20
October,
20
pH
Range
Months
pH range (5.5-6.5)
Month pH range (5.5-6.5)
November, 19 4.65
December, 19 4.9
January, 20 5
February, 20 2.89
March, 2020 4.89
April, 2020 0
May, 2020 4.7
June, 2020 5.1
July, 20 5.89
August, 20 6.2
September, 20 6.09
October, 20 4.65
Lockdown
Before QC After QC
129
Shourya
 Month Wise Chart of Iron Content :
Step 11 : Regular Implementation
Month
Iron Content (400
max)
November, 19 600
December, 19 589
January, 20 542
February, 20 789
March, 2020 550
April, 2020 0
May, 2020 443
June, 2020 402
July, 20 389
August, 20 351
September, 20 314
October, 20 335
600 589
542
789
550
0
443
402 389
351
314
335
0
100
200
300
400
500
600
700
800
900
Iron
Content
Month
Iron Content (400 max)
Lockdown
Before QC After QC
130
Shourya
 Cost Analysis after QC:
Cost analysis of Increasing Leader End due to
Black patches Before QC
Cost analysis of Increasing Leader End due to
Black patches After QC
Average coil end wt: 500 Kg
Target coil end: 400 Kg
Average coil end wt: 350 Kg
Target coil end: 400 Kg
A=Cost of prime material/ton (GP+CC)
= ₹ 70000
A=Cost of prime material/ton (GP+CC)
= ₹ 70000
B=Cost of leader end material/Ton
= ₹ 32000
B=Cost of leader end material/Ton
= ₹ 32000
C =Loss of material/Ton
C = A-B = 70000-32000
= 38000 ₹/Ton
C =Loss of material/Ton
C = A-B = 70000-32000
= 38000 ₹/Ton
D =Loss of material/Month
=0.10*500=50 Ton
D =Gain of material/Month
=0.15*500=75 Ton
E = Total loss = 50*38000
= 1900000 ₹/ Month
E = Total gain = 75*38000
= 2850000 ₹/ Month
Step 11 : Regular Implementation
131
Shourya
 Intangible benefits for the Quality circle members:
Befor…
After…
Before QC After QC
• Job Satisfaction
• Increased Co-operation
• Improved Self Confidence
• Increased Computer Knowledge
• Improved presentation Skills
• Increased Innovative spirit
• Communication Skills
• Problem Solving Skills
• QC Knowledge
5 S Improvement : Improved House Keeping
Safety : Developed Safe Work Atmosphere using Du-Pont Technique
Step 11 : Regular Implementation
132
Shourya
---------------------------------------------------------------------------------------------------------------------------------------------------
---------------------------------------------------------------------------------------------------------------------------------------------------
---------------------------------------------------------------------------------------------------------
Step – 12 :
Follow Up and Review
Tools used : Gantt Chart
“Quality is fitness for intended use”
-Joseph M Juran
133
Shourya
 Checklist for important parameters to be maintained
 For maintaining Oil Parameters
1. Reporting in mail to everyone
2. Daily noting in Log Book
These parameters are to be
reviewed by QC members on
Regular basis at the end of every
shift as shown here.
Line Parameters checked Requirement
A - Shift B - Shift C - Shift
Result Remarks Result Remarks Result Remarks
6 Hi (M1)
Total Oil (%) 2.00 - 3.50 2.20 OK 2.00 OK 2.00 OK
Scum (%) 1.00 (Max) 0.20 OK 0.20 OK 0.20 OK
Iron (ppm) 400 (Max) 356 OK 334 OK 334 OK
pH 5.50 - 6.50 5.86 OK 5.90 OK 6.20 OK
Step 12 : Follow Up and Review
134
Shourya
Sr. No Sujhaav Title Sujhaav By
Submitted
On
HOD
Remarks
Closure
Status
1
Stand to be make to place the coil end/leader
end
Dhanesh
Vijayan
10/6/2020
Safety And
House Keeping
Approved
2
Wiper arrangement require at Mill-1 to wipe
out the coolant carry over
Mahesh
Werulkar
10/6/2020
Qms, Improved
Quality
Pending
with HOD
3
improve coolant quality at mill 1 by
installing oil skimmer
Rohit Gupta 9/7/2020 QMS Approved
4 coolant pipe line change Shraddha 11/8/2020
QMS, improved
utilization and
quality
Approved
5 Water Conservation
Dhanesh
Vijayan
11/8/2020 Closed Approved
6
safety barricade around coil storage and
Leader End area,
Rohit Gupta 15/9/2020 ok Approved
 We have also made some Sujhaav in our organization Sujhaav Portal as shown below :
Step 12 : Follow Up and Review
135
Shourya
Format No: 08.16.01
QMP No.09
START DATE 1-Nov-19
QUALITY
OBJECTIVE:
SCOPE:
RESPONSIBILITY:
Responsibility Trgt Date Com pletion
Date
Expences Status / Rem arks
Shift
Incharge
Regular Regular Ok
Shift
Incharge
Regular Regular Ok
Shift
Incharge
Regular Regular Ok
Review Date: Remarks Section I/C: -
Sign - Unit I/C: - Sign - Section I/C: - Sign -HOD : -
Remarks HOD: -
Analyse the Coil ends coming above and below 400 kgs 56864
Maintaining Roll Coolant parameters
Maintaining Magnetic Seperator ON/OFF time
Reducing Leader end Generation at coating lines
Eliminating High weight leader end at coating line so as to improve HR to CR Yield
Shift Incharge
DESCRIPTION:
Coil leaderend welding to head end of HR at payoff,so that one side coil leaderend save.
List of activities to be performed by each dept.
JSW Steel Coated Products Limited,KLM
QUALITY MANAGEMENT PROGRAMME - 2020 Dept: Mill Operation
QMP/Mill/Opr/June-20/09
COMPLETION DATE Regular
 Made some QMP Programme as shown :
Step 12 : Follow Up and Review
136
Shourya
CRM Operation Training
Dept
S. No.
Name Person /
Training
Roles & responsibilities
and dept. objectives.
Significant
Environmental
aspects and
initiatives
Significant
Hazards , HIRA
and initiatives
Dept.
Statutory
requirements
Emergency
Preparedness
Energy Saving
Total Tech Training
Planned / Attended
Total
Train
ing
Hour
s
Planned(P) ,
Attended(A)
P T A AT P T A AT P T A AT P T A
A
T
P T A AT P T A AT P T A AT P
MILL 1 1 Vinesh Dwivedi 1 0.5 1 0.5 2 0.75 1 0.75 2 2 0 1 1 1 1 2 1.5 0 2 0.5 1 0.5 14 6.55 8 3.55 24
MILL 1 2 Rajeev Bhramar 1 0.5 0 2 0.75 0 2 1 1 1 1 1 0 2 1.5 0 2 0.5 0 14 6.55 12 5.55 24
MILL 1 3 K C Sharma 1 0.5 1 0.5 2 0.75 0 2 1 0 1 1 0 2 1.5 1 1.5 2 0.5 0 14 6.55 8 3.55 24
MILL 1 4 D Malviya 1 0.5 1 0.5 2 0.75 1 0.75 2 1 1 1 1 1 0 2 1.5 0 2 0.5 1 0.5 14 6.55 11 5.05 24
MILL 1 5 D Kokate 1 0.5 1 0.5 2 0.75 0 2 1 1 1 1 1 0 2 1.5 0 2 0.5 1 0.5 14 6.55 7 3.05 24
MILL 1 6 C Ucchasare 1 0.5 0 2 0.75 0 2 2 0 1 1 1 1 2 1.5 1 1.5 2 0.5 1 0.5 14 6.55 5 2.5 24
MILL 1 7 S A Choudhari 1 0.5 0 2 0.75 1 0.75 2 1 1 1 1 1 1 1 2 1.5 0 2 0.5 1 0.5 14 6.55 5 2.5 24
MILL 1 8 Ajay Yadav 1 0.5 1 0.5 2 0.75 0 2 2 0 1 1 0 2 1.5 0 2 0.5 0 14 6.55 5 2.5 24
MILL 1 9 K V Srinivas 1 0.5 1 0.5 2 0.75 0 2 1 0 1 1 1 1 2 1.5 1 1.5 2 0.5 0 14 6.55 4 1.55 24
MILL 1 10 I M Dongre 1 0.5 1 0.5 2 0.75 1 0.75 2 1 1 1 1 1 0 2 1.5 0 2 0.5 1 0.5 14 6.55 7 3.05 24
MILL 1 11 N Palade 1 0.5 0 2 0.75 0 2 1 0 1 1 1 1 2 1.5 0 2 0.5 1 0.5 14 6.55 8 3.55 24
MILL 1 12 Dheeraj Thigale 1 0.5 1 0.5 2 0.75 0 2 1 1 1 1 1 0 2 1.5 0 2 0.5 1 0.5 14 6.55 9 4.5 24
MILL 1 13 Harshal Patil 1 0.5 0 2 0.75 1 0.75 2 1 0 1 1 1 1 2 1.5 1 1.5 2 0.5 0 14 6.55 9 4.5 24
MILL 1 14 Pradeep Singh 1 0.5 1 0.5 2 0.75 0 2 1 0 1 1 1 1 2 1.5 0 2 0.5 1 0.5 14 6.55 12 5.55 24
 P- Training Planned; Training Hrs; A-Training attended; AT-Total Training Completed Hrs
Step 12 : Follow Up and Review
 Training taken of employees :
137
Shourya
Step 12 : Follow Up and Review
 Training taken of employees :
138
Shourya
Step 12 : Follow Up and Review
 We have also shown skit performance of quality circle and given safety trainings to
other employees :
Skit Performance Fire Safety Training
139
Shourya
Step 12 : Follow Up and Review
 Kaizen of our Department 140
Shourya
Step 12 : Follow Up and Review
 Appreciation Letter from our HOD 141
Shourya
SR No Activities 1 2 3 4 5 6 7 8 9 10 11 12-18 18-22 Remarks
1 Identification of Work related problems No Variation
2 Selection of Problems No variation
3 Define the Problems No variation
4 Analyze the problem
Due to absence of
members
5 Identification of causes Due to previous delay
6 Finding out the root causes Due to previous delay
7 Data analysis No variation
8 Developing solutions No variation
9 Foreseeing Probable resistance No variation
10 Trial Implementation and check performance
Delay due to
Breakdown
11 Regular Implementation No Variation
12 Follow Up/Review No variation
 Scheduled Gantt Chart :
Step 12 : Follow Up and Review
Planned May-20 Actual June-20
142
Shourya
Steps
No
Steps Details
Flow
Diagram
Brain
Storming
Data
collection
Pareto
Diagram
Cause &
Effect
Diagram
Stratification Graphs
5 W-1 H
Technique
1
Identification of Work
related problems
2 Selection of Problems
3 Define the Problems
4 Analyze the problem
5 Identification of causes
6
Finding out the root
causes
7 Data analysis
8 Developing solutions
9
Foreseeing Probable
resistance
10
Trial Implementation
and check performance
11
Regular Implementation
12 Follow Up/Review
 Tools and
Technique
Used
while
solving
problems
Step 12 : Follow Up and Review
Note :
Tools
Used
143
Shourya
 Members Views about the benefits they got from working in this quality circle:
I was totally mesmerised
by seeing how these small
tools helped us to solve this
problem so easily which
become fruitful for our
company too…
- Shraddha
The quality circle group
helped in enhancing my
presentation and
communication skills
along with managing
time.
- Rohit
I learnt a lot while making the
PPT presentation. Along with
other team members, I learnt
about time management.
- Sagar
I understood perfect meaning
of
teamwork and how to see the
problem in easy and
understandable way
- Dhanesh
I gained self confidence
and improved my
communication skills
while speaking to others
- Mahesh
Step 12 : Follow Up and Review
144
Shourya
Future Plans
1. Regular feedback and monitoring of leader End generation at Galvalume
2. Pipe line will be change for avoiding coolant leakage
3. New air wiping system will be procured for better and efficient coolant
wiping
4. New oil supplier will be chosen for better emulsion performance
Step 12 : Follow Up and Review
145
Shourya
Making Steel Is Our Profession
Generating Smile Is Our Passion…
146

More Related Content

What's hot

DMAIC Methodolgy
DMAIC MethodolgyDMAIC Methodolgy
DMAIC MethodolgyBharath M
 
Industrial Training Report on Plate Mill
Industrial Training Report on Plate MillIndustrial Training Report on Plate Mill
Industrial Training Report on Plate MillShani Kumar Singh
 
Industrial training at durgapur steel plant (instrumentation)
Industrial training at durgapur steel plant (instrumentation)Industrial training at durgapur steel plant (instrumentation)
Industrial training at durgapur steel plant (instrumentation)Chayan Sen
 
Control of Cooling in Continuous Casting of Thin Steel Slabs
Control of Cooling in Continuous Casting of Thin Steel SlabsControl of Cooling in Continuous Casting of Thin Steel Slabs
Control of Cooling in Continuous Casting of Thin Steel SlabsBishoy Saeed
 
SIX SIGMA Green Belt Training
SIX SIGMA Green Belt TrainingSIX SIGMA Green Belt Training
SIX SIGMA Green Belt Trainingchaudhryshailja
 
durgapur steel plant
 durgapur steel plant durgapur steel plant
durgapur steel plantSonu Das
 
6 sigma assignment
6 sigma assignment6 sigma assignment
6 sigma assignmentstudent
 
Operational Management in steel plant
Operational Management in steel plantOperational Management in steel plant
Operational Management in steel plantSANTOSH KUMAR
 
Injection metallurgy and lf
Injection metallurgy and lfInjection metallurgy and lf
Injection metallurgy and lfN.Prakasan
 
JSW- Steel Plant -Operation process -TMT
JSW- Steel Plant -Operation process -TMT   JSW- Steel Plant -Operation process -TMT
JSW- Steel Plant -Operation process -TMT Niraj Kumar
 
Sample project-Quality Circle
Sample project-Quality CircleSample project-Quality Circle
Sample project-Quality CircleMohamed Yusuff
 
Training report on bokaro steel plant
Training report on bokaro steel plantTraining report on bokaro steel plant
Training report on bokaro steel plantPrashant Kumar
 
6 High Reversible Cold Rolling Mill
6 High Reversible Cold Rolling Mill6 High Reversible Cold Rolling Mill
6 High Reversible Cold Rolling MillSteel Cosmos
 
Steel Melting Shop (SMS)
Steel Melting Shop (SMS)Steel Melting Shop (SMS)
Steel Melting Shop (SMS)Gautham Reddy
 

What's hot (20)

QCC Presentation
QCC PresentationQCC Presentation
QCC Presentation
 
Internal rejection
Internal rejectionInternal rejection
Internal rejection
 
Dmaic
DmaicDmaic
Dmaic
 
DMAIC Methodolgy
DMAIC MethodolgyDMAIC Methodolgy
DMAIC Methodolgy
 
Basics of Six Sigma
Basics of Six SigmaBasics of Six Sigma
Basics of Six Sigma
 
Industrial Training Report on Plate Mill
Industrial Training Report on Plate MillIndustrial Training Report on Plate Mill
Industrial Training Report on Plate Mill
 
Industrial training at durgapur steel plant (instrumentation)
Industrial training at durgapur steel plant (instrumentation)Industrial training at durgapur steel plant (instrumentation)
Industrial training at durgapur steel plant (instrumentation)
 
Control of Cooling in Continuous Casting of Thin Steel Slabs
Control of Cooling in Continuous Casting of Thin Steel SlabsControl of Cooling in Continuous Casting of Thin Steel Slabs
Control of Cooling in Continuous Casting of Thin Steel Slabs
 
SIX SIGMA Green Belt Training
SIX SIGMA Green Belt TrainingSIX SIGMA Green Belt Training
SIX SIGMA Green Belt Training
 
durgapur steel plant
 durgapur steel plant durgapur steel plant
durgapur steel plant
 
6 sigma assignment
6 sigma assignment6 sigma assignment
6 sigma assignment
 
Six sigma
Six sigmaSix sigma
Six sigma
 
Operational Management in steel plant
Operational Management in steel plantOperational Management in steel plant
Operational Management in steel plant
 
Injection metallurgy and lf
Injection metallurgy and lfInjection metallurgy and lf
Injection metallurgy and lf
 
JSW- Steel Plant -Operation process -TMT
JSW- Steel Plant -Operation process -TMT   JSW- Steel Plant -Operation process -TMT
JSW- Steel Plant -Operation process -TMT
 
Sample project-Quality Circle
Sample project-Quality CircleSample project-Quality Circle
Sample project-Quality Circle
 
Training report on bokaro steel plant
Training report on bokaro steel plantTraining report on bokaro steel plant
Training report on bokaro steel plant
 
6 High Reversible Cold Rolling Mill
6 High Reversible Cold Rolling Mill6 High Reversible Cold Rolling Mill
6 High Reversible Cold Rolling Mill
 
Failure analysis
Failure analysisFailure analysis
Failure analysis
 
Steel Melting Shop (SMS)
Steel Melting Shop (SMS)Steel Melting Shop (SMS)
Steel Melting Shop (SMS)
 

Similar to Improvement in HR to CR yield at JSW STEEL kalmeshwar

Buland Soch final 15-01-2023 NCQC Final.pptx
Buland Soch final 15-01-2023 NCQC Final.pptxBuland Soch final 15-01-2023 NCQC Final.pptx
Buland Soch final 15-01-2023 NCQC Final.pptxPradeepYadav206298
 
CBEPL Company Profile 2016
CBEPL Company Profile 2016CBEPL Company Profile 2016
CBEPL Company Profile 2016Aniruddh Ranawat
 
Ratio Analysis Project - suraj khadse
Ratio Analysis Project - suraj khadseRatio Analysis Project - suraj khadse
Ratio Analysis Project - suraj khadseSuraj Khadse
 
INDUSTRIAL ENGINEERING DESIGN PROJECT
INDUSTRIAL ENGINEERING DESIGN PROJECTINDUSTRIAL ENGINEERING DESIGN PROJECT
INDUSTRIAL ENGINEERING DESIGN PROJECTAmir Mohammad Redzuan
 
Pt. stainless steel primavalve majubersama company profile 2020
Pt. stainless steel primavalve majubersama   company profile 2020Pt. stainless steel primavalve majubersama   company profile 2020
Pt. stainless steel primavalve majubersama company profile 2020Luqman Elhanif
 
BrakesIndia_IntReport_CK_SSN_June2015
BrakesIndia_IntReport_CK_SSN_June2015BrakesIndia_IntReport_CK_SSN_June2015
BrakesIndia_IntReport_CK_SSN_June2015CHANDRA SHEKHAR KUMAR
 
Presntation (MNIT).pptx
Presntation (MNIT).pptxPresntation (MNIT).pptx
Presntation (MNIT).pptxrajtashee725
 
Project report on assessment and development centre in sail
Project report on assessment and development centre in sailProject report on assessment and development centre in sail
Project report on assessment and development centre in sailKumari Hima
 
LE - Presentation-2016
LE - Presentation-2016LE - Presentation-2016
LE - Presentation-2016sanny rana
 
Training Report on Bhushan steel private limited gzb
 Training Report on Bhushan steel private limited gzb Training Report on Bhushan steel private limited gzb
Training Report on Bhushan steel private limited gzbAnkit Gupta
 
Tatasteelfinancialanalysiswithcommentsontrendandcomparativebalanceshhet 12122...
Tatasteelfinancialanalysiswithcommentsontrendandcomparativebalanceshhet 12122...Tatasteelfinancialanalysiswithcommentsontrendandcomparativebalanceshhet 12122...
Tatasteelfinancialanalysiswithcommentsontrendandcomparativebalanceshhet 12122...Bundaran Reuk
 

Similar to Improvement in HR to CR yield at JSW STEEL kalmeshwar (20)

QC_SPARK.pptx
QC_SPARK.pptxQC_SPARK.pptx
QC_SPARK.pptx
 
Buland Soch final 15-01-2023 NCQC Final.pptx
Buland Soch final 15-01-2023 NCQC Final.pptxBuland Soch final 15-01-2023 NCQC Final.pptx
Buland Soch final 15-01-2023 NCQC Final.pptx
 
JBS Engineering, Howrah, Babbitt Metal Bearing
JBS Engineering, Howrah, Babbitt Metal BearingJBS Engineering, Howrah, Babbitt Metal Bearing
JBS Engineering, Howrah, Babbitt Metal Bearing
 
CBEPL Company Profile 2016
CBEPL Company Profile 2016CBEPL Company Profile 2016
CBEPL Company Profile 2016
 
Ratio Analysis Project - suraj khadse
Ratio Analysis Project - suraj khadseRatio Analysis Project - suraj khadse
Ratio Analysis Project - suraj khadse
 
INDUSTRIAL ENGINEERING DESIGN PROJECT
INDUSTRIAL ENGINEERING DESIGN PROJECTINDUSTRIAL ENGINEERING DESIGN PROJECT
INDUSTRIAL ENGINEERING DESIGN PROJECT
 
Pt. stainless steel primavalve majubersama company profile 2020
Pt. stainless steel primavalve majubersama   company profile 2020Pt. stainless steel primavalve majubersama   company profile 2020
Pt. stainless steel primavalve majubersama company profile 2020
 
Company Overview
Company OverviewCompany Overview
Company Overview
 
Nav Bharat Engineering Works, Ghaziabad
Nav Bharat Engineering Works, Ghaziabad Nav Bharat Engineering Works, Ghaziabad
Nav Bharat Engineering Works, Ghaziabad
 
Nav Bharat Brochure
Nav Bharat BrochureNav Bharat Brochure
Nav Bharat Brochure
 
Gkn Driveline
Gkn DrivelineGkn Driveline
Gkn Driveline
 
JSK STEELS- Press Release
JSK STEELS- Press ReleaseJSK STEELS- Press Release
JSK STEELS- Press Release
 
BrakesIndia_IntReport_CK_SSN_June2015
BrakesIndia_IntReport_CK_SSN_June2015BrakesIndia_IntReport_CK_SSN_June2015
BrakesIndia_IntReport_CK_SSN_June2015
 
Automobile components
Automobile componentsAutomobile components
Automobile components
 
Presntation (MNIT).pptx
Presntation (MNIT).pptxPresntation (MNIT).pptx
Presntation (MNIT).pptx
 
Project report on assessment and development centre in sail
Project report on assessment and development centre in sailProject report on assessment and development centre in sail
Project report on assessment and development centre in sail
 
LE - Presentation-2016
LE - Presentation-2016LE - Presentation-2016
LE - Presentation-2016
 
Training Report on Bhushan steel private limited gzb
 Training Report on Bhushan steel private limited gzb Training Report on Bhushan steel private limited gzb
Training Report on Bhushan steel private limited gzb
 
Tatasteelfinancialanalysiswithcommentsontrendandcomparativebalanceshhet 12122...
Tatasteelfinancialanalysiswithcommentsontrendandcomparativebalanceshhet 12122...Tatasteelfinancialanalysiswithcommentsontrendandcomparativebalanceshhet 12122...
Tatasteelfinancialanalysiswithcommentsontrendandcomparativebalanceshhet 12122...
 
Tatasteelfinancialanalysiswithcommentsontrendandcomparativebalanceshhet 12122...
Tatasteelfinancialanalysiswithcommentsontrendandcomparativebalanceshhet 12122...Tatasteelfinancialanalysiswithcommentsontrendandcomparativebalanceshhet 12122...
Tatasteelfinancialanalysiswithcommentsontrendandcomparativebalanceshhet 12122...
 

More from MAHESH WERULKAR

More from MAHESH WERULKAR (20)

project management HBR.pdf
project management HBR.pdfproject management HBR.pdf
project management HBR.pdf
 
ISHRAE..pdf
ISHRAE..pdfISHRAE..pdf
ISHRAE..pdf
 
elementary drg C.pdf
elementary drg C.pdfelementary drg C.pdf
elementary drg C.pdf
 
Presentation Skills Band 3.pdf
Presentation Skills Band 3.pdfPresentation Skills Band 3.pdf
Presentation Skills Band 3.pdf
 
RESUME.pdf
RESUME.pdfRESUME.pdf
RESUME.pdf
 
JSW KAIZEN Udan.pptx
JSW KAIZEN Udan.pptxJSW KAIZEN Udan.pptx
JSW KAIZEN Udan.pptx
 
Curriculum_4746_1142.pdf
Curriculum_4746_1142.pdfCurriculum_4746_1142.pdf
Curriculum_4746_1142.pdf
 
Curriculum_4746_552.pdf
Curriculum_4746_552.pdfCurriculum_4746_552.pdf
Curriculum_4746_552.pdf
 
Curriculum_4746_1147.pdf
Curriculum_4746_1147.pdfCurriculum_4746_1147.pdf
Curriculum_4746_1147.pdf
 
Curriculum_4746_216.pdf
Curriculum_4746_216.pdfCurriculum_4746_216.pdf
Curriculum_4746_216.pdf
 
Curriculum_4746_350.pdf
Curriculum_4746_350.pdfCurriculum_4746_350.pdf
Curriculum_4746_350.pdf
 
Curriculum_4746_93.pdf
Curriculum_4746_93.pdfCurriculum_4746_93.pdf
Curriculum_4746_93.pdf
 
Curriculum_4746_349.pdf
Curriculum_4746_349.pdfCurriculum_4746_349.pdf
Curriculum_4746_349.pdf
 
Curriculum_4746_223.pdf
Curriculum_4746_223.pdfCurriculum_4746_223.pdf
Curriculum_4746_223.pdf
 
Curriculum_4746_205.pdf
Curriculum_4746_205.pdfCurriculum_4746_205.pdf
Curriculum_4746_205.pdf
 
Curriculum_4746_1150.pdf
Curriculum_4746_1150.pdfCurriculum_4746_1150.pdf
Curriculum_4746_1150.pdf
 
PROpel _ Your Annual Learning Initiative.pdf
PROpel _ Your Annual Learning Initiative.pdfPROpel _ Your Annual Learning Initiative.pdf
PROpel _ Your Annual Learning Initiative.pdf
 
SAP MM.pdf
SAP MM.pdfSAP MM.pdf
SAP MM.pdf
 
Basics of Sales Order Management in Supply Chain Management
Basics of Sales Order Management in Supply Chain ManagementBasics of Sales Order Management in Supply Chain Management
Basics of Sales Order Management in Supply Chain Management
 
ICQCC 2021
ICQCC 2021ICQCC 2021
ICQCC 2021
 

Recently uploaded

result management system report for college project
result management system report for college projectresult management system report for college project
result management system report for college projectTonystark477637
 
APPLICATIONS-AC/DC DRIVES-OPERATING CHARACTERISTICS
APPLICATIONS-AC/DC DRIVES-OPERATING CHARACTERISTICSAPPLICATIONS-AC/DC DRIVES-OPERATING CHARACTERISTICS
APPLICATIONS-AC/DC DRIVES-OPERATING CHARACTERISTICSKurinjimalarL3
 
VIP Call Girls Service Hitech City Hyderabad Call +91-8250192130
VIP Call Girls Service Hitech City Hyderabad Call +91-8250192130VIP Call Girls Service Hitech City Hyderabad Call +91-8250192130
VIP Call Girls Service Hitech City Hyderabad Call +91-8250192130Suhani Kapoor
 
Call Girls in Nagpur Suman Call 7001035870 Meet With Nagpur Escorts
Call Girls in Nagpur Suman Call 7001035870 Meet With Nagpur EscortsCall Girls in Nagpur Suman Call 7001035870 Meet With Nagpur Escorts
Call Girls in Nagpur Suman Call 7001035870 Meet With Nagpur EscortsCall Girls in Nagpur High Profile
 
Top Rated Pune Call Girls Budhwar Peth ⟟ 6297143586 ⟟ Call Me For Genuine Se...
Top Rated  Pune Call Girls Budhwar Peth ⟟ 6297143586 ⟟ Call Me For Genuine Se...Top Rated  Pune Call Girls Budhwar Peth ⟟ 6297143586 ⟟ Call Me For Genuine Se...
Top Rated Pune Call Girls Budhwar Peth ⟟ 6297143586 ⟟ Call Me For Genuine Se...Call Girls in Nagpur High Profile
 
Call for Papers - Educational Administration: Theory and Practice, E-ISSN: 21...
Call for Papers - Educational Administration: Theory and Practice, E-ISSN: 21...Call for Papers - Educational Administration: Theory and Practice, E-ISSN: 21...
Call for Papers - Educational Administration: Theory and Practice, E-ISSN: 21...Christo Ananth
 
UNIT-III FMM. DIMENSIONAL ANALYSIS
UNIT-III FMM.        DIMENSIONAL ANALYSISUNIT-III FMM.        DIMENSIONAL ANALYSIS
UNIT-III FMM. DIMENSIONAL ANALYSISrknatarajan
 
Booking open Available Pune Call Girls Koregaon Park 6297143586 Call Hot Ind...
Booking open Available Pune Call Girls Koregaon Park  6297143586 Call Hot Ind...Booking open Available Pune Call Girls Koregaon Park  6297143586 Call Hot Ind...
Booking open Available Pune Call Girls Koregaon Park 6297143586 Call Hot Ind...Call Girls in Nagpur High Profile
 
The Most Attractive Pune Call Girls Manchar 8250192130 Will You Miss This Cha...
The Most Attractive Pune Call Girls Manchar 8250192130 Will You Miss This Cha...The Most Attractive Pune Call Girls Manchar 8250192130 Will You Miss This Cha...
The Most Attractive Pune Call Girls Manchar 8250192130 Will You Miss This Cha...ranjana rawat
 
Coefficient of Thermal Expansion and their Importance.pptx
Coefficient of Thermal Expansion and their Importance.pptxCoefficient of Thermal Expansion and their Importance.pptx
Coefficient of Thermal Expansion and their Importance.pptxAsutosh Ranjan
 
UNIT-II FMM-Flow Through Circular Conduits
UNIT-II FMM-Flow Through Circular ConduitsUNIT-II FMM-Flow Through Circular Conduits
UNIT-II FMM-Flow Through Circular Conduitsrknatarajan
 
OSVC_Meta-Data based Simulation Automation to overcome Verification Challenge...
OSVC_Meta-Data based Simulation Automation to overcome Verification Challenge...OSVC_Meta-Data based Simulation Automation to overcome Verification Challenge...
OSVC_Meta-Data based Simulation Automation to overcome Verification Challenge...Soham Mondal
 
Porous Ceramics seminar and technical writing
Porous Ceramics seminar and technical writingPorous Ceramics seminar and technical writing
Porous Ceramics seminar and technical writingrakeshbaidya232001
 
Call for Papers - African Journal of Biological Sciences, E-ISSN: 2663-2187, ...
Call for Papers - African Journal of Biological Sciences, E-ISSN: 2663-2187, ...Call for Papers - African Journal of Biological Sciences, E-ISSN: 2663-2187, ...
Call for Papers - African Journal of Biological Sciences, E-ISSN: 2663-2187, ...Christo Ananth
 
MANUFACTURING PROCESS-II UNIT-2 LATHE MACHINE
MANUFACTURING PROCESS-II UNIT-2 LATHE MACHINEMANUFACTURING PROCESS-II UNIT-2 LATHE MACHINE
MANUFACTURING PROCESS-II UNIT-2 LATHE MACHINESIVASHANKAR N
 
Call Girls Service Nagpur Tanvi Call 7001035870 Meet With Nagpur Escorts
Call Girls Service Nagpur Tanvi Call 7001035870 Meet With Nagpur EscortsCall Girls Service Nagpur Tanvi Call 7001035870 Meet With Nagpur Escorts
Call Girls Service Nagpur Tanvi Call 7001035870 Meet With Nagpur EscortsCall Girls in Nagpur High Profile
 
247267395-1-Symmetric-and-distributed-shared-memory-architectures-ppt (1).ppt
247267395-1-Symmetric-and-distributed-shared-memory-architectures-ppt (1).ppt247267395-1-Symmetric-and-distributed-shared-memory-architectures-ppt (1).ppt
247267395-1-Symmetric-and-distributed-shared-memory-architectures-ppt (1).pptssuser5c9d4b1
 
Structural Analysis and Design of Foundations: A Comprehensive Handbook for S...
Structural Analysis and Design of Foundations: A Comprehensive Handbook for S...Structural Analysis and Design of Foundations: A Comprehensive Handbook for S...
Structural Analysis and Design of Foundations: A Comprehensive Handbook for S...Dr.Costas Sachpazis
 
Sheet Pile Wall Design and Construction: A Practical Guide for Civil Engineer...
Sheet Pile Wall Design and Construction: A Practical Guide for Civil Engineer...Sheet Pile Wall Design and Construction: A Practical Guide for Civil Engineer...
Sheet Pile Wall Design and Construction: A Practical Guide for Civil Engineer...Dr.Costas Sachpazis
 

Recently uploaded (20)

result management system report for college project
result management system report for college projectresult management system report for college project
result management system report for college project
 
APPLICATIONS-AC/DC DRIVES-OPERATING CHARACTERISTICS
APPLICATIONS-AC/DC DRIVES-OPERATING CHARACTERISTICSAPPLICATIONS-AC/DC DRIVES-OPERATING CHARACTERISTICS
APPLICATIONS-AC/DC DRIVES-OPERATING CHARACTERISTICS
 
VIP Call Girls Service Hitech City Hyderabad Call +91-8250192130
VIP Call Girls Service Hitech City Hyderabad Call +91-8250192130VIP Call Girls Service Hitech City Hyderabad Call +91-8250192130
VIP Call Girls Service Hitech City Hyderabad Call +91-8250192130
 
Call Girls in Nagpur Suman Call 7001035870 Meet With Nagpur Escorts
Call Girls in Nagpur Suman Call 7001035870 Meet With Nagpur EscortsCall Girls in Nagpur Suman Call 7001035870 Meet With Nagpur Escorts
Call Girls in Nagpur Suman Call 7001035870 Meet With Nagpur Escorts
 
Top Rated Pune Call Girls Budhwar Peth ⟟ 6297143586 ⟟ Call Me For Genuine Se...
Top Rated  Pune Call Girls Budhwar Peth ⟟ 6297143586 ⟟ Call Me For Genuine Se...Top Rated  Pune Call Girls Budhwar Peth ⟟ 6297143586 ⟟ Call Me For Genuine Se...
Top Rated Pune Call Girls Budhwar Peth ⟟ 6297143586 ⟟ Call Me For Genuine Se...
 
Call for Papers - Educational Administration: Theory and Practice, E-ISSN: 21...
Call for Papers - Educational Administration: Theory and Practice, E-ISSN: 21...Call for Papers - Educational Administration: Theory and Practice, E-ISSN: 21...
Call for Papers - Educational Administration: Theory and Practice, E-ISSN: 21...
 
UNIT-III FMM. DIMENSIONAL ANALYSIS
UNIT-III FMM.        DIMENSIONAL ANALYSISUNIT-III FMM.        DIMENSIONAL ANALYSIS
UNIT-III FMM. DIMENSIONAL ANALYSIS
 
Booking open Available Pune Call Girls Koregaon Park 6297143586 Call Hot Ind...
Booking open Available Pune Call Girls Koregaon Park  6297143586 Call Hot Ind...Booking open Available Pune Call Girls Koregaon Park  6297143586 Call Hot Ind...
Booking open Available Pune Call Girls Koregaon Park 6297143586 Call Hot Ind...
 
The Most Attractive Pune Call Girls Manchar 8250192130 Will You Miss This Cha...
The Most Attractive Pune Call Girls Manchar 8250192130 Will You Miss This Cha...The Most Attractive Pune Call Girls Manchar 8250192130 Will You Miss This Cha...
The Most Attractive Pune Call Girls Manchar 8250192130 Will You Miss This Cha...
 
Coefficient of Thermal Expansion and their Importance.pptx
Coefficient of Thermal Expansion and their Importance.pptxCoefficient of Thermal Expansion and their Importance.pptx
Coefficient of Thermal Expansion and their Importance.pptx
 
UNIT-II FMM-Flow Through Circular Conduits
UNIT-II FMM-Flow Through Circular ConduitsUNIT-II FMM-Flow Through Circular Conduits
UNIT-II FMM-Flow Through Circular Conduits
 
OSVC_Meta-Data based Simulation Automation to overcome Verification Challenge...
OSVC_Meta-Data based Simulation Automation to overcome Verification Challenge...OSVC_Meta-Data based Simulation Automation to overcome Verification Challenge...
OSVC_Meta-Data based Simulation Automation to overcome Verification Challenge...
 
Porous Ceramics seminar and technical writing
Porous Ceramics seminar and technical writingPorous Ceramics seminar and technical writing
Porous Ceramics seminar and technical writing
 
Roadmap to Membership of RICS - Pathways and Routes
Roadmap to Membership of RICS - Pathways and RoutesRoadmap to Membership of RICS - Pathways and Routes
Roadmap to Membership of RICS - Pathways and Routes
 
Call for Papers - African Journal of Biological Sciences, E-ISSN: 2663-2187, ...
Call for Papers - African Journal of Biological Sciences, E-ISSN: 2663-2187, ...Call for Papers - African Journal of Biological Sciences, E-ISSN: 2663-2187, ...
Call for Papers - African Journal of Biological Sciences, E-ISSN: 2663-2187, ...
 
MANUFACTURING PROCESS-II UNIT-2 LATHE MACHINE
MANUFACTURING PROCESS-II UNIT-2 LATHE MACHINEMANUFACTURING PROCESS-II UNIT-2 LATHE MACHINE
MANUFACTURING PROCESS-II UNIT-2 LATHE MACHINE
 
Call Girls Service Nagpur Tanvi Call 7001035870 Meet With Nagpur Escorts
Call Girls Service Nagpur Tanvi Call 7001035870 Meet With Nagpur EscortsCall Girls Service Nagpur Tanvi Call 7001035870 Meet With Nagpur Escorts
Call Girls Service Nagpur Tanvi Call 7001035870 Meet With Nagpur Escorts
 
247267395-1-Symmetric-and-distributed-shared-memory-architectures-ppt (1).ppt
247267395-1-Symmetric-and-distributed-shared-memory-architectures-ppt (1).ppt247267395-1-Symmetric-and-distributed-shared-memory-architectures-ppt (1).ppt
247267395-1-Symmetric-and-distributed-shared-memory-architectures-ppt (1).ppt
 
Structural Analysis and Design of Foundations: A Comprehensive Handbook for S...
Structural Analysis and Design of Foundations: A Comprehensive Handbook for S...Structural Analysis and Design of Foundations: A Comprehensive Handbook for S...
Structural Analysis and Design of Foundations: A Comprehensive Handbook for S...
 
Sheet Pile Wall Design and Construction: A Practical Guide for Civil Engineer...
Sheet Pile Wall Design and Construction: A Practical Guide for Civil Engineer...Sheet Pile Wall Design and Construction: A Practical Guide for Civil Engineer...
Sheet Pile Wall Design and Construction: A Practical Guide for Civil Engineer...
 

Improvement in HR to CR yield at JSW STEEL kalmeshwar

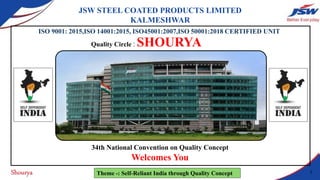
  • 1. Shourya JSW STEEL COATED PRODUCTS LIMITED KALMESHWAR ISO 9001: 2015,ISO 14001:2015, ISO45001:2007,ISO 50001:2018 CERTIFIED UNIT Quality Circle : SHOURYA 34th National Convention on Quality Concept Welcomes You Theme -: Self-Reliant India through Quality Concept 1
  • 2. Shourya SR. No DESCRIPTION Slide No 1 Introduction 6 - 16 2 Awards and CSR & Management initiatives 17 - 18 3 Introduction of Department and Quality Circle 19 - 21 4 Identification of problems 22 - 27 5 Selection of problem • Categorization in A,B,C - A,B,C Analysis • 3 – P Analysis (Ranking, weightage, Pareto Diagram) 28 – 41 6 Definition of problem • Gantt Chart • Introduction • Process Description through flow diagram • Problem Description in brief • Explanation of problem – its impact. • Setting of Objectives and Goals 42 - 59 7 Analysis of problem • Data collection 60 - 66 Index 2
  • 3. Shourya SR. No DESCRIPTION Slide No 8 Cause and Effect analysis • Affinity Diagram • Cause and effect diagram (Fish bone diagram) 67 - 70 9 Root cause analysis • Why-Why Analysis • Identification by Validation • Summary of Problem using 5 W and 1 H Analysis 71 - 84 10 Data analysis • Data Collection • Bar Graph • • Comparative study • Pie-Chart 85- 98 11 Development of solution • Development of solutions through brain storming • ICITE matrix • Time Bound and responsibility shared action Plan. 99 - 108 12 Foreseeing probable Resistance and points to overcome them 109 - 112 Index 3
  • 4. Shourya SR. No DESCRIPTION Slide No 13 Trial implementation & Check Performance • Smart Analysis • PDCA Cycle • Comparative study before QC and during trial. • Trial and Actual plan 113 - 122 14 Regular implementation • Data collection after regular implementation. • Comparative study before and after QC graphs. • Tangible and Intangible benefits 123 - 132 15 Follow up and Review and Recurrence Prevention • Check lists • Gantt chart with reason for Variation • Kaizen 133 - 146 Index 4
  • 5. Shourya SHRI O.P.JINDAL (August 7, 1930 – March 31, 2005) “ Where others saw walls, he saw doors ” Our Founder Chairman 5
  • 6. Shourya • JSW Group is a major player in steel industry amongst the leading conglomerates in India, it is a $14 billion company. It has become a single largest steel plant in India through speed and innovation in short span of time • JSW STEEL LTD. is India's leading integrated steel manufacturer with capacity of 18 MTPA • Its Key Infrastructure Sectors are : Integrated Steel Plant Downstream Plant Steel Energy Infrastructure Cement Ventures Paints Realty Introduction of JSW Steel 6
  • 7. Shourya With our strong VPV, JSW is a mark of trust and quality that millions of customers around the world depend on VISION TO BRING POSITIVE TRANSFORMATION TO EVERY LIFE WE TOUCH PURPOSE ACCELERATE THE GROWTH AND PROSPERITY OF THE COMMUNITIES WE LIVE IN BY VALUES Confidence Courage Commitment Compassion Collaboration 7
  • 8. Shourya ACHIEVEMENTS OF JSW STEEL JSW Salem Won Deming Prize in 2019 Steel Minister’s Trophy Recognized by World Steel Associations President Donald Trump Acknowledges JSW Steel’s efforts in the US CSR Award 2020 Energy Management Award 8
  • 9. Shourya Some CSR Activities  Our JSW Foundation is committed to creating more smiles at every step of the journey. The organization is in constant pursuit of making life better for communities with its various initiatives in the fields of health, education, livelihood and sports along with art and culture. 9
  • 10. Shourya 0757: Shop floor mantra for continuous improvement 10
  • 11. Shourya JSW STEEL COATED PRODUCTS, KALMESHWAR State : Maharashtra District : Nagpur Location : MIDC Area of Kalmeshwar Estb : 1st August, 1985 Area : 147 Acres No. of Employees : 680 Capacity : 0.66 Million Ton / Year Kalmeshwar 11
  • 12. Shourya HR Slitter CPL MILL-1 CGL-1 MILL-2 MILL-3 CGL-2 GALVALUME Finishing lines CCL-1/CCL-2 Dispatches HR COIL Cold Rolling Galvanizing Pickling HR Slitting CR/GP Slitting Colour Coating Overview of JSW Kalmeshwar •The first plant in India featuring the Hitachi 6 Hi cold reversing facility from Japan •A special combination to process thinner gauge and thicker gauge (Up to 3.15 mm – G/HRGI Production) •A first-of-its-kind continuous pickling Line •It manufactures licensed BIEC – a specialized Galvalume product •Its central location makes its products accessible to domestic partners across India 12
  • 13. Shourya Joint Press Pretreat ment Tanks Cold Rolling Process Color Coating Process Shear Pickling Process Galvanizing Process Uncoiler Shear Welder Wet Loop Pit Pickling Tanks Exit Looper Side Trimmer Shear Cold Rolling Mill Un coiler Shear Welder Entry Looper Furnace Zinc Pot Jet Cooling Quench Tank Skin Pass Mill cum Tension leveler Chromate Tank Exit Looper Shear Guard Film Unit Exit Loop Entry Loop Back Coater Oven Water Cooling Dryer Prime Coater Top Coater Oven Oven Process Flow 13
  • 14. Shourya Major Equipment's in Lines with there uses Acid Pickling Tank in Continuous Pickling Line (CPL) - To Remove Oxide layers. Cold Rolling Mill (CRM) - It is used to reduce thickness of Coil Cold Rolling Skin Pass Mill (SKP) – It is used to clear defects and make elongation. Zinc pot and Furnace is used in Galvanizing line (CGL-1 & 2) – Galvanizing is done to prevent the rust of coil. Color Coating Line (CCL) – It is used to coat the coil with color. Zinc pot Furnace 14
  • 15. Shourya Our Products and Esteem Customers Products Cold Rolled (CR) Color Coated Products Galvanized Galvalume Customers 15
  • 16. Shourya Applications Roofing Sheets Steel Pipes TMT Bars Stainless Steel Automobile Chequered Plates 16
  • 17. Shourya Our Credentials Sr No NATIONALAWARDS YEAR 1 The Honorable Ramkrishna Bajaj National Quality Award 2019 2 JSW Kalmeshwar is awarded with National Energy Conservation award in appreciation of efforts in energy conservation in the mini Blast Furnace Sector 2018 3 Silver certificate of merit, India Manufacturing Excellence Award 2017 Sr No STATE AWARDS YEAR 1 GHR (G H Raisoni) Award for innovative Practices in manufacturing 2019 2 Certificate of Merit at State Level Award for Energy Conservation & Management in metal & steel Sector 2017-18 3 1ST Position, Best Domestic Customer, Concor Award 2017 4 3RD Position by MEDA for Energy Conservation 2016 17
  • 18. Shourya Our Achievements Our quality circle ‘YUKTI’ have also won some CCQC and NCQC awards in 2019 We have also won CCQC Platinum Award in Nagpur Chapter 2020 18
  • 19. Shourya Our Inspiration Mr. Paresh Shah Plant Head Mr. Devendra Vaidya HOD, Operation Department Mr. Abhay Girare HOD, Business Excellence 19
  • 20. Shourya Our Team Members and Details of QC QUALITY CIRCLE NAME SHOURYA TITLE IMPROVEMENT IN HR TO CR YIELD PROJECT STARTED ON May 01, 2020 PROJECT COMPLETED ON July 20, 2020 NO. OF MEETINGS 22 ATTENDANCE 94% PERIODICITY OF MEETINGS On Every Wednesday VENUE Mill Conference Hall Sagar Patil Shraddha Chikhale Mahesh Werulkar Dhanesh Vijayan Rohit Gupta Leader Facilitator Team Member Team Member Team Member 20
  • 21. Shourya Flow of Our Presentation 12 11 10 9 8 7 6 5 4 3 2 1 Problem Identification Follow-Up / Review Categorization Problem Selection of problem Analyzing the problem Identifying the causes Finding out root cause Data analysis Developing solutions Foreseeing resistance Trial check performance Regular implementation We Followed DEMING WHEEL, PDCA 12-Step Methodology To Solve Our Problem  DEMING Wheel (PDCA 12-Step Methodology) :  Sample PDCA Model 21
  • 22. Shourya Step – 1 : Identification of Problems Tools Used : Brain Storming “All improvement happens project by project and in no other way” - Joseph M Juran 22
  • 23. Shourya Identification of Problems DESCRIPITION CATEGORY 1. Gamma ray problem B 2. High Leaderend generation A 3. High Oil Consumption A 4. Roll coolant leakage in hose pipe B 5. Frequent nozzle choking C 6. Roll lock get open during running B 7. High ph of DM water B 8. Non-availability of crane due to breakdown A 9. Roll coolant carryover B 10. High roll consumption A 11. Hydraulic leakage from bending cylinder C 12. Morg oil leakage C DESCRIPITION CATEGORY 13. Delay in SAP C 14. Thickness variation A 15. CR Sheet A 16. Delivery Tension Reel Drive Problem B 17. (Air oil) Mist Leakage B 18. Morg Oil Pressure C 19. Black surface A 20. PLC Communication error B 21.Heat exchanger problem B 22. Proximity switches malfunction B 23. WR + IMR bending Cylinder leakage A 24. Improper calibration C 25. CR baby A 26. Error in Magna Scale C 23
  • 24. Shourya DESCRIPITION CATEGORY 41. CR trimming A 42. Drives tripped B 43. HR Trimming A 44. High noise generation A 45. Gamma Ray shutter closed in running C 46. Fumes generation A 47. Slippery Area A 48. Wrinkle A 49. Alignment problem B 50. Poor shape due to buckling C 51. Coolant Contamination C 52. Width Variation A 53. Poor trimming in HR A Identification of Problems DESCRIPITION CATEGORY 27. Chattering Mark A 28. DC breaker tripping C 29. ETR Motor high temperature B 30. Gauge Reading error B 31. HMI error C 32. Level 2 PC Malfunctioning C 33. CR Arising A 34. Band Generation A 35. Ridge Formation in CR coil A 36. Rusty Patches A 37. ASD Failure B 38. EBA Failure C 39. Coolant leakages A 40. Air leakages A 24
  • 25. Shourya DESCRIPITION CATEGORY 67. Spalling of rolls A 68. Frequent tripping of crane A 69. HR end cut A 70. Sliver in HR coil A 71. Shortage of DM water A 72. HDPE liner came out from clamp B 73. Flapper guide finger issue B 74. Auxiliary tripped B 75. High DM water consumption A 76. Hydraulic leakage from main jack cylinder A 77. Oil spillage after taking out roll from mill B 78. Frequent tightening of side guide Cassette B Identification of Problems DESCRIPITION CATEGORY 54. HR side slit A 55. Miss roll generation A 56. Feeding delay in Hard Grade coil A 57. Bearing pitting mark C 58. Bearing seize problem C 59. Side guide roller change for damage B 60. HR baby A 61. High waste Oil generation A 62. CPC not available at POR B 63. Gamma ray error A 64. Skidding problem A 65. Shear non-availability at POR B 66. Tension reel fault A 25
  • 26. Shourya DESCRIPITION CATEGORY 93. Shortage of rolling oil A 94. Shortage of coil storage area A 95. Roll bite Problem C 96. Shortage of rolls A 97. Shortage of manpower A 98. Deflector roll temperature problem C 99. Side roll bearing failure B 100. Mandrel gripper failure C 101. Mandrel Bearing failure C 102. OBBS failure B 103. Wedge Display measurement problem B 104. Auto Zeroing problem A 105. Levelling problem A Identification of Problems DESCRIPITION CATEGORY 79. Scratch mark A 80. V-Notch in coils A 81. Holes in Coil A 82. BUR roll damage mark A 83. Improper coil winding A 84. OD wrap get shifted during taking out coil C 85. High power consumption C 86. Side tracking in all the lines B 87. Shearing problem C 88. Passline failure problem B 89. Failure of WR and IMR locker B 90. Pipe hose leakage C 91. Cobble guard problem C 92. Tilting problem A 26
  • 27. Shourya  So, we Identified 105 number of problems and categorized them into A, B and C category which we have explained in next step There are mainly 5 Types of Brainstorming 1. Conventional Method 2. Affinity Method 3. Idea based Method 4. KPI based method 5. Direct method For Identification of Problems, we mainly used the Conventional Method.  Brainstorming : Identification of Problems 27
  • 28. Shourya Step – 2 : Selection of Problems Tools used : ABC Analysis Pie Chart 3P Analysis Bar Graph Stacked Bar Graph Pareto Chart “It is not enough to do your best; you must know what to do, and then do your best” W. Edwards Deming 28
  • 29. Shourya Step 2 : Selection of Problem Categorization of Problem : Using ABC analysis A : Problems which can be solved within the Department B : Problems which can be solved with the help of other Department C : Problems which needs help from the Management TYPE PROBLEMS NO TOTAL PERCENTAGE A 2,3,8,10,14,15,19,23,25,27,33,34,35,3 6,39,40,41,43,44,46,47,48,52,53,54,5 5,56,60,61,63,64,66,67,68,69,70,71,7 5,76,79,80,81,82,83,92,93,94,96,97,1 04,105 51 56.67% B 1,4,6,7,9,16,17,20,21,22,29,30,37,42, 49,59,72,73,77,62,65,74,78 23 25.56% C 5,11,12,13,18,24,26,28,31,32,38,45,50 ,51,57,58 16 17.78%  After Categorization of problems into A, B and C Category, we made a pie chart 29
  • 30. Shourya Step 2 : Selection of Problem 57% 25% 18% PERCENTAGE A B C B C A • After plotting Pie Chart, we found that A Category has more number of problems with the highest percentage than other categories. • So we decided to solve this category problems first, as other categories can be controlled easily by controlling A category which posses no other serious issues.  Thus, we analyze the percentage of each category by using pie chart. Further, we use 3PAnalysis to solve A category problem. Pie Chart : 30
  • 31. Shourya 3PAnalysis to solve identified A category problems Step 2 : Selection of Problem 1st P – PROPRIETERY : (Nominal groupings) based on company’s policy and strategic planning. 2nd P – PRIORITY : Selection of one from above with specific concern of dept. On weightage system. 3rd P – PREFERENCE : Final selection of one problem from sensitive group, based on data collection. 3PAnalysis 31
  • 32. Shourya 1st P – PROPRIETERY  From brainstorming, we have identified five sensitive aspects of our work area as the proprieties of our company.  We have classified all categories of problems based on nature of work in following aspects. Proprietary Problem Nos. Total % Utilization 8,23,39,56,63,64,66,68,76,92,93,96,97,104,105 15 28.85 Material Yield 2,15,25,33,41,43,54,55,60,69,70,71,79,80,81,82,83 18 34.62 Quality 14,19,27, 34,35,36,48,52,53 9 17.31 Cost 10,3,40,61,67,75 6 11.54 Safety 44,46,47,94 4 7.69 Step 2 : Selection of Problem 32
  • 33. Shourya Step 2 : Selection of Problem 1st P – PROPRIETERY Thus, after analyzing the Proprietary, we found that ‘Material Yield’ has the higher number of percentage. So, we decided to give ranking using Priority method i.e. 2 P 0 2 4 6 8 10 12 14 16 18 20 Total Total Proprietery Proprietary Utilization Material Yield Quality Cost Safety 33
  • 34. Shourya 2nd P – PRIORITY  1 P- Proprietary grouping, further prioritized by Ranking Method using ECT technique ( ECT = Effect, Cost and Time, respectively ) Sr. No Priority Team Members Name Total Percentage Shraddha Rohit Mahesh Dhanesh Sagar 1 Utilization 3 4 3 2 4 16 21.92% 2 Material Yield 5 4 5 5 4 23 31.51% 3 Quality 4 2 1 3 3 13 17.81% 4 Cost 1 2 3 4 1 11 15.07% 5 Safety 2 1 2 2 3 10 13.70% Step 2 : Selection of Problem 34
  • 35. Shourya 2nd P – PRIORITY  In this 2 P, each member of our group gave there rankings according to the ECT. Thus, we found that Material Yield has highest percentage. So we selected Material Yield related problems to solve. Step 2 : Selection of Problem 35
  • 36. Shourya 3rd P – PREFERENCE Step 2 : Selection of Problem , Sr. No Material Yield Related Problems Effect Cost Time Total 1 High Leader end generation 5 5 4 14 2 CR Sheet 3 1 2 6 3 CR baby 2 2 1 5 4 CR Arising 1 3 3 7 5 CR trimming 5 1 2 8 6 HR Trimming 5 1 1 7 7 HR side slit 3 4 2 9 8 Miss roll generation 1 3 2 6 9 HR baby 1 1 1 3  After 2 P, we further elaborated each ‘Material Yield’ related problems which has major contribution. 36
  • 37. Shourya 3rd P – PREFERENCE Step 2 : Selection of Problem Sr. No Material Yield Related Problems Effect Cost Time Total 10 HR end cut 4 2 1 7 11 Sliver in HR coil 2 4 3 9 12 Shortage of DM water 1 3 4 8 13 Scratch mark 3 2 2 7 14 V-Notch in coils 5 1 1 7 15 Holes in Coil 1 3 2 6 16 BUR roll damage mark 3 5 1 9 17 Improper coil winding 2 4 2 8  Cont.. 37-
  • 38. Shourya 3rd P – PREFERENCE Step 2 : Selection of Problem 0 5 10 15 20 25 30 High Leader end generation CR Sheet CR baby CR Arising CR trimming HR Trimming HR side slit Miss roll generation HR baby HR end cut Sliver in HR coil Shortage of DM water Scratch mark V-Notch in coils Holes in Coil BUR roll damage mark Improper coil winding Stacked Bar Graph Effect Cost Time Total 38
  • 39. Shourya 3rd P – PREFERENCE Sr. No Material Yield Problems Diverted Qty (MT) Cumulative %Cum 1 P-2 : High Leaderend Generation 1299.3 1299.3 45.84% 2 P-15 : CR Sheet 36.6 2255.8 79.59% 3 P-25 : CR Baby coils 79.4 2378.241 83.91% 4 P-33 : CR Arising 20.8 2481.041 87.54% 5 P-41 : CR Trimming 41.7 2560.441 90.34% 6 P-43 : HR Trimming 956.5 2613.241 92.21% 7 P-54 : HR side slit 31.8 2654.941 93.68% 8 P-55 : Miss Roll generation 8.9 2691.541 94.97% 9 P-60 : HR Baby coils 11.8 2723.341 96.09% Step 2 : Selection of Problem Note : In this table, P indicates problem • After that, we also made a ‘Pareto Chart’ 39
  • 40. Shourya Sr. No Quality Related Problems Diverted Qty (MT) Cumulative %Cum 10 P-69 : HR end cut 52.8 2745.336 96.87% 11 P-70 : Sliver in HR coil 18.2 2766.136 97.60% 12 P-71 : Shortage of DM water 1.82 2784.336 98.24% 13 P-79 : Scratch Mark 122.441 2801.171 98.84% 14 P-80 : V Notch in Coils 102.8 2812.971 99.25% 15 P-81 : Holes in coil 10.43 2823.401 99.62% 16 P-82 : BUR rolls damage mark 21.995 2832.301 99.94% 17 P-83 : Improper coil winding 16.835 2834.121 100.00%  Based on the above data, we plotted a Pareto chart Step 2 : Selection of Problem  Cont.. 40
  • 41. Shourya  After Plotting and analyzing the Pareto chart we found that, P-2 has highest number of diversion. So, we selected our Problem as “Improvement In HR To CR Yield” Step 2 : Selection of Problem Vital Few Useful Many 41
  • 42. Shourya Step – 3 : Definition of Problem Tools used : Gantt Chart Flow Diagram Data Collection Clustered Graph Pie-Chart “ Quality control starts and ends with training” - Kaoru Ishikawa 42
  • 43. Shourya Step 3 : Definition of Problem  Scheduled Gantt Chart : SR No ACTIVITIES 1 2 3 4 5 6 7 8 9 10 11 12- 18 18- 22 REMARKS 1 Identification of Work related problems Planned for 1 Week 2 Selection of Problems Planned for 1 Week 3 Define the Problems Planned for 1 Week 4 Analyze the problem Planned for 1 Week 5 Identification of causes Planned for 1 Week 6 Finding out the root causes Planned for 1 Week 7 Data analysis Planned for 2 Weeks 8 Developing solutions Planned for 1 Week 9 Foreseeing Probable resistance Planned for 1 Week 10 Trial Implementation and check performance Planned for 2 Weeks 11 Regular Implementation Planned for 1 Week 12 Follow Up/Review Planned for 1 Week Team Name : SHOURYA Title : IMPROVEMENT IN HR TO CR YIELD Start Date : 1st May 2020 End Date : 20th July 2020 Leader : Shraddha Chikhale Facilitator : Rohit Gupta Members : Sagar Patil Dhanesh Vijayan Mahesh Werulkar 43
  • 44. Shourya - It is a Metal forming process in which an Ingot is passed between hard rollers to get a desired shape, thickness and surface finish. Ingot : A piece of relatively pure metal, usually metal, that is cast into a shape for further processing.  Definition of Rolling :  Cold Rolling : - If the temperature of the metal is below its recrystallization (between 400-700 °C) temperature, the process is known as cold rolling. (Advantages : Good dimensional accuracy and Surface Finish)  Reversible Rolling Mill : - A reversing mill is a rolling mill in which the work piece is passed forward and backward through a pair of rolls. The reversing mill is so named because the steel runs back and forth between the rollers, reducing the thickness incrementally with each pass. - A reversing mill can be used to reduce material to gauge. Rolling Step 3 : Definition of Problem 44
  • 45. Shourya TECHNICAL SPECIFICATIONS 1 Speed 1200 mpm 2 Input Rolling Thickness 1.2 to 6 mm 3 Output Rolling Thickness 0.13 to 3.5 mm 4 Width 500 to 1290 mm 5 Thickness control Auto gauge control 6 Flatness control Intermediate roll shifting/ roll bending 6 Hi Reversible Rolling Mill  HITACHI Cold Rolling Mill :  Grades : JDHCG04ACN JDHST29ACN JDHCG04BCN JDHST46ILZ JDHCG04B1N JDHST29DCN JDHCG06BCN JVHGLE4AS0 JDHCG04BCN JDHST46ILZ JDHSH41ALN JVHGLH4AS0 JDHCG06BCN JDHCG04ACN JDHST29ACN JVHWT02A00 JDHSH41ALN JDHCG04B1N JDHST29DCN TBLCO8  Context : - Our Plant is the first in India featuring Hitachi 6 Hi cold reversing Mill from Japan. - A Hitachi 6 Hi Cold Rolling Reversible Mill is installed for cold rolling of the pickled coils to the desired thickness as per the customers requirements. - Mill has the capacity and capability to produce cold rolled sheet of table top flatness. - Finished product of mill ( CR Coils ) are processed further in coating lines. Step 3 : Definition of Problem 45
  • 46. Shourya Step 3 : Definition of Problem DTR ETR POR Mill Stand Coil selection from plan Coil charging in POR mandrel Pass schedule preparation for selected coils Feeding of coil from POR to DTR After giving load and tension rolling start Taking out feeding coil from one side and scrap from other side Diverting / Parting of Coil Send to Next Process Salvage Quality Check  Basic Layout of 6 HI Mill :  Process Description of Mill through Flow Chart : Delivery Tension Reel Entry Tension Reel Pay Off Reel 46
  • 47. Shourya Step 3 : Definition of Problem Loading of coil on entry skid Putting of coil on pay off reel Removing of coil Output product of mill Rolling of coil to get specified thickness Scheduling (as per plan) Rolling process of 6HI mill Feeding of 1st pass Note : Here we have shown pictorial representation of our Mill 47
  • 48. Shourya Supplier Input CPL HR Coil Width Range : 700-1270 mm Thickness : 1.6 – 4.5 mm Coil – Inner/Outer Dia : Coil Weight : 25 Ton (Max) Utility DM Water Ph : 5.5 - 6.5 Conductivity : 10 (Max) MSEB Power Bao Steel, Bajrang Steel, GPI, Sino steel, Superior Forge, Union Electric. Rolls Houghton, Witmans Advanced Fluid Rolling Oil Process Output Customer 6HI CRM - 1 (HITACHI) Max. Mill Speed 1200 MPM CR Coil Thickness: 0.12 mm – 3.0 mm Width range: 700 –1270 mm Coil – Inner/Outer dia: 508/1850 Coil wt: 25 Ton (Max) CR Leader end: upto 400 Kg CR Baby: 500 Kg < Wt< 2000 Kg HR Baby: 500 Kg < Wt< 2000 Kg Galvalume CCL CGL Step 3 : Definition of Problem  Mill Processing Details : 48
  • 49. Shourya  Generation of Leader End at Mill : - In Reversible Mill, CR coils are finalized either at DTR side or ETR Side and Leader End generate at the opposite end of the final product. - Also, in ID there is leader end which goes with CR coil to further processing lines i.e., CGL1, CGL2 and Galva. - At these lines, leader end at the ID gets cut for reducing the stoppage of lines. - These cut portion i.e., leader end at Mill and coating lines directly impacts to yield which is a direct loss to our company. Step 3 : Definition of Problem Leader End Finished CR Coil Unrolled Part ( Roll bite to Mandrel) 49
  • 50. Shourya Step 3 : Definition of Problem  What is Leader End ? - It is an unrolled portion of coil which is generated in Reversible Cold Rolling Mill.  How Leader End is generated in Mill ? - While processing the HR coil from POR to DTR, some unrolled HR is left in ID due to process limitation, as end to end rolling is not possible in cold reversible mill  Why unrolled portion in ID ? - End of HR coil is gripped in gripper and 1.5 wraps (min) is taken in mandrel also Length of material from mandrel to roll bite is not processed in gauge required. - This unrolled portion of HR in ID,  provides base for coil build up  prevents coil from collapse  How Leader End is generated in processing lines ? - Galvanizing lines are continuous processing lines, and they process only prime material which is as per gauge and shape requirement. As there is HR and off gauge in ID of CR coils, which is sent from cold rolling mills, so this material in ID is parted and removed. Leader End 50
  • 51. Shourya Step 3 : Definition of Problem Here we shown how leader end is generated at galvalume line due to black patches 51
  • 52. Shourya  Why Leader End generation is high? - The norms which are set to cut the Leader End is 400 kg. - But if some problems are identified prior to HR wraps, then operator cut this portion so as to avoid the line stoppage. - This portion of coil which they cut sometimes come more than 400 kg - So this higher weight of Leader End becomes direct loss to our company and ultimately affects the yield.  List of problems which are identified prior to HR wraps, resulted in high Leader End generation : HR in ID Off- Gauge Buckling Step 3 : Definition of Problem 52
  • 53. Shourya Black Patches Edge Waviness Description Norms % Percentage of Leader Ends Leader End Mill 1.1% 1.15 % Leader End (CGL1) 2.0% 2.02 % Leader End (CGL 2) 2.0% 2.08 % Leader End (Galva) 2.0% 2.42 %  Percentage of Leader Ends at various Lines due to above problems which are below 400 kg are :  From the table drawn, it is found that Percentage of Leader End at Galva is more than its norms i.e., 2.42 % which is much more higher than other lines.  Due to this higher Leader End, delay and division takes place in lines.  So to avoid this, we first calculated the number of coils which are diverted due to the above problems in each month since the problem started. Edge Damage Step 3 : Definition of Problem 53
  • 54. Shourya  Diversion Quantities in galvalume month wise : Problems Dec 19 (MT) Jan 20 (MT) Feb 20 (MT) Mar 20 (MT) Apr 20 (MT) Grand Total MT Percentage HR in ID 1.2 0.84 2.13 1.86 0 6.03 3.79% Off -Gauge 3.2 0.98 1.415 0.84 0 6.435 4.05% Buckling 8.72 5.48 3.68 4.89 0 22.77 14.33% Black Patches 36.41 11.73 20.32 10.625 0 79.085 49.77% Edge Crack 4.115 10.739 5.82 0.88 0 21.554 13.56% Edge Waviness 12.19 5.99 3.26 1.59 0 23.03 14.49%  Further we have also shown quality assurance report where we have identified more number of problems from other coating lines. Step 3 : Definition of Problem 54
  • 55. Shourya Step 3 : Definition of Problem We are getting this Quality Assurance report from quality dept. where the problems of all the processing lines are shown Quality Assurance Report :  To further elaborate this, we made a Clustered Chart and Pie Chart for proper detail clarification so as to get which problem has higher impact and affecting to it; which results in high Leader End. 55
  • 56. Shourya 5% 6% 11% 52% 13% 13% Percentage HR in ID Off-Guage Buckling Black Patches Edge Crack Edge Waviness - From Pie Chart we found that, Black Patches have highest number of diversion percentage i.e. 52 % - It is much more higher than other problems. - It is accountable for the major problematic part of yield loss. - Further, we also made graph related to diversion as shown in next slide. 0 50 100 150 200 HR in ID Off-Guage Buckling Black Patches Edge Crack Edge Waviness Percentage - With the help of this Clustered Chart we found that, Black Patches contribute major in all problems. - It has total of 161.41 Qty (MT) of Diverted coils Step 3 : Definition of Problem 23.03 21.554 79.085 22.77 6.435 6.03 56
  • 57. Shourya Step 3 : Definition of Problem  Emails from the coating lines expressing their concerns and disappointment regarding their issues 57
  • 58. Shourya Step 3 : Definition of Problem System generated yield report is shown above 58
  • 59. Shourya Impact of Problem : Improvement in HR to CR yield due to Black Patches Quality Related Production Related Internal Customer Complaint Increases by 0.42% Production Yield Reduced by 2.42 % Delay time Increases by 4 hr /month Utilization Decreases by 0.5% per month Diversion Increases by 0.6% per month Goals and Objectives of our QC are : Step 3 : Definition of Problem Goal: To Improve HR to CR yield from 2.42% To 2%. Objective: 1. To reduce leader end generation at coating lines 2. To reduce diversion 3. To increase mill utilization by avoiding delays for coolant leakage arresting 4. To provide good CR coils to further processing line by reducing Black Patches 5. To maintain roll coolant parameters within norms 59
  • 60. Shourya Step – 4 : Analysis of Problem Tools used : Data Collection “It is only the last turn of a bolt that tightens it; the rest is just movement” -Shigeo Shingo 60
  • 61. Shourya  First we gathered the data of particular coils from Galvalume Line : NNote : Leader Ends are also known as Coil Ends Step 4 : Analysis of Problem Coil End Report (Galva) : 61
  • 62. Shourya  After that we segregated the Black patches coils having Leader Ends above and below 400 kg using Pivot Table; of Mill and Galvalume Line of each month as shown below : Cum till June Galva Incharge Below 250 Kg 251-300 Kg 301-350 Kg 351-400 Kg 401-450 Kg 451-500 Kg 501-1000 Kg Above 1000 Kg Grand Total Kg ANKIT 1 31 63 82 48 19 47 1 292 DHIRENDER 33 68 36 34 12 18 1 202 GANESH 1 8 22 22 23 12 11 13 112 JITENDRA 3 13 24 36 18 4 13 111 KUMRAWAT 1 1 3 1 4 10 TASLIM 1 24 65 53 48 19 18 1 229 Grand Total 7 109 242 230 174 67 111 16 956 Percentage 0.73% 11.40% 25.31% 24.06% 18.20% 7.01% 11.61% 1.67% 100.00% 61.51% 38.49% Note : Here we have shown only a sample of June, 2020 Pain area, 38% to be reduced to 20% Step 4 : Analysis of Problem No of Coils 62
  • 63. Shourya Step 4 : Analysis of Problem Cum till June Galva Incharge Below 250 Kg 251-300 Kg 301-350 Kg 351-400 Kg 401-450 Kg 451-500 Kg 501-1000 Kg Above 1000 Kg Grand Total Kg ANKIT 1 31 63 82 48 19 47 1 292 DHIRENDER 33 68 36 34 12 18 1 202 GANESH 1 8 22 22 23 12 11 13 112 JITENDRA 3 13 24 36 18 4 13 111 KUMRAWAT 1 1 3 1 4 10 TASLIM 1 24 65 53 48 19 18 1 229 Grand Total 7 109 242 230 174 67 111 16 956 Percentage 0.73% 11.40% 25.31% 24.06% 18.20% 7.01% 11.61% 1.67% 100.00% 61.51% 38.49%  Our main concern area is coil ends above 400kg  So we have collected the data of coil end above 400 kg (<400 kg) affected due to black patches as shown in our next slide. 63
  • 64. Shourya  Data of Coil Ends above 400 Kg DATE SHIFT CR BATCH CR THK (MM) CR WIDTH (MM) CR WT (MT) COIL END WT (MT) REASON FOR COIL END GENERATION 10.07.2020 C KM2A0G0322 0.306 1220 20.06 0.46 HR AND BLACK PATCH 10.07.2020 C KM1A0G0299 0.406 1220 20.02 0.67 Loose shape/CB/Shifting 10.07.2020 C KM1A0G0298 0.406 1220 19.95 0.4 HR AND BLACK PATCH 10.07.2020 C KM1A0G0297 0.406 1220 20.15 0.8 Loose shape/CB/Shifting 10.07.2020 C KM2A0G0326 0.406 1220 20.2 0.45 HR AND BLACK PATCH 11.07.2020 A KM2A0G0327 0.406 1220 19.82 0.41 HR AND BLACK PATCH 11.07.2020 A KM1A0G0305 0.478 1220 24.75 0.46 HR AND BLACK PATCH 11.07.2020 B KM1A0G0270 0.444 1220 12.61 0.58 Loose shape/CB/Shifting 11.07.2020 B KM1A0G0314 0.406 1220 20.1 0.44 HR 11.07.2020 B KM2A0G0346 0.312 1220 20.2 0.45 HR 11.07.2020 B KM2A0G0344 0.306 1220 20.31 0.47 HR 12.07.2020 A KM1A0G0325 0.362 1220 19.86 0.46 HR AND BLACK PATCH 12.07.2020 A KM1A0G0333 0.462 1220 22.03 0.44 HR AND BLACK PATCH 12.07.2020 A KM2A0G0365 0.462 1220 20 0.53 LOOSE SHAPE,SHIFTING D/S Step 4 : Analysis of Problem 64
  • 65. Shourya  Also checked all Roll Coolant parameters of Oil Shift Wise Norms A B C 6 Hi (M1) (WITMA NS LUBRO DL 603) Total Oil (%) 2.00 - 3.50 2.89 2.20 2.09 Scum (%) 1.00 (Max) 0.30 0.20 0.16 Iron (ppm) 400 (Max) 346 389 249 pH 5.50 - 6.50 5.96 6.42 5.39 Conductivity (μs/cm) 300 (Max) 196 223 223  Checked Emulsion of oil : Whitman OIL Line Parameters checked Requirements Results 6 HI (M1) Chloride (PPM) 60 Max. 54.00 Sap value (mg KOH/gm) 180 Min. 179.26 Acid value(mg KOH/gm) 30 Max. 29.41 Active oil % 85 Min. 81.565 Tramp oil % 15 Max. 9.85  We collected Shift wise data and found from the above Roll Coolant Parameters of Oil and Emulsion of Oil that it has no such significant effect to our problem. As all are in the required range of targeted norms. Step 4 : Analysis of Problem 65
  • 66. Shourya Checked some Components of our Mill : 1. We have also taken some planned shutdown to analyze whether there is Maintenance related problems or not. 2. Thus, we checked each and every component of our mill which may directly effects to Black Patches and increases our Leader Ends. 3. Following are the job list which we checked while shutdown : • Roll Coolant Nozzle • Roll Coolant Pipe / Hose Leakage • Effectiveness of Air Wiper system for Coolant removal from strip • Dripping of accumulated coolant over strip in running • Effectiveness of fume exhaust system to check dripping of condensate fumes • Roll coolant header (cobble guard) condition for any leakage and puncture • Scope of extra air wiping system Step 4 : Analysis of Problem 66
  • 67. Shourya Step – 5 : Identification Of Causes Tools used : Affinity Diagram Fish-Bone Diagram “Having no problem is the biggest problem of all” -Taichi Onho 67
  • 68. Shourya By Brainstorming Method, we listed out all various probable causes. And by using this probable causes, we mapped Affinity Diagram. MAN METHOD MATERIAL MACHINE • Unskilled Operator • Improper Knowledge • Low Observation Skills • SOP not followed • Coolant Parameters not maintained • SOP Not followed • Wiping Nozzle not operated at the right time • Coolant Parameters not maintained • Roll coolant level not maintained • Improper Pickling • Line Speed variation • Rolling oil quality not adequate • Improper pH of DM water • Acid carryover in HR coil • Improper pH of roll coolant • Poor anti staining quality of emulsion • Inadequate Pneumatic system Pressure • Coolant leakage in system • Gap between air wiping knife not properly set • Insufficient time lag for auto coolant blow off Step 5 : Identification of Causes 68
  • 69. Shourya Step 5 : Identification of Causes Fishbone  After listing out probable causes, we made FISHBONE Diagram for further analysis (Cost and Effect Diagram) Brainstorming 69
  • 70. Shourya Step 5 : Identification of Causes Improvement in HR to Cr Yield MAN MACHINE METHOD MATERIAL Unskilled Operator Coolant Parameters not maintained Low Observation Skills SOP not followed Improper Knowledge Roll coolant level not maintained SOP Not followed Wiping Nozzle not operated at the right time Improper Pickling Line Speed variation Rolling oil quality not adequate Poor anti staining quality of emulsion Acid carryover in HR coil Improper pH of roll coolant Improper pH of DM water Inadequate Pneumatic system Pressure Insufficient time lag for auto coolant blow off Coolant leakage in system Gap between air wiping knife not properly set FISHBONE Diagram (Cost and Effect Diagram) : Note : Black = Causes ; Yellow = Sub Causes 70
  • 71. Shourya Step – 6 : Root Cause Analysis Tools used : WHY-WHY Analysis FISH-BONE Analysis 5W-1H Technique “It is not enough to do your best; you must know what to do, and then do your best” -W. Edwards Deming 71
  • 72. Shourya  WHY-WHYAnalysis of valid root causes Identification of man related causes Man related Cause Remarks Significant Unskilled Operator Training to be given to operators Significant Improper Knowledge Some workers don’t have deep knowledge Non Significant Low Observation Skills Training to be given to operators Non Significant SOP not followed Not aware of importance of SOP compliance Non Significant Coolant Parameters not maintained Not following SOP for maintaining and monitoring of roll coolant parameters Significant Step 6 : Root Cause Analysis 72
  • 73. Shourya Step 6 : Root Cause Analysis Man Related causes : Identification of man related causes Man related Cause Remarks Significant Unskilled Operator Training to be given to operators Significant Coolant Parameters not maintained Not following SOP for maintaining and monitoring of roll coolant parameters Significant 73
  • 74. Shourya Identification of material related causes Material related Cause Remarks Significant Rolling oil quality not adequate Complaint to be raised of supplier Non Significant Poor anti staining quality of emulsion Complaint to be raised of supplier to provide better anti staining property of emulsion Non Significant Improper pH of roll coolant Pickling quality to be improved Significant Acid carryover in HR coil SOP to be updated to improve pickling quality Non Significant Improper pH of DM water DM water pH to be monitored and immediate action to be taken in case of any deviation Non Significant Step 6 : Root Cause Analysis 74
  • 75. Shourya Step 6 : Root Cause Analysis Material Related causes : Identification of material related causes Material related Cause Remarks Significant Improper pH of roll coolant Pickling quality to be improved Significant 75
  • 76. Shourya Identification of machine related causes Machine related Cause Remarks Significant Inadequate Pneumatic system Pressure Air pressure to be monitored and maintained regularly Significant Insufficient time lag for auto coolant blow off Coolant blow off time to be increased from 20 sec to 30 sec Significant Gap between air wiping knife not properly set Gap between air knife slit to be checked and maintained on regular basis Significant Coolant leakage in system Coolant leakage to be arrested immediately Significant Aging of equipment New wiping system to be procured New pipe line to be installed Non significant Machine Mill Photo Step 6 : Root Cause Analysis 76
  • 77. Shourya Step 6 : Root Cause Analysis Machine Related causes : Identification of machine related causes Machine related Cause Remarks Significant Inadequate Pneumatic system Pressure Air pressure to be monitored and maintained regularly Significant Insufficient time lag for auto coolant blow off Coolant blow off time to be increased from 20 sec to 30 sec Significant Gap between air wiping knife not properly set Gap between air knife slit to be checked and maintained on regular basis Significant Coolant leakage in system Coolant leakage to be arrested immediately Significant 77
  • 78. Shourya Identification of Method related causes Method Cause Remarks Significant SOP Not followed Not aware of importance of SOP compliance Non significant Line stoppage Line stoppage will cause more black patch generation Non significant Improper Pickling Pickling quality to be improved Non significant Roll coolant level not maintained Not effective Non significant Wiping Nozzle not operated at the right time Training to be given to operators for timely operation of air wiping nozzle Significant Step 6 : Root Cause Analysis 78
  • 79. Shourya Step 6 : Root Cause Analysis Method Related causes : Identification of Method related causes Method Cause Remarks Significant Wiping Nozzle not operated at the right time Training to be given to operators for timely operation of air wiping nozzle Significant 79
  • 80. Shourya  List of Significant Causes : Sr. No Category Significant Causes 1 Man Unskilled Operator Coolant Parameters not maintained 2 Method Wiping Nozzle not operated at the right time 3 Machine Inadequate Pneumatic system Pressure Insufficient time lag for auto coolant blow off Gap between air wiping knife not properly set Coolant leakage in system 4 Material Rolling oil quality not adequate Acid carryover in HR coil  Man Related causes : WHY ? WHY ? VALID Unskilled Operator Lack of basic Knowledge Lack of Training Proper Training given related to the production Need for training not identified N WHY ?  WHY-WHYAnalysis of valid root causes Man Method Machine Material Man Method Machine Material Step 6 : Root Cause Analysis Note : Green = Valid ; Black = Invalid 80
  • 81. Shourya  WHY-WHYAnalysis of valid root causes Coolant Parameters not maintained Lack of knowledge about parameters Lack of Training Proper Training given related to maintaining of coolant parameters  Man Related causes : Wiping Nozzle not operated at the right time - Valve malfunctioning - Wiping nozzles not operated on time Malfunctioning of FRL Unit Debris in Air Training to be given to operators for timely operation of air wiping nozzle  Method Related causes : WHY ? WHY ? WHY ? WHY ? WHY ? VALID N VALID N Air leakages in pipe Air pressure to be monitored and maintained regularly Pipeline Erosion Inadequate Pneumatic system Pressure Erosive Environment Ageing of pipeline WHY ? WHY ? WHY ? VALID N  Machine Related causes : Step 6 : Root Cause Analysis Note : Green = Valid ; Black = Invalid 81
  • 82. Shourya Gap between air wiping knife not properly set - Due to shearing of bolts - Scum stuck between it Impact from strip breakage Gap between air knife slit to be checked and maintained on regular basis As per planned maintenance gap not checked Ageing factor Coolant leakage in system Hose and pipe Ageing factor Pipeline erode Vibration in pipeline Not done proper clamping Coolant leakage to be arrested immediately WHY WHY ? WHY ? VALID N VALID N WHY ? WHY ? WHY ? WHY ?  Machine Related causes :  Material related causes : Inappropriate rolling oil properties Required norms not maintained by supplier Complaint to be raised to supplier Inadequate quality of rolling oil WHY ? WHY ? VALID N Acid carryover in HR coil Squeeze rolls damaged Lack of inspection procedure SOP to be updated to improve pickling quality WHY ? WHY ? VALID N Step 6 : Root Cause Analysis Note : Green = Valid ; Black = Invalid 82
  • 83. Shourya Improvement in HR to Cr Yield MAN MACHINE METHOD MATERIAL Unskilled Operator Coolant Parameters not maintained Low Observation Skills SOP not followed Improper Knowledge Roll coolant level not maintained SOP Not followed Wiping Nozzle not operated at the right time Improper Pickling Line Speed variation Rolling oil quality not adequate Poor anti staining quality of emulsion Acid carryover in HR coil Improper pH of roll coolant Improper pH of DM water Inadequate Pneumatic system Pressure Insufficient time lag for auto coolant blow off Coolant leakage in system Gap between air wiping knife not properly set Note : Black = Causes ; Yellow = Sub Causes  After listing out probable causes, we made FISHBONE Diagram for further analysis (Cost and Effect Diagram) Step 6 : Root Cause Analysis 83
  • 84. Shourya Questions Analysis What is the situation? High weight leader end due to black patches Where is the problem? At coating lines which is next process after rolling When does it occur? Due to heavy coolant carryover Which factors get affected? Production and power consumption Why does it happen? Coolant leakage at mill from coolant hoses How does it happen? Blackish patches are generated in coil when coolant get dried over sheet  5W-1H Analysis : ( What, Where, When, Which, Why-How ) 5W & 1H Analysis What When Why How Where Which Step 6 : Root Cause Analysis 84
  • 85. Shourya Step – 7 : Data Analysis On Causes Tools used : Data collection Bar-Graph Comparative Study Stratification Graph Pie - Chart “Without a standard there is no logical basis for making decisions or taking decisions” -Joesph M Juran 85
  • 86. Shourya 0 100 200 300 400 500 600 700 2020.02.01 2020.02.03 2020.02.05 2020.02.07 2020.02.09 2020.02.11 2020.02.13 2020.02.15 2020.02.17 2020.02.19 2020.02.21 2020.02.23 2020.02.25 2020.02.27 2020.02.29 Feb-20 (Liters/Day)  Oil Consumption Trend : 1. From the above graphs , It is inferred that our consumption was initially at higher side (Nov-19 to Feb-20) than its expected norms (7500 Ltr per Month) as shown. 2. In the month of Feb-20, the range is much more higher. So we collected the Feb-20 day wise data and observed that ‘The Coolant Parameters’ were not within our Range. So further we studied Coolant Parameters. TGT -250 Ltr/Day  Observations and Findings : Step 7 : Data Analysis on causes 7206 8536 7956 9115 8413 0 8589 0 1000 2000 3000 4000 5000 6000 7000 8000 9000 10000 Nov, 19 Dec, 19 Jan, 20 Feb, 20 Mar, 20 Apr, 20 May, 20 Litres Month Oil Consumption (Litres/Month) Lockdown Target (7500Ltr/Day) 86
  • 87. Shourya Step 7 : Data Analysis on causes Oil Consumption Trend in the month of February DM Board of Oil Consumption Here as we see, trend in the month of Feb is much more higher than its norms i.e., above 0.5 L/T Higher Range  We have also Collected data of oil concentration in Lit/Ton 87
  • 88. Shourya 0 0.5 1 1.5 2 2.5 3 3.5 4 Concentration % (Feb-20)  Coolant parameters : Oil Concentration - From the above graph as shown, after studying The Coolant parameters it is found that we are not getting required Oil Concentration. Expected range - 2.00% to 3.50% Actual range – Below 2.00% Note : Here we have shown the data of feb-20, as the oil concentration was too less as compared to other month TGT – 2 to 3.5%  Observations and Findings : Step 7 : Data Analysis on causes 1.75% 1.80% 2.00% 1.40% 1.68% 0.00% 1.88% 0.00% 0.50% 1.00% 1.50% 2.00% 2.50% 3.00% 3.50% 4.00% 4.50% Nov, 19 Dec, 19 Jan, 20 Feb, 20 Mar, 20 Apr, 20 May, 20 Conc. % Month Oil Concentration % ( Month Wise) Target (2.0 to 3.5%) Lockdown 88
  • 89. Shourya  Coolant parameters : pH Concentration - From the above graph as shown, after studying The Coolant parameters it is found that we are not getting required Oil Concentration. Expected range - 5.50 to 6.50 Actual range – Below 5.50 Note : Here we have shown the data of feb-20, as the pH level was too less as compared to other month 0 0.5 1 1.5 2 2.5 3 3.5 4 4.5 5 5.5 6 6.5 7 7.5 pH Level TGT – 5.5 to 6.5  Observations and Findings : Step 7 : Data Analysis on causes 4.67 4.9 5 2.89 4.89 0 5.1 0 0.5 1 1.5 2 2.5 3 3.5 4 4.5 5 5.5 6 6.5 7 7.5 Nov, 19 Dec, 19 Jan, 20 Feb, 20 Mar, 20 Apr, 20 May, 20 pH Level Month pH range (5.5-6.5) Target (5.50 to 6.50) Lockdown 89
  • 90. Shourya 0 100 200 300 400 500 600 700 800 900 1000 Fe concentration (PPM) - From the above graph as shown, after studying The Coolant parameters it is found that we are not getting required Iron Content. Expected range – Below 400 (PPM) Actual range – Above 400 (PPM) Note : Here we have shown the data of feb-20, as the Iron content was too high as compared to other month  Coolant parameters : Iron Content  Observations and Findings : TGT – Below 400 PPM Step 7 : Data Analysis on causes 600 589 542 789 550 0 643 0 100 200 300 400 500 600 700 800 900 Nov, 19 Dec, 19 Jan, 20 Feb, 20 Mar, 20 Apr, 20 May, 20 Iron Content Month Iron Content (PPM) Target (Below 400 PPM) Lockdown 90
  • 91. Shourya Step 7 : Data Analysis on causes Here as we see, Process Parameters in the month of Feb of our DM Board Higher Range DM Board of Process parameters Oil Iron Content PH 91
  • 92. Shourya - To check whether wiping nozzle (Air Knife) is impacting or not to Black Patches, we have performed following activities during our Planned Shutdown. Sr. No Activities Observation Remarks 1 Pneumatic valve checked All valves are ok and in working Condition No Impact 2 Pressure of Pneumatic system Checked Pressure is ok (5 to 6 kg / cm² ) No Impact 3 Checked Condition of FRL unit All three filters, regulator and lubricator are functioning good and OK No Impact 4 Dry air at Line calculated No moisture contained in line and air is suitable for working condition No Impact 5 Air Knife gap checked Gap Checked with filler gauge and Found equal throughout its length No Impact 6 Blow OFF time Checked Blow OFF time : 20 sec i.e., OK No Impact Step 7 : Data Analysis on causes  Malfunctioning of Wiping Nozzle : Note : From the above data, we found that there were no problems contributing to Black Patches 92
  • 93. Shourya Step 7 : Data Analysis on causes Air Knife gap checked Pneumatic valve checked Checked FRL unit Pressure of Pneumatic system Checked  Above are the images that we have checked related to the Malfunctioning of Wiping Nozzle in system but NO IMPACT was found due to it 93
  • 94. Shourya SR. NO ACTIVITIES OBSERVATION REMARKS 1 Coolant nozzle header in cobble guard checked No leakage found in cobble guard nozzle No impact 2 Coolant leakage from pipe line checked No leakage found in coolant pipe line No impact 3 Coolant leakage from strip coolant header checked No leakage found in strip coolant header No impact 4 Inspection done for coolant accumulated in gamma ray runner Gamma ray runner found free from accumulated coolant No impact  Coolant leakages in system : Note : From the above data, no impact was found in ‘Black Patches’ - To check whether Coolant leakages is impacting or not to Black Patches, we have performed following activities during our Planned Shutdown. Step 7 : Data Analysis on causes 94
  • 95. Shourya Step 7 : Data Analysis on causes  Above are the images that we have checked related to the coolant leakages in system but NO IMPACT was found due to it  So we have not found any impact of above activities (Wiping Nozzle and Coolant Leakages) on our issue (i.e., Black Patches), so the issue has not been taken into the account. Coolant leakage from Pipe Line checked Coolant nozzle header in Cobble Guard checked Checked coolant accumulation in Gamma Ray Unit 95
  • 96. Shourya Step 7 : Data Analysis on causes Data Analysis on Root Causes for Validation Month Coolant parameters Wiping Nozzle mal- functioning Coolant leakages in system Total Nov-20 2 0.5 1.8 4.3 Dec-20 1.8 1.23 0.1 3.13 Jan-20 4 0.68 0.32 5 Feb-20 3.7 1.67 0.2 5.57 Mar-20 6.1 1.1 1.84 9.04 Apr-20 0 0 0 0 Total 17.6 5.18 4.26 96
  • 97. Shourya Step 7 : Data Analysis on causes Data Analysis on Root Causes for Validation 0 2 4 6 8 10 12 14 16 18 Coolant parameters Wiping Nozzle mal-functioning Coolant leakages in system No of times it affected Root Causes Nov-20 Dec-20 Jan-20 Feb-20 Mar-20 Apr-20 Note : Stratification graph shows that, Coolant Parameters are major reason behind the Black patches 97
  • 98. Shourya 95.36% 2.12% 2.52% Impact in % Coolant parameters Wiping Nozzle malfunctioning Coolant Leakages in system Also, From the pie-chart as shown, contribution of each affecting factors, i.e., 1. Coolant parameters : 95.36% 2. Wiping nozzle malfunctioning : 2.52% 3. Coolant leakages in system : 2.12% As the coolant parameters are playing major role in generation of black patches. So we have focused mainly on Coolant Parameters Step 7 : Data Analysis on causes 98
  • 99. Shourya Step – 8 : Development of solutions Tools used : Brain-Storming ICTIE Matrix Responsibility Chart “The starting point for improvement is to recognize the need” - Masaaki Imai 99
  • 100. Shourya  For Developing solutions, we used Brainstorming Method and we got simple ideas to overcome this Problem. SR. NO. POSSIBLE SOLUTIONS 1. Addition of emulsifier (WA10382) to improve oil concentration 2. Mixing of pH booster (WA10128) 3. Change of magnetic separator cycle time (ON/OFF) . 4. pH of DM water should be maintained 5. Additives of oil to be maintained 6. Controlled rate of oil addition for reducing oil consumption 7. Scum generation to be minimised with regular skimming 8. Synthetic oil to be used Step 08 : Development of Solutions We used ‘Brainstorming’ technique with our Associates to find out possible solutions 100
  • 101. Shourya SR. NO. POSSIBLE SOLUTIONS REMARKS 1. Addition of emulsifier to improve oil concentration • Standard quality of emulsifier to be used. • It helps to mix oil and water easily to boost oil concentration • At our Mill, we used WA10382 emulsifier to get required coolant concentration 2. Scum generation to be minimised with regular skimming • Regular skimming is not possible due to limited capacity of sump pit • During production, continuous waste generation takes place due to which sump pit already gets occupied • As it takes more time to separate oil and water at ZLD ( Zero Liquid Discharge ), so draining is not possible at fixed interval Step 08 : Development of Solutions Sump Pit 101
  • 102. Shourya SR. NO. POSSIBLE SOLUTIONS REMARKS 3. Change of magnetic separator cycle time (ON/OFF) . • Proper (ON/OFF) cycle to be maintained to remove Fe at control rate. • Earlier the cycle timing was 10/40 min, but it causes loss of oil along with iron. • So we reduced cycle time to 5/30 min which helps us to remove iron at controlled rate 4. pH of DM water should be maintained • By Maintaining DM water in range, we get proper pH of emulsion • Previous we were getting low pH of DM water due to which coolant pH maintaining was not possible. • pH Buffer is also added to maintain the pH of DM water in required range Step 08 : Development of Solutions 102
  • 103. Shourya SR. NO. POSSIBLE SOLUTIONS REMARKS 5. Synthetic oil to be used • Using this oil, we get proper oil concentration with low oil consumption. • Not possible as it is costlier • Mill condition is not suitable for using this oil 6 Controlled rate of oil addition for reducing oil consumption • We have made pan for 30 L capacity with stopper at oil top up area, consumption of oil can be easily controlled • Earlier we were adding approximate oil without any measured instrument, resulting in more addition of oil than its required limit. • Now by using stopper, we have managed addition of excess oil into the Coolant tank. Step 08 : Development of Solutions 103
  • 104. Shourya SR. NO. POSSIBLE SOLUTIONS REMARKS 7 Additives of oil to be maintained • Oil must have proper additives such as anti Staining, Anti oxidant and Anti Corrosive agents for getting required quality of finished product. • Anti-Staining agents to be used for preventing excess adhesiveness on strip surface • Anti oxidants agents to be used to prevent oxide formation in Coolant. • Anti Corrosive agents to be used to prevent the equipment ( Agitator, Coolant Tank Inner surface, Magnetic Separator and Self Cleaning Filter, Backwash Filter, Coolant pipeline, etc. ) which are in continuous contact with coolant. 8 Mixing of pH booster • Standard quality of pH Booster to be used. For e.g. (WA10128) • Due to low pH, separation of oil from water is not possible. • Layer of oil gets formed over emulsion • Creating problems in ETP ( Effluent Treatment Plant) like variation in colour such as brown, reddish and black colour) • Due to which more time required for waste treatment process at ZLD • Frequent skidding problems taking place in Mill while operating any coil. Step 08 : Development of Solutions 104
  • 105. Shourya SR. NO. FACTORS AFFECTING RESULTS 1. Addition of emulsifier (WA10382) to improve oil concentration Build up proper concentration 2. Mixing of pH booster (WA10128) Required pH range obtained 3. Change of magnetic separator cycle time (ON/OFF) . Fe content and oil losses decreases 4. pH of DM water should be maintained Required Roll Coolant pH range obtained 5. Additives of oil to be maintained Generation of Black patches has been reduced due to effective anti staining properties 6 Controlled rate of oil addition for reducing oil consumption Oil consumption decreases • After finding out the possible solutions for maintaining coolant parameters, we observed that the intensity of black patches has been reduced significantly. • In further processing lines, leader end generation has been reduced. • Weight of leader end, earlier which was above 400 kg has now been reduced to below 400 kg (within norms). • It helps us in improving Hr to Cr yield which ultimately increases rate of production of Mill and further coating lines ( Galva)  Impact on Generation of Leader End Leader End Photo Step 08 : Development of Solutions 105
  • 106. Shourya Sr. No. Possible Solutions Impact Of Idea Cost Innovation quotient Time Ease of Implementation Total 30+ Accepted >30 NA 1. Addition of emulsifier (WA10382) to improve oil concentration 9 6 4 9 8 36 2. Mixing of pH booster (WA10128) 7 8 5 8 6 34 3. Scum generation to be minimised with regular skimming 4 6 3 5 7 25 4. pH of DM water should be maintained 6 5 6 7 4 28 5. Additives of oil to be maintained 7 6 5 8 6 32 6 Controlled rate of oil addition for reducing oil consumption 5 7 5 6 6 29 7 Change of magnetic separator cycle time (ON/OFF) . 8 6 6 7 7 34 8 Synthetic oil to be used 5 8 3 2 5 21 Step 08 : Development of Solutions  We used ICTIE (Matrix for the best solution), also we have given numbers out of 10. 106
  • 107. Shourya Sr. No Probable Solution Suggested By Accepted / Rejected Remarks 1 Addition of emulsifier (WA10382) Shraddha Accepted Effective way for building concentration and maintaining pH 2 Mixing of pH booster (WA10128) Rohit Accepted 3 Scum generation to be minimised Mahesh Werulkar Rejected Not Feasible 4 Maintaining pH of DM water Shraddha Rejected Already in range 5 Additives of oil to be maintained Dhanesh Vijayan Accepted Plays major role in improving quality of strip surface 6 Controlled rate of oil addition Rohit Rejected Proper training should be given for oil addition 7 Change of magnetic separator cycle time (ON/OFF) . Sagar Accepted Effective and easy way to prevent oil losses 8 Synthetic oil to be used Mahesh Werulkar Rejected Costlier and not suitable for Mill Step 08 : Development of Solutions  Responsibilities were given to respective team members to monitor the solutions 107
  • 108. Shourya Sr. No Activity Responsibility Target Days to complete Why to be done 1 Addition of emulsifier (WA10382) Shraddha 2 days To ensure proper concentration of emulsion 2 Mixing of pH booster (WA10128) Rohit 2 days To obtain required pH level 3 Additives of oil to be maintained Dhanesh Vijayan 3 days To maintain proper anti staining properties of coolant 4 Change IN magnetic separator cycle time (ON/OFF) . Sagar 4 days To maintain required Fe content along with less oil losses Step 08 : Development of Solutions  Responsibility Chart :  The Members monitored each activity and their remarks were used to find the best solution. 108
  • 109. Shourya Step – 9 : Foreseeing Probable Resistance Tools used : Brainstorming “If you can't describe what you are doing as a process, you don't know what you're doing” - W. Edwards Deming 109
  • 110. Shourya Addition of emulsifier to improve oil concentration Faced Difficulties while Selection of proper emulsifier By studying properties of emulsifier which gives better concentration Lack of information about ’ How much quantity of emulsifier to be added ? Decided Standard quantity to be added by taking various trials Mixing of pH booster Selected pH booster already available to us was not satisfying mill condition Standard range decided to add pH booster in coolant With the help of quality person and oil supplier we have selected suitable pH booster Use of excessive pH booster leads to mill problem (skidding)  Using Brainstorming, we noted down what resistances might be incurred with the selected Solution and worked on overcoming these Resistances Step 9 : Foreseeing Probable Resistance Resistance - 1 Resistance - 2 110
  • 111. Shourya Change of magnetic separator cycle time (ON/OFF) . Not getting required quality of strip surface (Formation of black patches increased) Studied Standard quantity of Anti Agents for getting good quality of oil Excessive use of additives results in poor Coolant property Standard range of additives was fixed according to coolant reports Due to frequent change in magnetic separator cycle, operational efficiency reduce. Due to more ON and less OFF time leads to more oil losses along with iron To overcome this, we decided standard ON/OFF time To overcome this, we set standard cycle time Step 9 : Foreseeing Probable Resistance Additives of oil to be maintained Resistance - 4 Resistance - 3 111
  • 112. Shourya Improvement in HR to CR yield High Leader End in Galvalume Line Addition of emulsifier to improve oil concentration Mixing of pH booster Additives of oil to be maintained Change of magnetic separator cycle time (ON/OFF) . Overview of problem : Step 9 : Foreseeing Probable Resistance 112
  • 113. Shourya Step – 10 : Trial Implementation and Check Performance Tools used : SMART Analysis PDCA cycle 5W-1H Technique Control Chart “Quality has to be caused, not controlled” - Philip B. Crosby 113
  • 114. Shourya S SPECIFIC/ SIMPLE Yes, It can be possible to achieve M MEASURABLE Yes, we can monitor it on daily/shift basis to check abnormalities for Improving HR to CR Yield A ACCOUNTABLE Yes, it accounts for increase in Yield from 95% to 95.5%. R REALISTIC Yes, system is sophisticated by continual improvement and monitoring at Mill T TIME BOUND High Leader End weight due to Black Patches is reduced within time period of Nov-19 to June-20  For Verifying the recommendation of solutions, we use PDCA analysis Step 10 : Trial Implementation and Check Performance 114
  • 115. Shourya • Trial to be taken for quantity added and results achieved will be recorded, for emulsifier, pH booster and additives addition • Training and Knowledge sharing • Regular checking of oil concentration • Checking and maintaining the pH Level • Regular Checking the norms of oil additives • To monitor magnetic separator cycle time • For Reducing High Leader End Generation • Addition of Emulsifier • Mixing of pH booster • Additives of oil to be maintained • Change in Magnetic Separator Cycle time (ON/OFF) • Take appropriate actions to fulfill the regular implementations for reducing weight of Leader End PLAN DO CHECK ACT  For Effective Trial and Implementa tion we used PDCA Cycle for reducing Leader End Step 10 : Trial Implementation and Check Performance 115
  • 116. Shourya PLAN Type Description What is to be planned for reducing Leader end ? Maintaining roll coolant parameters by: 1. Addition of emulsifier 2. Mixing of pH booster 3 Additives of oil to be maintained 4. Change IN magnetic separator cycle time (ON/OFF) . Why is to be planned ? To reduce black patch generation to achieve minimum rate of leader End generation Who is responsible ? QC Team When to be planned ? 01 June 2020 Where to implement the plan ? Galvalume line How to Implement the plan ? 1. By studying properties of emulsifier which gives better concentration 2. Standard range decided to add pH booster in coolant to maintain pH range of emulsion 3. Standard range of additives was fixed to improve anti staining properties of emulsion 4. Standard ON/OFF time of magnetic separator to maintain iron content in emulsion DO Type Description What is to be done ? 1. To implement our plan of using standard additives 2. Carryout proper training and education and following proper guidelines Why is to be done ? To maintain the required coolant properties for minimizing black Patches. Who is responsible ? Operation and Quality Assurance Team When it is to be done ? 01 July, 2020 Where it is to be done ? At 6Hi Mill How it is to be done ? With the help of Operation person and oil supplier we have decided to increase the quality of Roll Coolant and reduce black patch generation to reduce leader end generation  We Further used 5W-1H Technique for each of element of PDCA Cycle of the Oil Additives to be maintained: Step 10 : Trial Implementation and Check Performance 116
  • 117. Shourya CHECK Type Description What is to be checked ? Regular monitoring of Leader End generation at galvalume End due to black patch Why it is to be checked ? To achieve minimum Leader End regularly Who is Responsible ? QC Members When it is to be checked ? In Every shift ( A, B, C) Where it is to be checked ? At galvalume How to Check ? By doing regular follow-up with galvalume shift Incharge By collecting data for leader end generation due to black patch on daily basis ACT Type Description What action is to be taken ? We will standardize the time and quantity for addition of various additives in emulsion by making SOP for each parameters Why to act ? To sustain the results achieved Who is responsible ? Operation and maintenance department When to act ? After successful trial implementation & customer feedback Where to act ? Galvalume lines How to act ? With the help of Operator, Shift In charge and maintenance Crew and daily analysis of leader end generation and emulsion parameters  We Further used 5W-1H Technique for each of element of PDCA Cycle of the Oil Additives to be maintained: Step 10 : Trial Implementation and Check Performance 117
  • 118. Shourya Plan : For reducing Leader End Generation 1.Addition of emulsifier 2. Mixing of pH booster 3 Additives of oil to be maintained 4. Change IN magnetic separator cycle time (ON/OFF). Act : 1.As satisfied results are observed, we have decided to continue these roll coolant parameters at mill. 2. Regular feedback taken from customer end (Galvalume) Check : 1.Black patch generation at galvalume end (Below 400 kgs) 2.Checked Coolant Parameters such as Oil conc., Iron content, pH Level  PDCA (Plan-Do-Check-Act) Cycle : Step 10 : Trial Implementation and Check Performance Before After Magnetic cycle time in HMI Before After For good surface of coil : Emulsifier, pH Booster, Additives are used Do : 118
  • 119. Shourya SR No Shift Coils Weight of Leader End at Mill (MT) Weight of Leader End at Galvalume (MT) Remarks 1 A KM1A0G0448 0.25 0.34 No black patch found 2 B KM1A0G0447 0.21 0.38 No black patch found 3 C KM1A0G0405 0.24 0.35 No black patch found 4 A KM1A0G0406 0.22 0.34 No black patch found 5 B KM1A0G0388 0.2 0.35 No black patch found 6 C KM1A0G0445 0.23 0.35 No black patch found 7 A KM1A0G0453 0.21 0.4 No black patch found 8 B KM1A0G0451 0.24 0.39 No black patch found 9 C KM1A0G0452 0.2 0.32 No black patch found 10 A KM1A0G0455 0.25 0.38 No black patch found 11 B KM1A0G0460 0.23 0.34 No black patch found 12 C KM1A0G0467 0.21 0.37 No black patch found  Trial performance Checklist of Leader End : Step 10 : Trial Implementation and Check Performance 119
  • 120. Shourya  Oil parameters Shift Wise performance sheet : Date Parameters Shift Wise Data Date Shift Wise Data Date Shift Wise Data Norms A B C A B C A B C 1-Sept-20 OIL % 1.5-3.5 2.2 1.6 3.1 11-Sept-20 2.36 2.99 3.45 21-Sept-20 1.89 1.79 2.86 Iron ppm 0-600 436 582 468 379 459 458 496 582 489 ph 5.5-6.5 5.7 6.1 5.9 5.89 5.49 5.72 6.2 5.89 5.73 2-Sept-20 OIL % 1.5-3.5 1.89 1.79 2.86 12-Sept-20 2.47 2.33 1.56 22-Sept-20 2.2 1.6 3.1 Iron ppm 0-600 496 582 489 273 269 386 436 582 468 ph 5.5-6.5 6.2 5.89 5.73 5.61 5.89 5.73 5.7 6.1 5.9 3-Sept-20 OIL % 1.5-3.5 1.94 2.96 3.42 13-Sept-20 2.2 1.6 3.1 23-Sept-20 1.94 2.96 3.42 Iron ppm 0-600 572 546 473 436 582 468 572 546 473 ph 5.5-6.5 5.84 6.39 6 5.7 6.1 5.9 5.84 6.39 6.45 4-Sept-20 OIL % 1.5-3.5 3.12 3.48 3.16 14-Sept-20 1.89 1.79 2.86 24-Sept-20 2.2 1.6 3.1 Iron ppm 0-600 329 426 548 496 582 489 436 582 468 ph 5.5-6.5 5.62 6.12 6.03 6.2 5.89 5.73 5.7 6.1 5.9 5-Sept-20 OIL % 1.5-3.5 2.2 1.6 3.1 15-Sept-20 1.94 2.96 3.42 25-Sept-20 2.36 2.99 3.45 Iron ppm 0-600 436 582 468 572 546 473 379 459 458 ph 5.5-6.5 5.7 6.1 5.9 5.84 6.39 6.09 5.89 5.49 5.72 6-Sept-20 OIL % 1.5-3.5 1.89 1.79 2.86 16-Sept-20 2.36 2.99 3.45 26-Sept-20 1.94 2.96 3.42 Iron ppm 0-600 496 582 489 379 459 458 572 546 473 ph 5.5-6.5 6.2 5.89 5.73 5.89 5.49 5.72 5.84 6.39 6.13 7-Sept-20 OIL % 1.5-3.5 2.36 2.99 3.45 17-Sept-20 2.2 1.6 3.1 27-Sept-20 2.2 1.6 3.1 Iron ppm 0-600 379 459 458 436 582 468 436 582 468 ph 5.5-6.5 5.89 5.49 5.72 5.7 6.1 5.9 5.7 6.1 5.9 8-Sept-20 OIL % 1.5-3.5 2.2 1.6 3.1 18-Sept-20 1.94 2.96 3.42 28-Sept-20 1.89 1.79 2.86 Iron ppm 0-600 436 582 468 572 546 473 496 582 489 ph 5.5-6.5 5.7 6.1 5.9 5.84 6.39 6.74 6.2 5.89 5.73 9-Sept-20 OIL % 1.5-3.5 2.2 1.6 3.1 19-Sept-20 2.36 2.99 3.45 29-Sept-20 2.2 1.6 3.1 Iron ppm 0-600 436 582 468 379 459 458 436 582 468 ph 5.5-6.5 5.7 6.1 5.9 5.89 5.49 5.72 5.7 6.1 5.9 10-Sept-20 OIL % 1.5-3.5 1.94 2.96 3.42 21-Sept-20 1.89 1.79 2.86 30-Sept-20 1.89 1.79 2.86 Iron ppm 0-600 572 546 473 496 582 489 496 582 489 ph 5.5-6.5 5.84 6.39 6.48 6.2 5.89 5.73 6.2 5.89 5.73 Step 10 : Trial Implementation and Check Performance  We have shown here the data of Oil Parameters of September Month 120
  • 121. Shourya  Performance chart of Leader End generation : Step 10 : Trial Implementation and Check Performance Leaderend in feb, 2020 0 0.2 0.4 0.6 0.8 1 1 2 3 4 5 6 7 8 9 10 11 12 13 14 15 16 17 18 19 20 21 22 23 24 25 26 27 28 29 Leaderend Wt (Ton) Date Leaderend generation performance chart Leaderend in feb, 2020 Leaderend in Sept, 2020 121
  • 122. Shourya Step 10 : Trial Implementation and Check Performance  Trial and Implementation of Oil 122
  • 123. Shourya Step – 11 : Regular Implementation Tools used : Data Collection Line Graph Bar Graph Area Graph “Cost is more important than quality but quality is the best way to reduce the cost” -Genichi Taguchi 123
  • 124. Shourya  Month wise Production yield performance of leader end: Month Target Yield Actual Yield Total Yield loss % of Leader end due to Black patch above 400 Kg November-19 95.26% 95% -0.26 40% December-19 95.26% 95.12% -0.14 38% January-20 95.26% 94.98% -0.28 42% February-20 95.26% 95.02% -0.24 35% AVG. 95.26% 95.03% -0.23 93% Month Target Yield Actual Yield Total Yield loss % of Leader end due to Black patch above 400 Kg March-2020 95.26% 95.49% 0.23 22% April-2020 0 0 0 0 May-2020 95.26% 95.39% 0.13 20% June-2020 95.26% 95.48% 0.22 15% July-2020 95.26% 95.56 0.24 12% August -2020 95.26% 95.86 0.16 8% September - 2020 95.26% 95.77 0.17 10% October -2020 95.26% 95.81 0.21 8% AVG. 95.26% 95.44% 0.18 20%  Month wise yield before QC  Month wise yield after QC Step 11 : Regular Implementation Lockdown 124
  • 125. Shourya Month % of leader end below 400 Kg Month % of leader end below 400 Kg Nov-19 76.00% May-20 79.00% Dec-19 85.30% Jun-20 89.00% Jan-20 83.12% July-20 85.00% Feb-20 82.15% Aug-20 81.23% Mar-20 84.23% Sept-20 86.89% Apr-20 0 Oct-20 91.26%  Data collection after regular implementation : Step 11 : Regular Implementation Lockdown 125
  • 126. Shourya  Line Graph : Showing Leader End of each months of previous shown data after regular implementation : Step 11 : Regular Implementation 0.00% 10.00% 20.00% 30.00% 40.00% 50.00% 60.00% 70.00% 80.00% 90.00% 100.00% Nov-19 Dec-19 Jan-20 Feb-20 Mar-20 Apr-20 May-20 Jun-20 Jul-20 Aug-20 Sep-20 Oct-20 % of Leader End Month % of leader end below 400 Kg Lockdown 126
  • 127. Shourya Month HR to CR Yield November, 19 85.89% December, 19 87.77% January, 20 84.68% February, 20 80.13% March, 2020 81.22% April, 2020 0.00% May, 2020 94.96% June, 2020 95.48% July, 20 95.56% August, 20 95.86% September, 20 95.77% October, 20 95.81%  Month Wise Yield Performance Chart : Step 11 : Regular Implementation 85.89% 87.77% 84.68% 80.13% 81.22% 0.00% 94.96% 95.48% 95.56% 95.86% 95.77% 95.81% 0.00% 20.00% 40.00% 60.00% 80.00% 100.00% 120.00% HR to CR Yield Month HR to CR Yield Before QC After QC Lockdown 127
  • 128. Shourya  Month Wise Oil Concentration Chart : Step 11 : Regular Implementation Month Oil Concentration (2- 3.5)% November, 19 1.75% December, 19 1.80% January, 20 2.00% February, 20 1.40% March, 2020 1.68% April, 2020 0.00% May, 2020 1.88% June, 2020 2.90% July, 20 3.10% August, 20 3.20% September, 20 3.44% October, 20 1.88% 1.75% 1.80% 2.00% 1.40% 1.68% 0.00% 1.88% 2.90% 3.10% 3.20% 3.44% 3.41% 0.00% 0.50% 1.00% 1.50% 2.00% 2.50% 3.00% 3.50% 4.00% HR to CR Yield Months Oil Concentration (2-3.5)% After QC Before QC Lockdown 128
  • 129. Shourya  Month Wise pH Performance Chart : Step 11 : Regular Implementation 4.65 4.9 5 2.89 4.89 0 5.1 5.77 5.89 6.2 6.09 6.15 0 1 2 3 4 5 6 7 November, 19 December, 19 January, 20 February, 20 March, 2020 April, 2020 May, 2020 June, 2020 July, 2020 August, 20 September, 20 October, 20 pH Range Months pH range (5.5-6.5) Month pH range (5.5-6.5) November, 19 4.65 December, 19 4.9 January, 20 5 February, 20 2.89 March, 2020 4.89 April, 2020 0 May, 2020 4.7 June, 2020 5.1 July, 20 5.89 August, 20 6.2 September, 20 6.09 October, 20 4.65 Lockdown Before QC After QC 129
  • 130. Shourya  Month Wise Chart of Iron Content : Step 11 : Regular Implementation Month Iron Content (400 max) November, 19 600 December, 19 589 January, 20 542 February, 20 789 March, 2020 550 April, 2020 0 May, 2020 443 June, 2020 402 July, 20 389 August, 20 351 September, 20 314 October, 20 335 600 589 542 789 550 0 443 402 389 351 314 335 0 100 200 300 400 500 600 700 800 900 Iron Content Month Iron Content (400 max) Lockdown Before QC After QC 130
  • 131. Shourya  Cost Analysis after QC: Cost analysis of Increasing Leader End due to Black patches Before QC Cost analysis of Increasing Leader End due to Black patches After QC Average coil end wt: 500 Kg Target coil end: 400 Kg Average coil end wt: 350 Kg Target coil end: 400 Kg A=Cost of prime material/ton (GP+CC) = ₹ 70000 A=Cost of prime material/ton (GP+CC) = ₹ 70000 B=Cost of leader end material/Ton = ₹ 32000 B=Cost of leader end material/Ton = ₹ 32000 C =Loss of material/Ton C = A-B = 70000-32000 = 38000 ₹/Ton C =Loss of material/Ton C = A-B = 70000-32000 = 38000 ₹/Ton D =Loss of material/Month =0.10*500=50 Ton D =Gain of material/Month =0.15*500=75 Ton E = Total loss = 50*38000 = 1900000 ₹/ Month E = Total gain = 75*38000 = 2850000 ₹/ Month Step 11 : Regular Implementation 131
  • 132. Shourya  Intangible benefits for the Quality circle members: Befor… After… Before QC After QC • Job Satisfaction • Increased Co-operation • Improved Self Confidence • Increased Computer Knowledge • Improved presentation Skills • Increased Innovative spirit • Communication Skills • Problem Solving Skills • QC Knowledge 5 S Improvement : Improved House Keeping Safety : Developed Safe Work Atmosphere using Du-Pont Technique Step 11 : Regular Implementation 132
  • 134. Shourya  Checklist for important parameters to be maintained  For maintaining Oil Parameters 1. Reporting in mail to everyone 2. Daily noting in Log Book These parameters are to be reviewed by QC members on Regular basis at the end of every shift as shown here. Line Parameters checked Requirement A - Shift B - Shift C - Shift Result Remarks Result Remarks Result Remarks 6 Hi (M1) Total Oil (%) 2.00 - 3.50 2.20 OK 2.00 OK 2.00 OK Scum (%) 1.00 (Max) 0.20 OK 0.20 OK 0.20 OK Iron (ppm) 400 (Max) 356 OK 334 OK 334 OK pH 5.50 - 6.50 5.86 OK 5.90 OK 6.20 OK Step 12 : Follow Up and Review 134
  • 135. Shourya Sr. No Sujhaav Title Sujhaav By Submitted On HOD Remarks Closure Status 1 Stand to be make to place the coil end/leader end Dhanesh Vijayan 10/6/2020 Safety And House Keeping Approved 2 Wiper arrangement require at Mill-1 to wipe out the coolant carry over Mahesh Werulkar 10/6/2020 Qms, Improved Quality Pending with HOD 3 improve coolant quality at mill 1 by installing oil skimmer Rohit Gupta 9/7/2020 QMS Approved 4 coolant pipe line change Shraddha 11/8/2020 QMS, improved utilization and quality Approved 5 Water Conservation Dhanesh Vijayan 11/8/2020 Closed Approved 6 safety barricade around coil storage and Leader End area, Rohit Gupta 15/9/2020 ok Approved  We have also made some Sujhaav in our organization Sujhaav Portal as shown below : Step 12 : Follow Up and Review 135
  • 136. Shourya Format No: 08.16.01 QMP No.09 START DATE 1-Nov-19 QUALITY OBJECTIVE: SCOPE: RESPONSIBILITY: Responsibility Trgt Date Com pletion Date Expences Status / Rem arks Shift Incharge Regular Regular Ok Shift Incharge Regular Regular Ok Shift Incharge Regular Regular Ok Review Date: Remarks Section I/C: - Sign - Unit I/C: - Sign - Section I/C: - Sign -HOD : - Remarks HOD: - Analyse the Coil ends coming above and below 400 kgs 56864 Maintaining Roll Coolant parameters Maintaining Magnetic Seperator ON/OFF time Reducing Leader end Generation at coating lines Eliminating High weight leader end at coating line so as to improve HR to CR Yield Shift Incharge DESCRIPTION: Coil leaderend welding to head end of HR at payoff,so that one side coil leaderend save. List of activities to be performed by each dept. JSW Steel Coated Products Limited,KLM QUALITY MANAGEMENT PROGRAMME - 2020 Dept: Mill Operation QMP/Mill/Opr/June-20/09 COMPLETION DATE Regular  Made some QMP Programme as shown : Step 12 : Follow Up and Review 136
  • 137. Shourya CRM Operation Training Dept S. No. Name Person / Training Roles & responsibilities and dept. objectives. Significant Environmental aspects and initiatives Significant Hazards , HIRA and initiatives Dept. Statutory requirements Emergency Preparedness Energy Saving Total Tech Training Planned / Attended Total Train ing Hour s Planned(P) , Attended(A) P T A AT P T A AT P T A AT P T A A T P T A AT P T A AT P T A AT P MILL 1 1 Vinesh Dwivedi 1 0.5 1 0.5 2 0.75 1 0.75 2 2 0 1 1 1 1 2 1.5 0 2 0.5 1 0.5 14 6.55 8 3.55 24 MILL 1 2 Rajeev Bhramar 1 0.5 0 2 0.75 0 2 1 1 1 1 1 0 2 1.5 0 2 0.5 0 14 6.55 12 5.55 24 MILL 1 3 K C Sharma 1 0.5 1 0.5 2 0.75 0 2 1 0 1 1 0 2 1.5 1 1.5 2 0.5 0 14 6.55 8 3.55 24 MILL 1 4 D Malviya 1 0.5 1 0.5 2 0.75 1 0.75 2 1 1 1 1 1 0 2 1.5 0 2 0.5 1 0.5 14 6.55 11 5.05 24 MILL 1 5 D Kokate 1 0.5 1 0.5 2 0.75 0 2 1 1 1 1 1 0 2 1.5 0 2 0.5 1 0.5 14 6.55 7 3.05 24 MILL 1 6 C Ucchasare 1 0.5 0 2 0.75 0 2 2 0 1 1 1 1 2 1.5 1 1.5 2 0.5 1 0.5 14 6.55 5 2.5 24 MILL 1 7 S A Choudhari 1 0.5 0 2 0.75 1 0.75 2 1 1 1 1 1 1 1 2 1.5 0 2 0.5 1 0.5 14 6.55 5 2.5 24 MILL 1 8 Ajay Yadav 1 0.5 1 0.5 2 0.75 0 2 2 0 1 1 0 2 1.5 0 2 0.5 0 14 6.55 5 2.5 24 MILL 1 9 K V Srinivas 1 0.5 1 0.5 2 0.75 0 2 1 0 1 1 1 1 2 1.5 1 1.5 2 0.5 0 14 6.55 4 1.55 24 MILL 1 10 I M Dongre 1 0.5 1 0.5 2 0.75 1 0.75 2 1 1 1 1 1 0 2 1.5 0 2 0.5 1 0.5 14 6.55 7 3.05 24 MILL 1 11 N Palade 1 0.5 0 2 0.75 0 2 1 0 1 1 1 1 2 1.5 0 2 0.5 1 0.5 14 6.55 8 3.55 24 MILL 1 12 Dheeraj Thigale 1 0.5 1 0.5 2 0.75 0 2 1 1 1 1 1 0 2 1.5 0 2 0.5 1 0.5 14 6.55 9 4.5 24 MILL 1 13 Harshal Patil 1 0.5 0 2 0.75 1 0.75 2 1 0 1 1 1 1 2 1.5 1 1.5 2 0.5 0 14 6.55 9 4.5 24 MILL 1 14 Pradeep Singh 1 0.5 1 0.5 2 0.75 0 2 1 0 1 1 1 1 2 1.5 0 2 0.5 1 0.5 14 6.55 12 5.55 24  P- Training Planned; Training Hrs; A-Training attended; AT-Total Training Completed Hrs Step 12 : Follow Up and Review  Training taken of employees : 137
  • 138. Shourya Step 12 : Follow Up and Review  Training taken of employees : 138
  • 139. Shourya Step 12 : Follow Up and Review  We have also shown skit performance of quality circle and given safety trainings to other employees : Skit Performance Fire Safety Training 139
  • 140. Shourya Step 12 : Follow Up and Review  Kaizen of our Department 140
  • 141. Shourya Step 12 : Follow Up and Review  Appreciation Letter from our HOD 141
  • 142. Shourya SR No Activities 1 2 3 4 5 6 7 8 9 10 11 12-18 18-22 Remarks 1 Identification of Work related problems No Variation 2 Selection of Problems No variation 3 Define the Problems No variation 4 Analyze the problem Due to absence of members 5 Identification of causes Due to previous delay 6 Finding out the root causes Due to previous delay 7 Data analysis No variation 8 Developing solutions No variation 9 Foreseeing Probable resistance No variation 10 Trial Implementation and check performance Delay due to Breakdown 11 Regular Implementation No Variation 12 Follow Up/Review No variation  Scheduled Gantt Chart : Step 12 : Follow Up and Review Planned May-20 Actual June-20 142
  • 143. Shourya Steps No Steps Details Flow Diagram Brain Storming Data collection Pareto Diagram Cause & Effect Diagram Stratification Graphs 5 W-1 H Technique 1 Identification of Work related problems 2 Selection of Problems 3 Define the Problems 4 Analyze the problem 5 Identification of causes 6 Finding out the root causes 7 Data analysis 8 Developing solutions 9 Foreseeing Probable resistance 10 Trial Implementation and check performance 11 Regular Implementation 12 Follow Up/Review  Tools and Technique Used while solving problems Step 12 : Follow Up and Review Note : Tools Used 143
  • 144. Shourya  Members Views about the benefits they got from working in this quality circle: I was totally mesmerised by seeing how these small tools helped us to solve this problem so easily which become fruitful for our company too… - Shraddha The quality circle group helped in enhancing my presentation and communication skills along with managing time. - Rohit I learnt a lot while making the PPT presentation. Along with other team members, I learnt about time management. - Sagar I understood perfect meaning of teamwork and how to see the problem in easy and understandable way - Dhanesh I gained self confidence and improved my communication skills while speaking to others - Mahesh Step 12 : Follow Up and Review 144
  • 145. Shourya Future Plans 1. Regular feedback and monitoring of leader End generation at Galvalume 2. Pipe line will be change for avoiding coolant leakage 3. New air wiping system will be procured for better and efficient coolant wiping 4. New oil supplier will be chosen for better emulsion performance Step 12 : Follow Up and Review 145
  • 146. Shourya Making Steel Is Our Profession Generating Smile Is Our Passion… 146