More Related Content

PDF
nginxのログを非スケーラブルに省メモリな方法で蓄積する 
PDF

PPTX
Norikra� + Fluentd�+ Elasticsearch� + Kibana���� リアルタイムストリーミング処理�ログ集計による異常検知 
PDF

PDF

PPTX

PDF
Let's try to use Background sync 
PPTX
データ分析基盤として Rancher・k8s で始まるのか調査してみた What's hot

PDF
Awsでつくるapache kafkaといろんな悩み 
PDF
Logback stackdriver-loggingを作った 
PDF

PDF

PDF
EmbulkのGCS/BigQuery周りのプラグインについて 
PDF

PDF

PDF

PDF
Kafka logをオブジェクトストレージに連携する方法まとめ 
PDF

PDF

PPTX

PDF

PDF
Apache CloudStack -コントリビューションの手引き- 
PDF

PDF

PDF

PDF

PPT
Viewers also liked

PDF

PDF

PDF

PDF

PDF
Splatoon界での壮絶な戦い&Japan.Rの宣伝 
PDF

PDF
Word2vecで大谷翔平の二刀流論争に終止符を打つ! 
PPTX
Kaggle – Airbnb New User Bookingsのアプローチについて(Kaggle Tokyo Meetup #1 20160305) 
PDF

PDF
NIPS2016論文紹介 Riemannian SVRG fast stochastic optimization on riemannian manif... 
PPTX
Rstudio上でのパッケージインストールを便利にするaddin4githubinstall 
PDF
Overview of tree algorithms from decision tree to xgboost 
PDF

PDF

PDF
Icml2015 論文紹介 sparse_subspace_clustering_with_missing_entries 
PDF

PDF
PDF
High performance python computing for data science 
PDF
リクルートグループの現場事例から見る AI/ディープラーニング ビジネス活用の勘所 
PDF
More from Atsushi Hayakawa

PDF

PDF

PDF
dataclassとtypehintを使ってますか? 
PDF
トライアスロンとgepuro task views V2.0 Japan.R 2018 
PPTX

PPTX
Analyze The Community Of Tokyo.R 
PPTX

PDF

PDF
simputatoinで欠損値補完 - Tokyo.R #65 
PDF

PPTX

PDF

PDF
「Japan.R開催のお知らせ�」と�「Rでワンライナー」 
PDF

PDF

PDF
R入門(dplyrでデータ加工)-TokyoR42 
PDF
第六回「データ解析のための統計モデリング入門」前半 
PDF

PDF

PDF
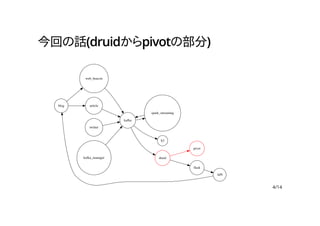
implyを用いたアクセスログの可視化
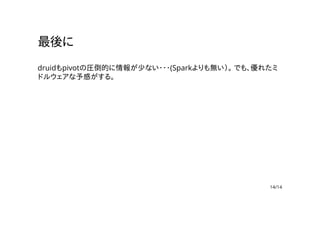
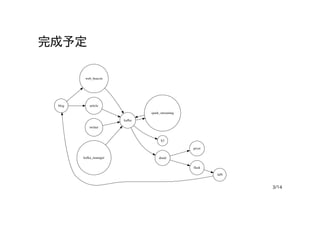
- 1.
- 2.
- 3.
- 4.
- 5.
- 6.
- 7.
- 8.
- 9.
- 10.
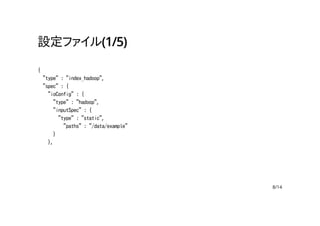
設定ファイル(3/5)
"parser" : {
"type": "string",
"parseSpec" : {
"format" : "json",
"dimensionsSpec" : {
"dimensions" : [
"time",
"sid",
"cid",
"site",
"url",
"referrer",
"ip",
"user-agent"
]
},
10/14
- 11.
- 12.
設定ファイル(5/5)
"metricsSpec" : [
{"name":"views", "type": "count"}
]
},
"tuningConfig" : {
"type" : "hadoop",
"partitionsSpec" : {
"type" : "hashed",
"targetPartitionSize" : 5000000
},
"jobProperties" : {}
}
}
}
12/14
- 13.
- 14.


![設定ファイル(2/5)
"dataSchema" : {
"dataSource" : "webbeacon",
"granularitySpec" : {
"type" : "uniform",
"segmentGranularity" : "day",
"queryGranularity" : "none",
"intervals" : ["2015-10-28/2015-10-29"]
},
9/14](https://image.slidesharecdn.com/lt07-151204053033-lva1-app6891/85/imply-9-320.jpg)
![設定ファイル(3/5)
"parser" : {
"type" : "string",
"parseSpec" : {
"format" : "json",
"dimensionsSpec" : {
"dimensions" : [
"time",
"sid",
"cid",
"site",
"url",
"referrer",
"ip",
"user-agent"
]
},
10/14](https://image.slidesharecdn.com/lt07-151204053033-lva1-app6891/85/imply-10-320.jpg)
![設定ファイル(5/5)
"metricsSpec" : [
{"name": "views", "type": "count"}
]
},
"tuningConfig" : {
"type" : "hadoop",
"partitionsSpec" : {
"type" : "hashed",
"targetPartitionSize" : 5000000
},
"jobProperties" : {}
}
}
}
12/14](https://image.slidesharecdn.com/lt07-151204053033-lva1-app6891/85/imply-12-320.jpg)