Download to read offline
![2
A SANS 2021 Survey: Vulnerability Management—Impacts on Cloud and the Remote Workforce
Executive Summary
Vulnerability management (VM) continues to be a struggle for many organizations. As we
observed last year, companies have been tracking vulnerabilities in their systems and
third-party software since the late 1990s and shortly after had the ability to automatically
identify vulnerabilities in their systems, software, and even custom-developed applications.1
However, even though many organizations have well-defined vulnerability management
programs, there are certain aspects of these programs that continue to vex survey
respondents and prevent their organizations from maturing.
Identifying most vulnerabilities is typically not very hard, but fixing vulnerabilities is difficult
for a variety of reasons. Respondents listed these, among others:
•
We don’t budget for it—and we don’t have extra time or resources.
•
Operational teams are already overworked.
•
It never ends. Even if we remediate everything, new vulnerabilities are constantly
being discovered, and reports come in at different times and in different formats,
depending on the tools or teams being leveraged for identification.
•
It’s a business expectation, but not always a business requirement; therefore, the
effort is not always recognized and rewarded.
•
Security is accountable—but not responsible—for much of the work.
To succeed with vulnerability management, it takes a coordinated effort among security,
IT (both systems and software development), and the business operations groups.
Organizations must also identify, acknowledge, and track the roadblocks and technical
debt within the organization. Many times there are significant barriers that prevent timely
remediation of vulnerabilities. It is not uncommon to analyze vulnerability backlogs and
determine that well over 50% of the outstanding vulnerabilities cannot be remediated
following normal treatment processes or with the operational budgets and resources
currently allocated.
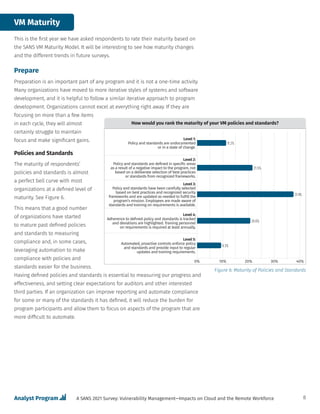
In this year’s survey, we looked at some of the same measures we looked at in the
previous two surveys. However, we also wanted to get more information on the responding
organizations’ maturity across the different phases of the VM life-cycle. To accomplish this,
we asked respondents to rate themselves against the SANS Vulnerability Management
Maturity Model, which addresses the following life-cycle phases and functions:
• Prepare
- Policy and standards
- Context
• Identify
- Automated identification
- Manual identification
- External identification (security researchers and crowdsourced identification)
1
“SANS Vulnerability Management Survey 2020,” www.sans.org/white-papers/39930/ [Registration required.]](https://image.slidesharecdn.com/impactscloudremoteworkforce-211201015247/85/Impacts-cloud-remote_workforce-2-320.jpg)


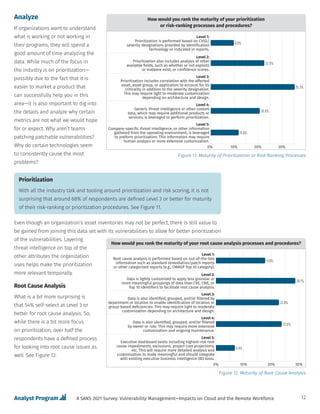


This document summarizes the key findings of a SANS 2021 survey on vulnerability management. The percentage of organizations with a formal vulnerability management program increased to 75% from 63% in 2020. While identifying vulnerabilities is not difficult, fixing them remains challenging due to lack of budget, resources, and prioritization. The survey assessed organizations' maturity across various phases of the vulnerability management lifecycle. It found that maturity is lower for managing vulnerabilities in cloud, containers, and custom software compared to traditional infrastructure. Responsibility for vulnerability management is increasingly shared between security and IT teams.