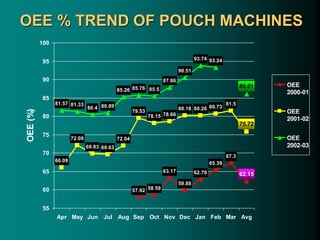
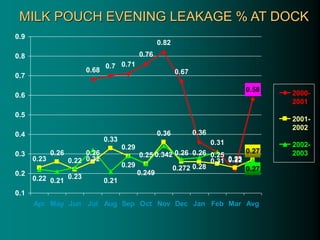
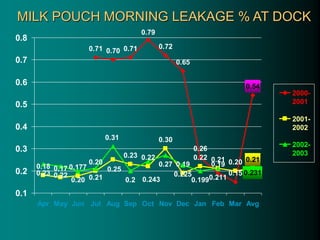
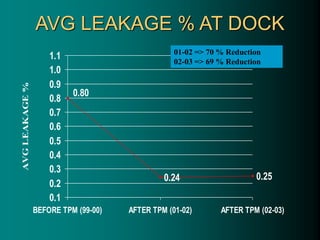
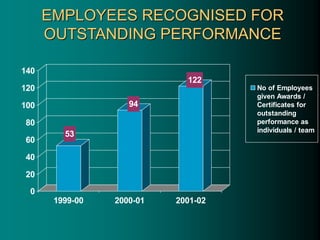
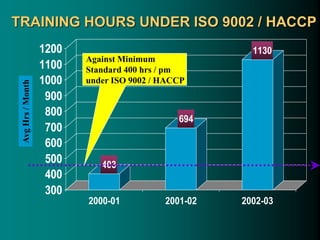
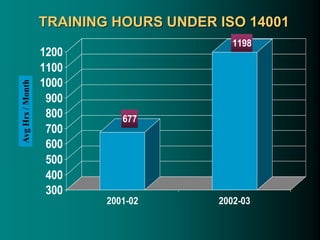
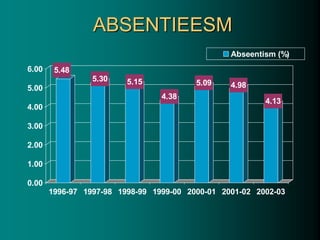
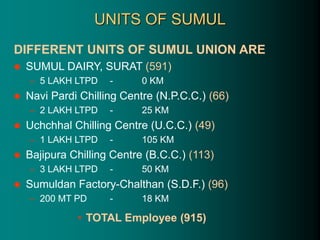
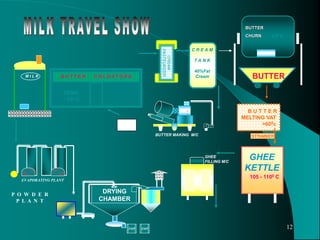
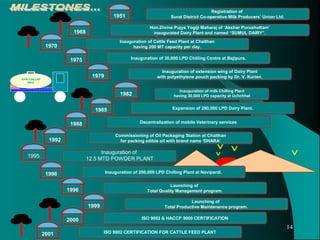
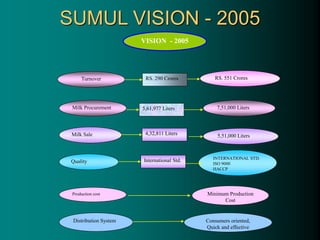
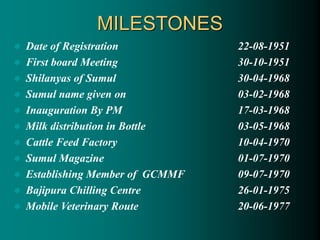
Sumul Dairy was established in 1951 by milk producers in Surat, India to gain fair prices and combat exploitation by private milk traders. It has since grown to include multiple processing plants, chilling centers, and a cattle feed factory. Sumul Dairy was awarded a Certificate of Merit in 2003 for quality. The summary focuses on the cooperative's origins, growth over time, and recent recognition for quality.
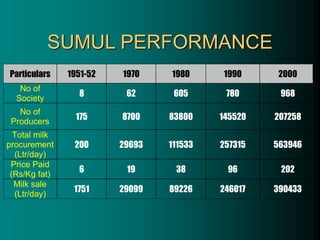
![11
O
O
O
O
O
O
O O
O
O
O O
O
O
Cream
Homogenizer
CREAM
SEPARATOR
CREAM
40% FAT
WHOLE
MILK
(6.5 / 9.0)
TEMP.
+ 50 C
M I L K C O L D S T O R E
P A S T E U R I Z E R
[ Heating to 800C & Cooling to 40C ]
C H I L L E R
TRIBAL VILLAGE
COOPERATIVE SOCIETY
O O
O
O
O
O
O
O
O O
O
O
O O
O
O
M I L K
CHILLING PLANT
O
O
O
O O
O
O
O O
O
O
POUCH FILLING
MACHINES
M I L K
P.S.M.
MILK
(4.5 /8.5)
M I L K
8OC 4OC
8OC
C I T Y
MILK
MILK](https://image.slidesharecdn.com/imcpres-220723054445-de3a1a37/85/IMCPRES-PPT-11-320.jpg)
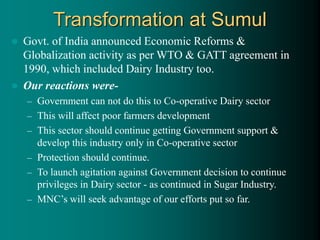
![MAIN
DAIRY PLANT
CATTLE FEED
FACTORY-CHALTHAN
MANGROL
B H A R U C H
S E R V I C E S :
1. CATTLE FEED PRODUCTION
2. VETERINARY SERVICES
3. ARTIFICIAL INSEMINATION
4. CO-OPERATIVE DEVELOPMENT
5. EXTENSION ACTIVITIES
6. MILK PROCESSING
& MILK PRODUCTS MANUFACTURE
7. MILK DISTRIBUTION
CHILLING CENTRE
km distance from Surat
CATTLE FEED FACTORY
TALUQA / TEHSIL NAME
UMARPADA
UCHCHHAL
VYARA
MANDVI
VALOD
MAHUVA
PALSANA
BARDOLI
KAMREJ
CHORYASI
OLPAD
NIZAR
DEDIAPADA
135 km
CHASWAD
100 k m
UCHCHHAL
CHILLING
CENTRE
100 km
BAJIPURA
CHILLING CENTRE
[Diagnostic Lab]
50 km
NAVIPARDI
CHILLING
CENTRE
28 km
NIZAR COMPLEX
165 km
MAIN DAIRY PLANT
U K A I
D A M
SONGADH
WORK AREA OF SUMUL](https://image.slidesharecdn.com/imcpres-220723054445-de3a1a37/85/IMCPRES-PPT-13-320.jpg)
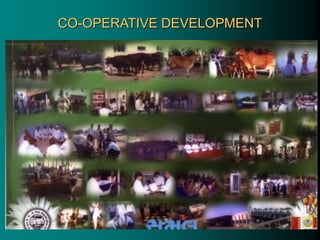
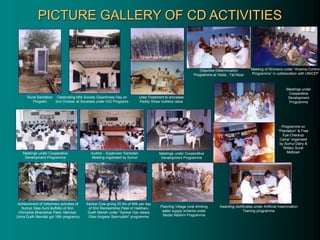
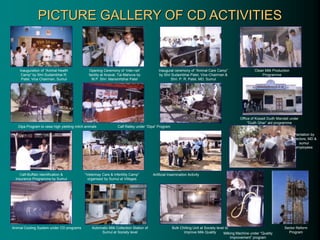
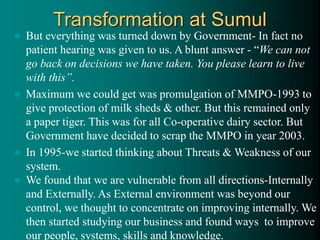
![Cooperative Focus
Maximum Return to our Producers
Developmental Programs
– Organization of new DCS (Village milk co-op soc)
– Milk procurement and milk route transportation
– Milk competition at taluka level and district level.
– Cattle feed competition
– Artificial insemination
– Breed improvement program(DIPA)
– 24 hours mobile veterinary services at door step of producer members (route
and special visit)
– Disease diagnostic laboratory
– Vaccination program for disease prevention at subsidies rate.
– Distribution of balance cattle feed (sumul dan) at no profit no loss basis
– Hybrid fodder seed distribution at subsidies rate.
– Electric chaff cuttersuda at subsidies rateWomen Dairy Co-operative
Leadership Development Programe
– Women seminar
– School Education program
– Film show for Profitable Dairy business at village level
– Monthly bulletin for Milk business [ SUMUL SETU ]](https://image.slidesharecdn.com/imcpres-220723054445-de3a1a37/85/IMCPRES-PPT-27-320.jpg)