Download as PDF, PPTX


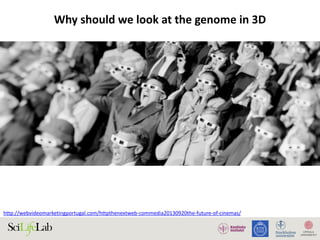

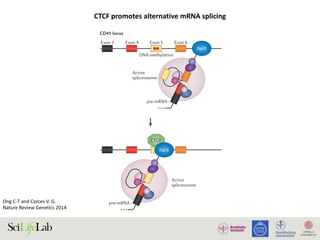
![30
Andersson R et al. TiG 2015
ed to neither enhancer nor promoters. Although generally
used to distinguish active from inactive enhancers [15],
H3K27ac is often also observed at active gene promoters
[14,53], to which it has a strong preference [55].
What, then, is the biological property reflected in
these marks? Recent work proposes that histone mod-
supported by the high relative importance of H3K4me
well as H3K27ac in predicting gene-expression levels f
histone modifications [57].
Although the idea that H3K4me3 is linked to transc
tional levels is difficult to test directly, there is s
supporting evidence already in the literature. For exam
Pekowska et al. replaced the endogenous Tcrb enha
with a mutated copy that confers a lower activity
observed a local increase in H3K4me1 and decreas
H3K4me3 compared with wild type [54], supportin
causal relation between transcriptional activity and
tone methylation. This notion is also consistent w
reports that H3K4 methyltransferases are recruited
the carboxy-terminal domain of RNAPII [58–60]. T
we argue that there is a relation between H3K4 met
ation and transcription levels that applies at both enh
cers and gene promoters.
However, the level of H3K4me3 is not related solel
transcription level, which is reflected by their relati
weak correlation (Figure 3B). Although H3K4 Set1 met
transferases are directly acquired by RNAPII, there i
observed bias of H3K4me3 to CpG-rich sequences med
ed by the CpG binding Cfp1 subunit of Set1 comple
[61]. The localization and level of H3K4me3 is fur
affected by the presence and position of the first exo
splice site, and inhibition of splicing reduces H3K4
levels, suggesting a link between splicing and H3K4
[62]. However, interfering with splicing is also likel
decrease the nuclear stability of a transcript [46,47]
discussed above, and, thus, is likely to decrease RNAPI
each regulatory element.
Understanding the relation between enhancer and
promoter function
The relation between the potential of each regula
element to act as a local promoter and its ability to enha
transcription at distal promoters remains poorly un
stood. Although based upon only a few cases, Li et
H3K4me3
TranscripƟon level
Stable RNA
H3K4me1
TranscripƟon level
Unstable RNA
(A)
(C)(B)
Highly transcribed
gene promoter / enhancer
Lowly transcribed
gene promoter / enhancer
High H3K4me3, low H3K4me1
H3K27ac
Key:
High H3K4me1, low H3K4me3
RNAPII RNAPII RNAPII RNAPII
TRENDS in Genetics
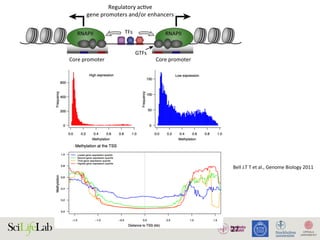
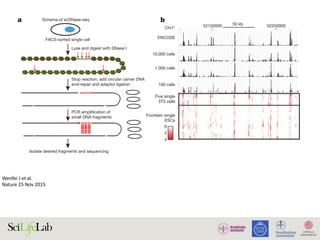
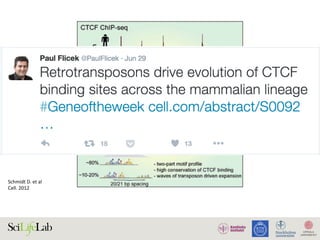
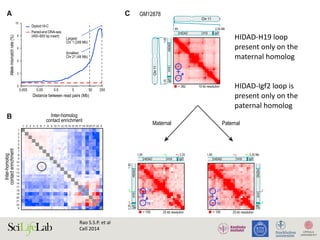
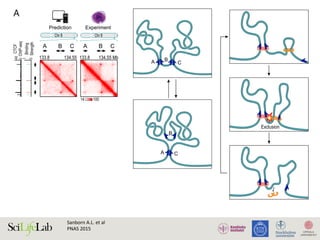
Figure 3. Transcriptional level is related to histone modifications at regulatory
elements. (A) Highly transcribed enhancers are often marked by histone H3 lysine
4 trimethylation (H3K4me3) and histone H3 lysine 27 acetylation (H3K27ac), making
them hard to distinguish from transcribed gene promoters using histone
modifications alone. Lowly transcribed gene promoters and gene-distal enhancers
are rarely marked by, or only by low levels of, H3K4me3 or H3K27ac, but often by
H3K4me1. (B) The level of H3K4me3 at the nucleosome-depleted regions (NDRs) at
the 50
end of transcripts encoding stable RNAs (e.g., mRNA) and unstable RNAs [e.g.,
enhancer-templated noncoding RNAs (eRNAs)] is correlated with their
transcriptional activity (see Figure 2 for the connection between RNA stability and
regulatory element). (C) The level of H3K4me1 at the NDRs of stable RNAs and
unstable RNAs is inversely correlated with their transcriptional activity. Nucleosome
illustrations in (A) reproduced, with permission, from [38]; (B,C) modified, with
permission, from [19].
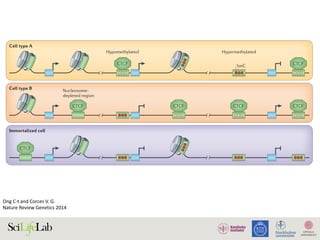
Zhou V W et al. Nat Rev
Genetics 2011
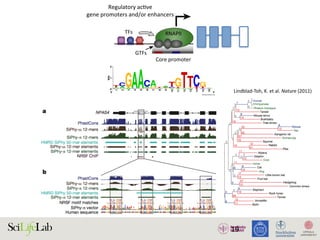
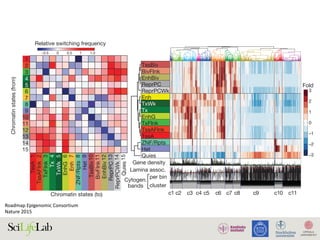
Figure 3 | Chromatin patterns and regulation by promoter class. Promoters can be classified according to their CpG
content. High CpG-content promoters (HCPs) and low CpG-content promoters (LCPs) are subject to distinct chromatin
REVIEWS](https://image.slidesharecdn.com/imbim-igp20151127-amb-160314225820/85/Imbim-igp-20151127-amb-part1b-30-320.jpg)
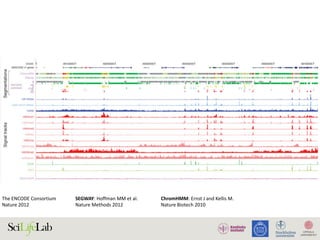
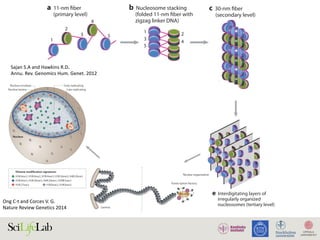
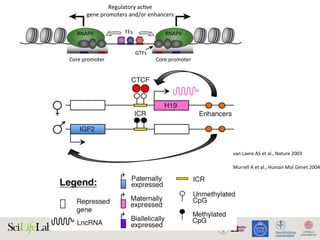
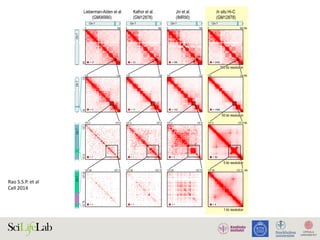
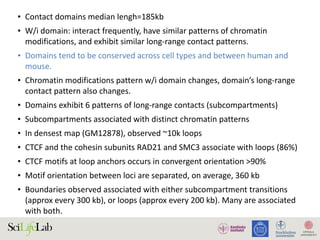
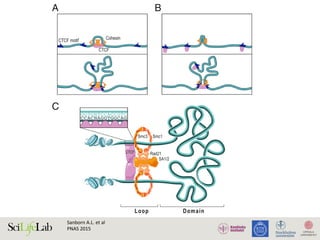
![Reverse cross-links
Intramolecular
ligation (circle
formation required)
Intramolecular ligation
(circle formation
not required)
c d4C(i) 4C(ii)
Reverse cross-links,
clone fragments,
and pick colonies
b 6C
ChIPChIP
Cross-linked chromatin
Digest chromatin with a
4-bp cutter restriction enzyme
[6-bp cutter for 4C(ii)]
Reverse
cross-links and
amplify one or
a few regions
by quantitative
PCR with specific
primers
3C
Obtain a measure
of interaction
frequency
High-throughput
sequencing of PCR
products
High-throughput
sequencing of PCR
products
Self-ligation of short
molecules to form circles,
and amplification using
bait-specific primers
(red arrows)
Trim linear fragments
with a 4-bp cutter
restriction enzyme
Reverse cross-links
and amplify using
bait-specific primers
(red arrows)
Digest clones with
original restriction
enzyme, run on gel,
and sequence clones
with multiple inserts
Intramolecular
ligation
(circle formation
not required)
3C, 5C
Intramolecular ligation
(circle formation not required)
a
5C
Reverse
cross-links
and amplify a
large number
of regions
by MLPA
High-throughput
sequencing of
PCR products
Bait-specific primers
used in 4C to amplify
all fragments that
interact with the bait
Vector in which
interacting fragments
are cloned in 6C
Digested fragments
from two 6C clones
resolved by gel
electrophoresis
Primers
complementary to
the universal linkers
for amplification of
multiple interacting
segments in 5C
Sequence-specific
primers (colored
portions) with
universal linkers
(black and gray) for
detecting long-range
chromatin interactions
via MLPA-PCR in 5C
Sequence-specific
primers for detecting
a given long-range
chromatin interaction
in 3C
Antibody specific for
a particular
transcription factor
Chromatin that
intervenes between
segments that interact
Distal genomic
segments that
interact with each
other via looping of
chromatin (red is a
bait used in 4C)
Transcription factor
molecules
CTCF molecule
Annu.Rev.Genom.HumanGenet.2012.13:59-82.Downloadedfromwww.annualreviews.org
AccessprovidedbyUniversityofUppsalaon11/26/15.Forpersonaluseonly.
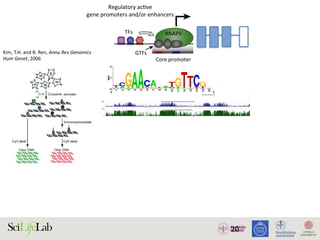
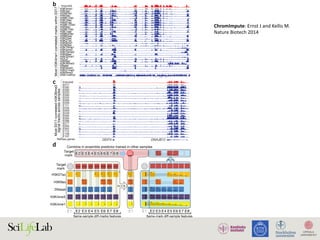
Sajan S.A and Hawkins R.D.
Annu. Rev. Genomics Hum. Genet. 2012](https://image.slidesharecdn.com/imbim-igp20151127-amb-160314225820/85/Imbim-igp-20151127-amb-part1b-43-320.jpg)


![(C)
Enha
(iii) Lagge
(i) (ii)
Enha
Low
RNAPII
transcripƟon
Low abundance
of factors
InacƟve
regulatory
element
AcƟve regulatory element
Promoter strength and/or transcripƟonal level
High
High abundance
of factors
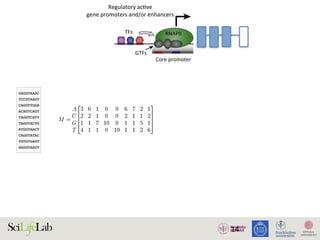
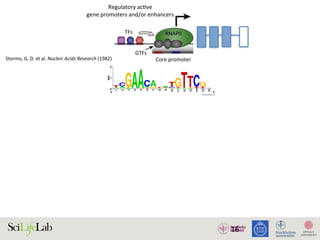
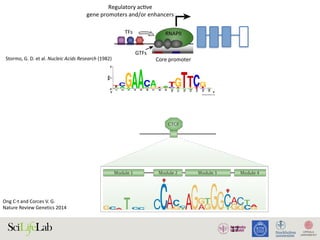
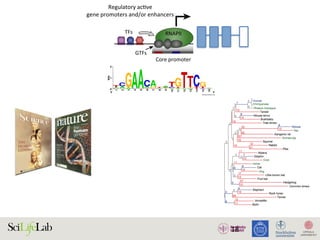
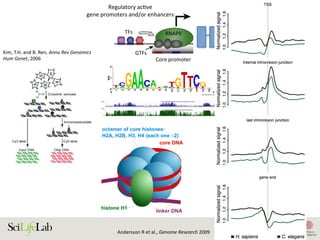
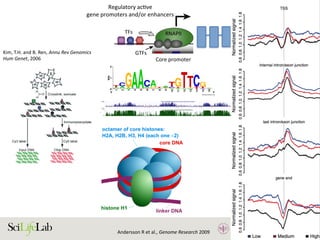
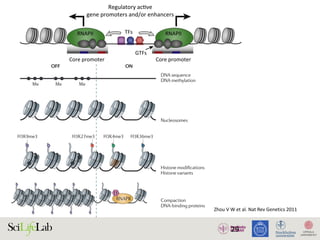
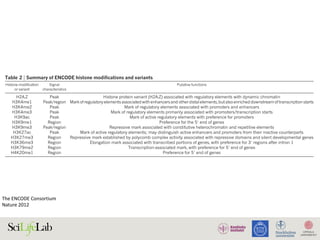
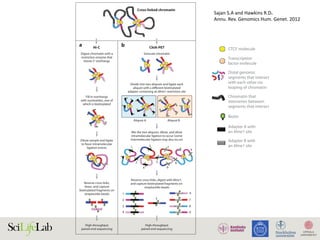
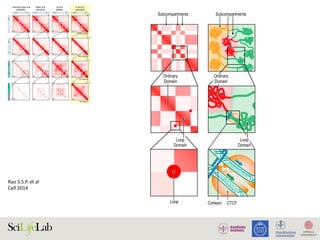
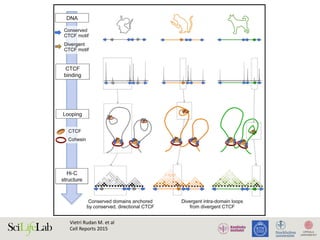
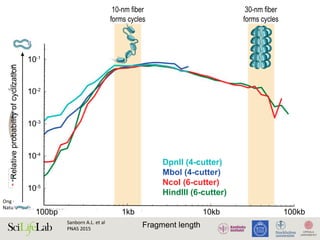
Figure 1. Active regulatory elements are divergently transcribed. (A) Both regulatory active gene promoters and gene-distal enh
(RNAPII) recruitment and transcription initiation are mediated by general transcription factors (GTFs) binding core promot
nucleosomes. This is facilitated by transcription factors (TFs), which often bind proximal to core promoters. Transcription often i
the nucleosome-depleted region (NDR). (B) Gene expression is often preceded by, or changes concurrently with, chang
(nonexpressed) state (i), enhancers and promoters may, or may not, bind RNAPII. Upon stimulus (ii), transcriptional activity at enh
with local transcription and increases in RNAPII recruitment at the target gene promoter. (iii) Gene expression may lag behind
Chromatin interactions place regulatory elements in close physical proximity. The individual properties of regulatory elements (c
RNAPII recruitment strengths) as well as context-dependent properties (such as promoter competition, insulation, and core p
formation of multiple regulatory interactions (Box 1). Via regulatory cooperation, multiple regulatory elements may increase the
co-activators, and RNAPII) needed for transcription in RNAPII-enriched foci (i) and thereby achieve in aggregate different levels
RNAPII foci, including fewer regulatory elements (ii). Nucleosome illustrations in (A) reproduced, with permission, from [38]; (
428
Weak enhancer
Enhancement
Target
gene promoter
(B)
Enhancer strength
Hypothesis:
strong enhancers are strong promoters
Promoterstrength
?
Stong enhancer
Enhancement
Target
gene promoter
Enhancement
(A)
Enhancer strength
Promoterstrength
Hypothesis:
weak promoters are strong enhancers
Strong promoter
No or minor
enhancement
Target
gene promoter
Weak promoter Target
gene promoter
?
RNAPII
TranscripƟon
TRENDS in Genetics
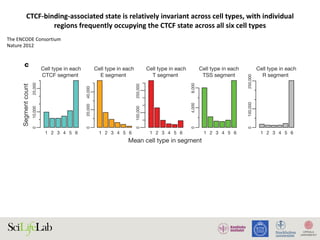
Figure 4. Chromatin interactions and strength of regulatory elements determine transcriptional activities. (A) Competition between individual regulatory elements may
Opinion Trends in Genetics August 2015, Vol. 31, No. 8
Andersson R et al. TiG 2015](https://image.slidesharecdn.com/imbim-igp20151127-amb-160314225820/85/Imbim-igp-20151127-amb-part1b-62-320.jpg)
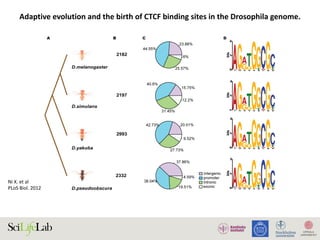
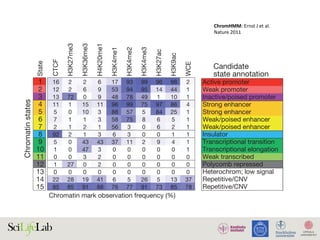
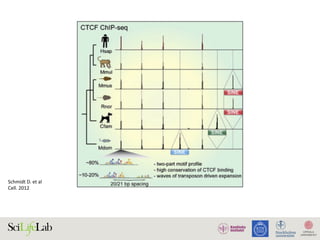
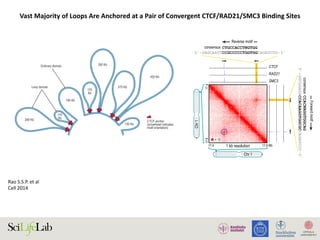
![Ni X. et al
PLoS Biol. 2012
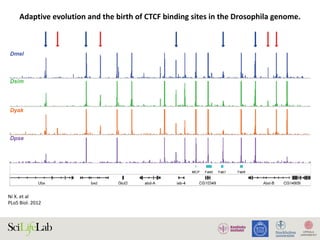
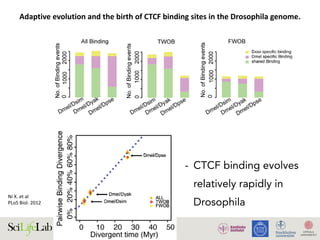
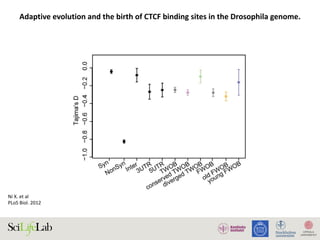
Adaptive evolution and the birth of CTCF binding sites in the Drosophila genome.
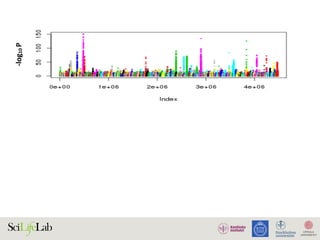
Figure 4. Functional consequences of CTCF binding evolution. (A–B) CTCF binding evolution is associated with gene expression evolution.
The bar plots show the proportion of genes with diverged expression between (A) D. melanogaster/D. simulans and (B) D. melanogaster/D. yakuba
comparisons associated with different groups of CTCF binding sites: Genome-wide (black), Conserved TWOB (pink), Diverged TWOB (green), Old
FWOB (orange), and Young FWOB (light purple). The table below each bar plot shows the number of genes with diverged and conserved gene
expression in the corresponding comparisons and associated with the corresponding CTCF binding sites. For each groups of CTCF binding sites, the
associated genes are the union of the nearest gene to each binding site. The evolutionary status of gene expression (conserved or diverged) is
determined using triplicate WPP mRNA-seq data through a generalized linear regression framework. Label abbreviations are the same as described in
Figure 3. Significance levels: * p,0.05; **p,0.01; one-sided Fisher’s exact test. (C–E) CTCF binding evolution is correlated with new gene origination.
The four colored wiggle tracks in each of the plots show the ChIP CDP enrichment scores of the four species (D. melanogaster, blue; D. simulans,
green; D. yakuba, orange; D. pseudoobscura, purple) across different genomic regions. CTCF binding peaks are observed in D. melanogaster, D.
simulans, and D. yakuba at flanking genomic regions of newly evolved genes TFII-A-S2 (C) and CheB93a (D). The two genes both originated after the
split of the melanogaster group with the pseudoobscura group. CTCF binding peak is only observed in the D. melanogaster genome in the flanking
genomic regions of D. melanogaster lineage-specific gene sphinx (E).
doi:10.1371/journal.pbio.1001420.g004
PLOS Biology | www.plosbiology.org 8 November 2012 | Volume 10 | Issue 11 | e1001420
Figure 4A,B). Such correlation is also observed when using
microarray data for inferring gene expression divergence (Figure
S14) as well as when using high-sequence coverage sites (Figure
S15). These observations indicate that CTCF binding evolution
impacts gene expression evolution, which previously has been
shown to evolve rapidly and to be shaped by selection in these
species at the WPP stage [51,52].
Selection on gene expression can lead to adaptive evolutionary
signatures in cis-regulatory elements. Indeed, in Drosophila,
adaptive gene expression has been linked to adaptive cis-DNA
evolution [53]. We thus hypothesized that the stronger positive
selection signature observed in the diverged TWOBs might stem
from the sites being associated with diverged expression that has
more directly been subject to natural selection. We calculated and
compared a values for two additional subgroups of TWOB sites:
diverged TWOBs near genes with divergent expression and
conserved TWOBs near genes with conserved expression.
Consistent with our hypothesis, we observed a larger difference
in a values between these two subgroups than between all
conserved and diverged TWOBs (Figures S16 and S17).
CTCF Binding Evolution Is Correlated with the Origin of
New Genes
CTCF binding sites in Drosophila have been associated with
syntenic break points, consistent with their role in delineating the
regulatory architecture of genes [13]. We wished to determine
whether CTCF binding evolution correlates with any other
genome structural evolution. New genes are defined as genes
Adaptive Evolution of CTCF Binding Sites](https://image.slidesharecdn.com/imbim-igp20151127-amb-160314225820/85/Imbim-igp-20151127-amb-part1b-68-320.jpg)
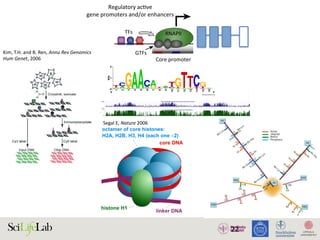
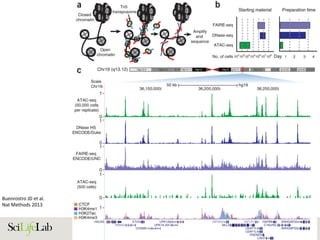
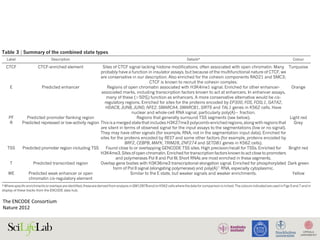
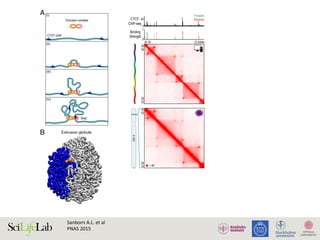
![Ni X. et al
PLoS Biol. 2012
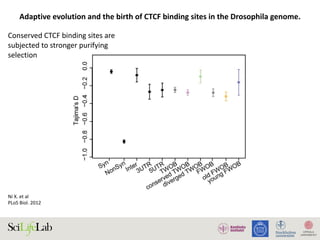
Adaptive evolution and the birth of CTCF binding sites in the Drosophila genome.
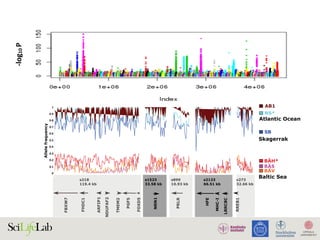
Figure 4. Functional consequences of CTCF binding evolution. (A–B) CTCF binding evolution is associated with gene expression evolution.
The bar plots show the proportion of genes with diverged expression between (A) D. melanogaster/D. simulans and (B) D. melanogaster/D. yakuba
comparisons associated with different groups of CTCF binding sites: Genome-wide (black), Conserved TWOB (pink), Diverged TWOB (green), Old
FWOB (orange), and Young FWOB (light purple). The table below each bar plot shows the number of genes with diverged and conserved gene
expression in the corresponding comparisons and associated with the corresponding CTCF binding sites. For each groups of CTCF binding sites, the
associated genes are the union of the nearest gene to each binding site. The evolutionary status of gene expression (conserved or diverged) is
determined using triplicate WPP mRNA-seq data through a generalized linear regression framework. Label abbreviations are the same as described in
Figure 3. Significance levels: * p,0.05; **p,0.01; one-sided Fisher’s exact test. (C–E) CTCF binding evolution is correlated with new gene origination.
The four colored wiggle tracks in each of the plots show the ChIP CDP enrichment scores of the four species (D. melanogaster, blue; D. simulans,
green; D. yakuba, orange; D. pseudoobscura, purple) across different genomic regions. CTCF binding peaks are observed in D. melanogaster, D.
simulans, and D. yakuba at flanking genomic regions of newly evolved genes TFII-A-S2 (C) and CheB93a (D). The two genes both originated after the
split of the melanogaster group with the pseudoobscura group. CTCF binding peak is only observed in the D. melanogaster genome in the flanking
genomic regions of D. melanogaster lineage-specific gene sphinx (E).
doi:10.1371/journal.pbio.1001420.g004
PLOS Biology | www.plosbiology.org 8 November 2012 | Volume 10 | Issue 11 | e1001420
Figure 4A,B). Such correlation is also observed when using
microarray data for inferring gene expression divergence (Figure
S14) as well as when using high-sequence coverage sites (Figure
S15). These observations indicate that CTCF binding evolution
impacts gene expression evolution, which previously has been
shown to evolve rapidly and to be shaped by selection in these
species at the WPP stage [51,52].
Selection on gene expression can lead to adaptive evolutionary
signatures in cis-regulatory elements. Indeed, in Drosophila,
adaptive gene expression has been linked to adaptive cis-DNA
evolution [53]. We thus hypothesized that the stronger positive
selection signature observed in the diverged TWOBs might stem
from the sites being associated with diverged expression that has
more directly been subject to natural selection. We calculated and
compared a values for two additional subgroups of TWOB sites:
diverged TWOBs near genes with divergent expression and
conserved TWOBs near genes with conserved expression.
Consistent with our hypothesis, we observed a larger difference
in a values between these two subgroups than between all
conserved and diverged TWOBs (Figures S16 and S17).
CTCF Binding Evolution Is Correlated with the Origin of
New Genes
CTCF binding sites in Drosophila have been associated with
syntenic break points, consistent with their role in delineating the
regulatory architecture of genes [13]. We wished to determine
whether CTCF binding evolution correlates with any other
genome structural evolution. New genes are defined as genes
Adaptive Evolution of CTCF Binding Sites
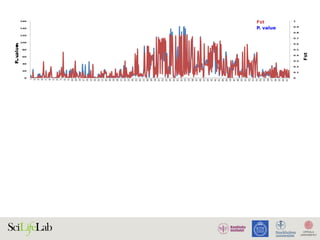
CTCF-binding
sites are shaped
by natural
selection and
influence gene
expression
patterns](https://image.slidesharecdn.com/imbim-igp20151127-amb-160314225820/85/Imbim-igp-20151127-amb-part1b-69-320.jpg)


The document discusses the importance of examining the genome in three dimensions to better understand gene regulation and expression. It emphasizes the roles of transcription factors and general transcription factors in mediating the transcription process at various regulatory elements. Active regulatory elements are highlighted as crucial for gene expression, and their interactions with core promoters and enhancers are analyzed.


![Transcriptional regulation [autosaved]](https://cdn.slidesharecdn.com/ss_thumbnails/transcriptionalregulationautosaved-210320110055-thumbnail.jpg?width=640&height=640&fit=bounds)


