Imaging in prostatic patholgy
•Download as PPTX, PDF•
3 likes•98 views

Imaging in prostatic patholgy by Dr. Milan Silwal

Recommended
More Related Content
What's hot
What's hot (20)
Similar to Imaging in prostatic patholgy
Similar to Imaging in prostatic patholgy (20)
More from Milan Silwal
More from Milan Silwal (20)
Recently uploaded
Recently uploaded (20)
Imaging in prostatic patholgy
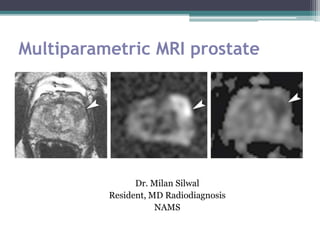
- 1. Multiparametric MRI prostate Dr. Milan Silwal Resident, MD Radiodiagnosis NAMS
- 2. Outline of presentation • Normal anatomy. • Imaging modalities. • Prostatic carcinoma. • Multiparametric MR imaging. • PIRADS. • Conclusions.
- 3. NORMAL ANATOMY • The prostate is a tuboalveolar exocrine gland located inferior to the bladder and anterior to the rectum. • The conical prostate gland surrounds the uppermost aspect of the urethra and is enveloped by an incomplete fibromuscular capsule. • The anatomic zonal architecture of the prostate gland is divided into : peripheral zone, central zone, transitional zone, and anterior fibromuscular stroma . .
- 4. Peripheral zone • Contains approximately 70% of prostate tissue and is draped around the remainder of the gland like a ‘catcher's glove’ holding a baseball. • Most prostate cancers (70%) arise in the peripheral zone
- 5. Transitional zone • Consists of small areas of peri-urethral glandular tissue. • It contains only 5% of prostatic tissue in the normal young man, it is the site of benign prostatic hypertrophy • About 20% of prostate cancer arise from this zone.
- 6. Central zone • Consists of the glandular tissue at the base of the prostate through which course the ducts of the vas deferens and seminal vesicles and the ejaculatory ducts. • The central zone makes up 25% of glandular tissue • Approximately 5-8% of cancers arise in this zone.
- 7. • Non glandular tissue in anterior portion of prostate – Fibromuscular stroma. • The gland contains a base superiorly, a mid-gland, and an apex inferiorly. • The base of the prostate is that portion adjacent to the base of the bladder and the seminal vesicles • The apex of the prostate rests on the urogenital diaphragm.
- 8. Diagram of prostate zonal anatomy. This is the anatomy in a young man because the transition zone (white areas) is small. The transition zone will undergo marked enlargement in older men with benign prostatic hyperplasia. A, Coronal section at midprostate level. B, Sagittal midline section. C, Parasagittal section. D, Axial section through base. E, Axial section through apex.
- 9. • Supplied by prostatic branch of inferior vesical artery, a branch of the internal iliac artery. • Drained by prostatic venous plexus in communication with the pudendal plexus to the deep dorsal vein (to the internal iliac vein) with some communication to the Batson vertebral venous plexus which offers a route for the hematogenous spread of tumor in axial skeleton. • Lymphatic drainage of the prostate goes to regional pelvic lymph nodes (obturator and internal iliac nodes) with channels to paraaortic and inguinal nodes.
- 11. MR ANATOMY • On TlWI, the prostate gland is uniform intermediate to low signal similar to skeletal muscle. • The high signal periprostatic fat defines the margin of the prostate. • Prostatic veins and neurovascular bundles are low signal. • The peripheral zone is high in signal due to higher water content and looser acinar structure.
- 12. • The central zone is lower in signal due to more compact muscle fibers and acinar structure. • The central and transitional zones become heterogeneous with age and the development of benign prostatic hyperplasia. • The anterior fibromuscular stroma is low in signal and has poorly defined margins.
- 13. Prostate anatomy. A, The prostate gland is composed of the central gland (CG), which consists of the central zone and the transitional zone as well as the peripheral zone (PZ) and anterior fibromuscular stroma (AFMS). B, The paired seminal vesicles are perched posterolateral to the prostate gland. CZ, central zone; PZ, peripheral zone.
- 14. Imaging Modalities • USG and TRUS • CT scan • MRI • MRS • PET • Radionuclide scan
- 15. MRI • T1WI: gland is of intermediate signal intensity; • T2W: peripheral zone- hyperintense, central gland, anterior fibromuscular stroma, prostatic capsule- low signal; Periprostatic venous plexus-high signal. • Seminal vesicles- convoluted, tubular structures, posterior & superior to base; appear as grapes. On T2- low signal walls with high signal contents. • Neurovascular bundles- 5 & 7’ o clock as punctate signal voids. • More accurate in volume calculation
- 16. Normal zonal anatomy of the prostate gland. On TRUS the difference between a more echogenic peripheral zone (P) and less echogenic transition zone (T) is well appreciated. The same differentiation can be made on the endorectal MR T2-weighted images as the peripheral zone (P) demonstrates a higher signal intensity than the transition zone (T). Small arrows = ejaculatory ducts, long arrows = prostatic capsule, curved arrows =neurovascular bundles P
- 17. Contd. Compared with TRUS , MRI has following advantages • Much larger field of view in order to identify adenopathy. • Relatively operator independent reproducibility of imaging plane and image quality on follow up studies • Better tissue characterisation especially for complex lesions such as post operative studies or bleeding adenomas Advantage of TRUS :can be used for guided biopsy of suspicious hypoechoic lesion and less expensive.
- 18. MR spectroscopy • Noninvasive technique to determine molecular metabolism within the body • Metabolites are measured based on their slightly difference magnetic frequencies or chemical shifts. • In many pathological processes metabolic changes precede anatomic changes during disease progression • Early detection of new disease and therapeutic success or failure.
- 19. Contd. • Informations about physical and chemical properties of the tissue sample are obtained in the form of spectrum called MRS. • MRI and MRS: based on same fundamental principle. • MRI provides anatomic information as a visual image whereas MRS obtains chemical information as a spectrum or numerical values.
- 20. Cancer prostate at the peripheral zone with high Choline peak and a low Citrate peak are evident.
- 21. Ca Vs benign on MRS • In normal prostate and BPH increased level of citrate & low choline is observed on proton MRS. • In prostatic carcinoma, there is absent or decreased citrate level and rise in choline. • Tumor regression is similarly associated with fall in choline levels.
- 22. Prostatic Specific Antigen (PSA) • <1.5 ng/ml : Normal • 2.0–3.9 ng/mL : High normal • 4.0–10 ng/mL : Intermediate range • 10 ng/mL : High range
- 23. PSA density • PSA density = Total PSA/ prostate volume in cc^3), high in cancer patients than normal. • PSA density >= 0.15, proposed as the threshold for biopsy in men with PSA levels of 4–10 ng/mL. PSA Velocity • It is the rate of PSA rise over time. • In the 4 to 10–ng/mL PSA group, with three PSA tests performed over 2 years & velocity exceeds 0.75 ng/mL/yr, this rapid change distinguishes men with cancer from those with BPH with a specificity of 90%. • Higher velocities are associated with increased cancer aggressiveness.
- 24. MR Imaging Techniques Anatomic T2-weighted MR Imaging; • Work-horse of prostate MR imaging. • High spatial resolution. • Rapid acquisition with refocused echo sequences with a small field of view, performed with endorectal and/or external body phased-array coils. • On T2-weighted images, prostate cancer can appear as an area of low signal intensity within the high signal intensity of a normal peripheral zone. • BPH itself is a round, well-defined, inhomogeneous area with (variable) intermediate signal intensity and a low signal- intensity rim that surrounds the expanded transition zone.
- 26. At level of midprostate to apex, a low-signal-intensity lesion is present on the right side of the prostate, within the high signal intensity of the peripheral zone (outline), with signs of minimal capsular invasion (arrow). Prostatectomy prostate cancer, corresponded to stage T3a (extracapsular extension of 5 mm). At midprostate level, a homogeneous low signal intensity area in the ventral transition zone is seen (outline), with loss of visibility of healthy BPH structures (“charcoal sign”). Invasion of anterior fibromuscular stroma at the ventral prostate can be seen (arrows). This lesion was suspicious for transition zone cancer. At prostatectomy, stage T2c, Gleason score 6 prostate cancer was found.
- 27. Limitation of T2-weighted imaging • Focal areas of low signal intensity in the peripheral zone do not always represent cancer. • Benign abnormalities with low signal intensity: chronic prostatitis, Atrophy Scars Postirradiation or hormonal treatment effects Hyperplasia, Postbiopsy hemorrhage • Low-signal-intensity lesions with a wedge shape and a diffuse extension without mass may be reliable signs of benignity.
- 28. Malignancy in Transitional Zone Features are: • Homogeneously low T2-weighted signal intensity. • Ill-defined irregular edges of the suspicious lesion. • Invasion into the urethra or the anterior fibromuscular stroma. • Lenticular shape.
- 29. Dynamic contrast enhanced MR Imaging • Prostate is highly vascular organ. • Pre and post gadolinium contrast images are not sufficient for cancer detection. • Resultant changes in vascular characteristics can be studied well with dynamic contrast-enhanced MR imaging. • DEC MR imaging consists of a series of fast T1W sequences covering entire prostate before & after rapid injection (2–4 mL/sec) of a bolus of a lowmolecular- weight gadolinium chelate such as gadoterate meglumine or gadopentetate dimeglumine.
- 30. • Assessment of signal intensity changes on T1W DEC MR images to estimate contrast agent uptake in vivo can be performed qualitatively, semiquantitatively or quantitatively. • Qualitative analysis of signal intensity changes can be achieved by assessing the shape of the signal intensity– time curve. • Semiquantitative parameters {a)integral area under the gadolinium-concentration–time curves, (b) wash-in gradient (upward slope of First pass), maximum signal intensity,(c) time-to-peak enhancement, and (d) start of enhancement}.
- 31. DEC MR imaging of prostate cancer in 65Y/M with PSA level of 8.3 ng/mL, clinical stage T2c cancer, and Gleason score of 7 (3+4) in 80% of the volume of systematic random biopsy specimens . (a, b) Axial DEC T2-weighted MR images obtained at midprostate level, with superimposed K trans (volume transfer constant) parametric map on a and washout parametric map on b. (a) Right peripheral zone (outline) shows contrast enhancement (red) that is suspicious for prostate cancer. (b) In addition to the transition zone (arrow), right peripheral zone (outline) shows increased washout. (c) Relative gadolinium concentration (y- axis)-time (x-axis ) curve of tumor shows a type 3 curve with fast increase, fast time to peak, and washout, which are suspicious for cancer.
- 32. Diffusion Weighted Imaging(DWI) • DWI is a fast, simple and readily available MR imaging technique for prostate cancer. • Nevertheless, DW imaging of the prostate has the limitation of low in-plane spatial resolution, even at 3T. • Healthy prostatic tissue has high ADC values whereas prostatic cancer has low ADC values. • Diffusion is restricted in prostatic cancer due to destruction o f normal glandular structure and higher cellular density than normal tissue.
- 33. DWI of prostate cancer. Axial ADC maps obtained at mid prostate (a) Lesion with low ADC is suspicious for cancer in right peripheral zone (arrows). This indicates intermediate to high cancer aggressiveness. (b) Comma-shaped area with low ADC (mean ADC = 0.6 3 10 2 3 mm 2 /sec) is seen in ventral transition zone (arrows). This indicates intermediate to high cancer aggressiveness.
- 34. Proton MRS Imaging • The dominant peaks observed in these spectra are from protons in citrate (approximately 2.60 ppm), creatine (3.04 ppm) and choline compounds (approximately 3.20 ppm). • Polyamine signals (mostly from spermine) also may be observed (approximately 3.15 ppm). • Compared with healthy peripheral tissue or BPH tissue, citrate signals are reduced and those of choline compounds are often increased in prostate cancer tissue
- 35. MR spectroscopic imaging in a 70-year-old man with a PSA level of 12 ng/mL and well-differentiated prostate cancer. (a) Axial T2W turbo spin-echo MR Image shows stage T3a prostate cancer. Radical prostatectomy revealeda solitary Gleason score 7 (3+4) adenocarcinoma with extraprostatic extension. Red voxel placed in low-signal-intensity lesion in left peripheral zone, which is suspicious for cancer; blue voxelhas been placed in benign- appearing region in right peripheral zone. (b) MR spectrum from red voxel-choline peak that is increased relative to citrate peak. The choline plus creatine–to-citrate ratio, calculated from the integrals of the spectral peaks from choline, creatine, and citrate, is 0.80, which is suspicious for prostate cancer. (c) MR spectrum from blue voxel -low choline peak and high citrate peak, consistent with benign peripheral zone tissue. The choline plus creatine–to-citrate ratio is 0.32.
- 36. Multi-parametric MR imaging • Minimal requirements for a multiparametric MR imaging protocol include a combination of T1- and T2-weighted MR imaging with DW and dynamic contrast- enhanced MR imaging. • For detection and localization of lesions, the use of a phased-array coil is sufficient; • For staging indications, combination with an endorectal coil may be preferred.
- 37. Multiparametric MR imaging for prostate cancer localization in the transition zone in a 67-year old) (a)Axial T2-weighted turbo spin-echo image obtained at the level of the base of the prostate shows area of lower signal in the right ventral prostate (outline), which is suspicious for prostate cancer. Bulging is present as a sign of stage T3 disease (arrows). (b) Axial MR image with superimposed Kt rans parametric map (Mediodorsal part of the prostate shows early enhancement (outline) but no increased K trans at low-signal- intensity area in a. (c) On axial ADC obtained at same level as a, the right ventral transition zone (outline) shows restriction , which suggests highly aggressive cancer.
- 38. Multiparametric MR imaging of the prostate cancer (PSA level of 8.3 ng/mL, clinical stage T2c, Gleason score of 7 Views of multiplanar multiparametric images (A–E), quantitative information ( F) is also displayed. A–E show tumor with bulging, suspicious for minimal stage T3A disease, in right peripheral zone at level of midprostate to apex (arrow). A , Axial K t rans mapfrom dynamic contrast-enhanced MR imaging projected over T2-weighted image . B, Sagittal T2-weighted imawith color overlay showing washout (from dynamic contrast-enhanced MR imaging). C, Axial ADC map D, Axial DW trace image ( b = 800 sec/mm 2 ). E, Axial T2-weighted image. F, Relative gadolinium concentration–time curve (left) and MR spectrum (right) from chosen point of interest in tumor (+). In MR spectrum, choline (chol) and citrate ( cit) peaks can be evaluated. The low-signal-intensity lesion on E shows increased K t rans (on A ), restriction on C , high signal intensity on D , gadolinium concentration–time curve type 3 and high choline peak on F.
- 39. Criteria for extracapsular invasion • Periprostatic tumor stranding • (asymmetric) low signal intensity in the seminal vesicles • Asymmetry of the neurovascular bundle, • Obliteration of the rectoprostatic angle, • Irregular and local bulging of the prostatic contour (step-off or angulation) • Low signal intensity in the rectoprostatic fat • Overt extracapsular cancer.
- 40. • Levator ani involvement- localized high SI on T2WI • Rectal inv- Demonstrated in 2 planes; disruption of rectal wall. • Invasion of bladder base -T2WI : Interruption of the low intensity signal of UB wall.
- 41. GLEASON SCORING SYSTEM • The Gleason score determines the histological grading of prostate cancer. • A score of 1 to 5 is assigned to each of the two largest areas of tumour involvement in the samples obtained, based on the worst feature.(1: least aggressive,5: most aggressive). • These two scores are then added together to a Gleason score of 1-10. • This final score can then be grouped variably into histopathologic grades which correlate with progression free survival.
- 42. 2-4 (low grade): • 100% progression free at 5 years • 95.6% progression free at 10 years 5-6: • 96.9% progression free at 5 years • 81.9% progression free at 10 years 7: • 76.9% progression free at 5 years • 51.4% progression free at 10 years 8-9: • 59.1% progression free at 5 years • 34.9% progression free at 10 years
- 43. STAGING
- 44. PIRADS – ASSESMENT PI-RADS (Prostate Imaging Reporting and Data System) The score is assessed on prostate MRI. Images are obtained using a multi-parametric technique including T2 weighted images, a dynamic contrast study (DCE) and DWI. If DCE or DWI are insufficient for interpretation the newest guidelines recommend omitting them in the scoring. Currently, MR spectroscopy is not included in PI- RADS scoring. A score is given according to each variable. The scale is based on a score from 1 to 5 (which is given for each lesion), with 1 being most probably benign and 5 being highly suspicious of malignancy:
- 45. Scoring Scheme within PI-RADS Version 2 for Peripheral and Transition Zone Abnormalities on the Basis of Their Appearance on ADC Maps and High–b Value Diffusion-weighted MR Images
- 46. Scoring Scheme within PI-RADS Version 2 for Peripheral Zone Abnormalities on the Basis of Their Appearance on T2-weighted MR Images
- 47. Scoring Scheme within PI-RADS Version 2 for Transition Zone Abnormalities on the Basis of Their Appearance on T2-weighted MR Images
- 48. Flowchart showing the PI-RADS version 2 assessment categories. DCE = dynamic contrast-enhanced MR imaging, T2-WI = T2-weighted MR imaging.
- 49. Images of a 62 Y with prostate cancer (Gleason score, 4 + 4) detected at systematic transrectal ultrasonography (US)–guided biopsy, who was referred for multiparametric MR imaging staging (PIRADS- 5) (a) Axial T2WI-a hypointense focal lesion (black arrow) in the right posterolateral and anterior peripheral zone at the midgland; the lesion has an irregular or spiculated margin (white arrows) and a tumor-capsule interface of more than 1 cm, findings consistent with extraprostatic extension (T2- weighted imaging score: 5) (b) & (c) ADC map and computed high–b value (1500 sec/mm2) diffusion- weighted MR image (c) show a 2.3-cm lesion that is markedly hypointense on the ADC map (arrows on b) and markedly hyperintense on the diffusion-weighted MR image (arrows on c) (DWI- ADC score: 5). (d) Axial dynamic contrast- enhanced T1-weighted MR image shows early enhancement (or early phase wash-in) of the lesion (arrows) relative to the rest of the gland,
- 50. Post-treatment appearances and recurrent disease • After radiation or hormonal therapy, the prostate often becomes low signal on T2WI, an appearance that should not be confused with tumour recurrence. • The seminal vesicles can also become deformed and show low-signal change but may retain small focal areas of high-signal fluid. • After a time, the peripheral zone of the prostate may revert to its normal high signal on T2WI.
- 51. • Following treatment, a patient with prostatic carcinoma is monitored for recurrent tumour by serial serum PSA levels. • Patients with rising levels normally have to be evaluated with isotope bone scintigraphy, to identify disease in the skeleton and MRI, to identify disease in the residual prostate or prostatic bed, and lymph node enlargement within the pelvis and retroperitoneum. • The presence of an irregular new low-to-intermediate signal intensity mass on the T2-weighted images is highly suspicious of recurrent disease.
- 52. Conclusion • To increase MR imaging accuracy for the different clinical prostate cancer indications, one or more functional MR imaging techniques should be combined with T2-weighted MR imaging in a multiparametric MR examination of the prostate. • Suggested minimal requirements for a multiparametric MR imaging protocol for clinical evaluation of prostate cancer are T1- and T2- weighted MR imaging in combination with DW and dynamic contrast-enhanced MR imaging.
- 53. • T1-and T2-weighted MR imaging should be used for evaluation of anatomy. • Dynamic contrast-enhanced MR imaging can be used for high-sensitivity identification of potential prostate cancer locations (Little standarisation). • DW imaging or MR spectroscopic imaging are accurate functional MR techniques, and they may be added to improve specificity for different clinical indications.
- 54. References • CT and MRI of Whole Body- John Haaga. • Prostate Cancer: Multiparametric MR Imaging for Detection, Localization, and Staging Caroline M. A. Hoeks et al; Radiographics 2011. • Characterization of Prostate Lesions as Benign or Malignant at Multiparametric MR Imaging: Tiphaine Vaché et al;Radiographics 2014. • PI-RADS Version 2: A Pictorial Update: Andrei S. Purysko, MD et al; RadioGraphics 2016.
- 55. THANK YOU
Editor's Notes
- Post biopsy hemorrhage can be easily differentiated by T1WI, so 8 weeks interval of biopsy and MRI to allow reduction of the artifacts.
- Named after Donald Gleason, American (US) pathologist (1920-2008).