IMAGING ALGORITHM DEVELOPMENT
•Download as DOCX, PDF•
0 likes•208 views

This document defines measurable aspects and features that can be extracted from histograms and temperature graphs related to vascular assessment. It outlines several potential metrics that provide quantitative values, such as peak to peak temperature, time to peak, recovery temperature, and peak to valley pixels. These metrics measure properties like baseline temperature, load pressure, reactive hyperemic response, and blood flow over time.

More Related Content
What's hot
What's hot (18)
Viewers also liked
Viewers also liked (10)
More from Mary O'Donnell Meldrum
More from Mary O'Donnell Meldrum (15)
IMAGING ALGORITHM DEVELOPMENT
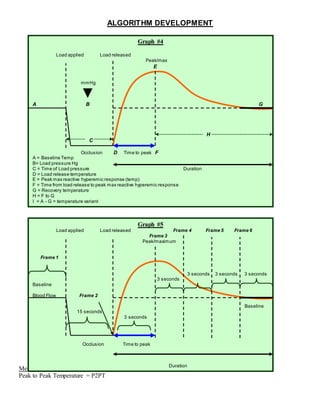
- 1. ALGORITHM DEVELOPMENT Measurable aspects of Histograms: Features that produce actual values & their definitions: Peak to Peak Temperature = P2PT Graph #4 Load applied Load released Peak/max E mmHg ▼ A B G H C Occlusion D Time to peak F A = Baseline Temp B= Load pressure Hg C = Time of Load pressure Duration D = Load release temperature E = Peak max reactive hyperemic response (temp) F = Time from load release to peak max reactive hyperemic response G = Recovery temperature H = F to G I = A - G = temperature variant Graph #5 Load applied Load released Frame 4 Frame 5 Frame 6 Frame 3 Peak/maximum Frame 1 3 seconds 3 seconds 3 seconds 3 seconds Baseline Blood Flow Frame 2 Baseline 15 seconds 3 seconds Occlusion Time to peak Duration
- 2. Peak to Peak Pixels = P2PP Peak to Valley Pixels (amplitude in pixels) = P2VP Peak to Valley Temperature = P2VT Highest Temperature to Lowest Temperature = HTLT Highest Pixel to Lowest Pixel =HPLP Number of Peaks in Series = NSP Length (or number) of Pixels in Series = LPS