Recommended
PDF
Lecture 7 - Histogram Equalization and Histogram Matching.pdf
PPTX
Histogram based Enhancement
PPTX
Histogram based enhancement
PPTX
PPTX
Discrete fourier and cosine transform (DCT,DFT)
PPT
PPT
PPT
PPTX
ch-2.2 histogram image processing .pptx
PDF
PPT
PPT
G Intensity transformation and spatial filtering(1).ppt
PPTX
Histogram equalization and matching - Digital Image Processing
PPT
Image processing and pattern recognition 3.ppt
PPT
Histogram.ppt Histogram equilization to improve the image quality
PDF
PDF
PPTX
Histogram problem Ppt.pptx
PPTX
Week 3_Ch 3_Image Enhancement in the spatial domain.pptx
PPTX
Image Enhacement for the image improvement
PPT
05 histogram processing DIP
PPT
PPT
PDF
Histogram Operation in Image Processing
PPT
Image Enhancement and Histogram Equalization in Digital Image Processing.ppt
PDF
Study on Contrast Enhancement with the help of Associate Regions Histogram Eq...
PDF
Contrast enhancement using various statistical operations and neighborhood pr...
PPTX
Computer vision labs for improving in the subject
PDF
Top 5 Best Dedicated Server Providers in Los Angeles (Updated Edition)
PPTX
Visual Foxpro-VFP9-Access-Report-Variable-Outside-the-report.pptx
More Related Content
PDF
Lecture 7 - Histogram Equalization and Histogram Matching.pdf
PPTX
Histogram based Enhancement
PPTX
Histogram based enhancement
PPTX
PPTX
Discrete fourier and cosine transform (DCT,DFT)
PPT
PPT
PPT
Similar to Image processing lab4.pdf image processing
PPTX
ch-2.2 histogram image processing .pptx
PDF
PPT
PPT
G Intensity transformation and spatial filtering(1).ppt
PPTX
Histogram equalization and matching - Digital Image Processing
PPT
Image processing and pattern recognition 3.ppt
PPT
Histogram.ppt Histogram equilization to improve the image quality
PDF
PDF
PPTX
Histogram problem Ppt.pptx
PPTX
Week 3_Ch 3_Image Enhancement in the spatial domain.pptx
PPTX
Image Enhacement for the image improvement
PPT
05 histogram processing DIP
PPT
PPT
PDF
Histogram Operation in Image Processing
PPT
Image Enhancement and Histogram Equalization in Digital Image Processing.ppt
PDF
Study on Contrast Enhancement with the help of Associate Regions Histogram Eq...
PDF
Contrast enhancement using various statistical operations and neighborhood pr...
PPTX
Computer vision labs for improving in the subject
Recently uploaded
PDF
Top 5 Best Dedicated Server Providers in Los Angeles (Updated Edition)
PPTX
Visual Foxpro-VFP9-Access-Report-Variable-Outside-the-report.pptx
PPTX
TechSprint Kickoff - Everything You Need to Know
PDF
6 Insights from the Patron Saint of AI Failure
PPTX
Lecture 04. about Black heads and Hackerss.pptx
PPTX
Basics-of-Electronics-and-Core-Components-of-IoT-Systems.pptx
PDF
UiPath Coded Agents - A Developer Driven Agentic Automation Era
PDF
Intro to CrafterQ - AI Agent Platform for the Enterprise.pdf
PPTX
On-Device AI with Gemma 3n and PaliGemma 2 Session Slides - GDG VESIT
PDF
Early Signs of Constraint Loss in Modern System Design
PDF
KM World 2025 Enterprises, KM, & Agentic AI
PDF
Best Bank Statement Converter Software - A Documentation-Based Meta-Analysis ...
PDF
TrustArc Webinar - Unpacking India’s DPDP Act: What You Should Know
PPTX
The Abomination of AI – keynote at ICoSCI 2026
PDF
Saga: The new era of transactions in a microservices architecture
PDF
AI Data Analyst: Smarter Insights for Modern Real Estate Decisions
PDF
Presentation on Four Stroke Engine of Ic engine
PPTX
Full course that Prymehat uploads for you
PPTX
Design Flaws and Known Attacks in Agentic AI - ITI Business Session
PPTX
Oracle SCM Cloud Solutions for Smart Supply Chain Management
Image processing lab4.pdf image processing 1. 3. 4. Histogram Equalization
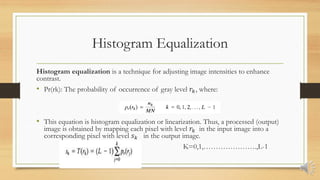
Histogram equalization is a technique for adjusting image intensities to enhance
contrast.
• Pr(rk): The probability of occurrence of gray level 𝑟𝑘, where:
• This equation is histogram equalization or linearization. Thus, a processed (output)
image is obtained by mapping each pixel with level 𝑟𝑘 in the input image into a
corresponding pixel with level 𝑠𝑘 in the output image.
K=0,1,………………….,L-1
5. 6. Histogram Equalization
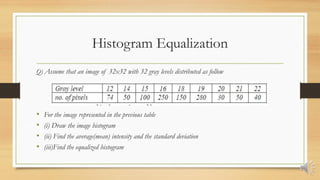
Q) Assume that an image of 32x32 with 32 gray levels distributed as follow
• For the image represented in the previous table
• (i) Draw the image histogram
• (ii) Find the average(mean) intensity and the standard deviation
• (iii)Find the equalized histogram
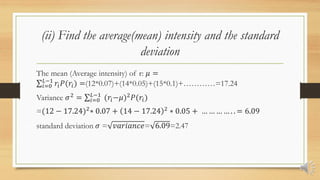
7. 8. 9. 10. (ii) Find the average(mean) intensity and the standard
deviation
The mean (Average intensity) of r: 𝜇 =
𝑖=0
𝐿−1
𝑟𝑖𝑃(𝑟𝑖) =(12*0.07)+(14*0.05)+(15*0.1)+…………=17.24
Variance 𝜎2 = 𝑖=0
𝐿−1
(𝑟𝑖−𝜇)2𝑃(𝑟𝑖)
=(12 − 17.24)2∗ 0.07 + 14 − 17.24 2 ∗ 0.05 + … … … … . . = 6.09
standard deviation 𝜎 = 𝑣𝑎𝑟𝑖𝑎𝑛𝑐𝑒= 6.09=2.47
11. (iii)Find the equalized histogram
𝑠12 =31*(0.07)=2.17 ≅ 2 P(𝑠2)=0.07
𝑠14 = 31 ∗ 0.05 + 0.07 = 3.72 ≅ 4 P(𝑠4)=0.05
𝑠15 = 31 ∗ 0.1 + 0.05 + 0.07 = 6.82 ≅ 7 P(𝑠7)=0.1
𝑠16 = 14.26 ≅ 14 P(𝑠14)=0.24
𝑠18 =18.91≅ 19 P(𝑠19)=0.15
𝑠19 =27.28≅ 27 P(𝑠27)=0.27
𝑠20=28.21≅ 28 P(𝑠28)=0.03
𝑠21 =29.76≅ 30 P(𝑠30)=0.05
𝑠22 =31 P(𝑠31)=0.04
L-1=31
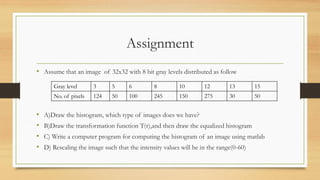
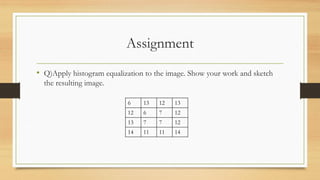
12. 13. Assignment
• Assume that an image of 32x32 with 8 bit gray levels distributed as follow
• A)Draw the histogram, which type of images does we have?
• B)Draw the transformation function T(r),and then draw the equalized histogram
• C) Write a computer program for computing the histogram of an image using matlab
• D) Rescaling the image such that the intensity values will be in the range(0-60)
Gray level 3 5 6 8 10 12 13 15
No. of pixels 124 50 100 245 150 275 30 50
14. 15.