The document contains 14 code snippets demonstrating various Python programming concepts:
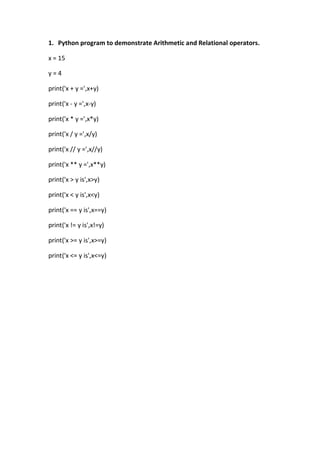
1) Arithmetic and relational operators on integers
2) List methods like insert, remove, append etc.
3) Temperature conversion between Celsius and Fahrenheit
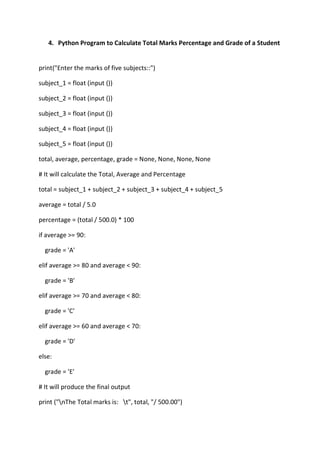
4) Calculating student marks percentage and grade
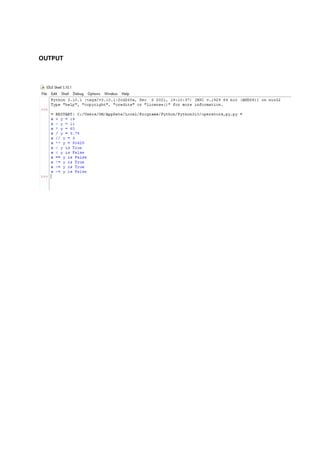
5) Printing Fibonacci series
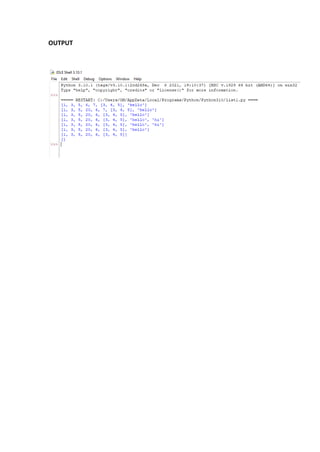
6) Matrix addition and multiplication
7) Function to check if character is a vowel
8) Reading last 5 lines of a file
9) Importing and using math and random modules
10) Multithreading concept
11) Creating a 3D object plot
12) Creating and displaying a histogram
13) Plotting sine, cosine and polynomial curves
14) Creating a pulse vs height graph
![2. Python program to Create a list and perform the following methods 1) insert()
2) remove() 3) append() 4) len() 5) pop() 6) clear()
a=[1,3,5,6,7,[3,4,5],"hello"]
print(a)
a.insert(3,20)
print(a)
a.remove(7)
print(a)
a.append("hi")
print(a)
len(a)
print(a)
a.pop()
print(a)
a.pop(6)
print(a)
a.clear()
print(a)](https://image.slidesharecdn.com/iiimcspythonlab1-240121074903-0d4c0700/85/III-MCS-python-lab-1-pdf-3-320.jpg)
![3. Write a Python program to convert temperatures to and from Celsius and
Fahrenheit.
temp = input("Input the temperature you like to convert? (e.g., 45F, 102C etc.) : ")
degree = int(temp[:-1])
i_convention = temp[-1]
if i_convention.upper() == "C":
result = int(round((9 * degree) / 5 + 32))
o_convention = "Fahrenheit"
elif i_convention.upper() == "F":
result = int(round((degree - 32) * 5 / 9))
o_convention = "Celsius"
else:
print("Input proper convention.")
quit()
print("The temperature in", o_convention, "is", result, "degrees.")
OUTPUT](https://image.slidesharecdn.com/iiimcspythonlab1-240121074903-0d4c0700/85/III-MCS-python-lab-1-pdf-5-320.jpg)

![6. Write a Python program to calculate the sum and product of two compatible
Matrices
X = [[1,2,3],
[4 ,5,6],
[7 ,8,9]]
Y = [[9,8,7],
[6,5,4],
[3,2,1]]
print("Addition of two matrices")
result = [[X[i][j] + Y[i][j] for j in range
(len(X[0]))] for i in range(len(X))]
for r in result:
print(r)
# 3x3 matrix
X = [[12,7,3],
[4 ,5,6],
[7 ,8,9]]
# 3x4 matrix
Y = [[5,8,1,2],
[6,7,3,0],
[4,5,9,1]]
print("Multiplication of two matrices")](https://image.slidesharecdn.com/iiimcspythonlab1-240121074903-0d4c0700/85/III-MCS-python-lab-1-pdf-9-320.jpg)
![# result is 3x4
result = [[0,0,0,0],
[0,0,0,0],
[0,0,0,0]]
# iterate through rows of X
for i in range(len(X)):
# iterate through columns of Y
for j in range(len(Y[0])):
# iterate through rows of Y
for k in range(len(Y)):
result[i][j] += X[i][k] * Y[k][j]
for r in result:
print(r)
OUTPUT](https://image.slidesharecdn.com/iiimcspythonlab1-240121074903-0d4c0700/85/III-MCS-python-lab-1-pdf-10-320.jpg)
![7.Write a function that takes a character and returns true if it is a vowel, false
otherwise.
def vowel(x):
if x in ["a", "e", "i", "o", "u", "A", "E", "I", "O", "U"]:
return "True"
else:
return "False "
a = input ("Enter the letter :- ")
print (vowel(a))
OUTPUT](https://image.slidesharecdn.com/iiimcspythonlab1-240121074903-0d4c0700/85/III-MCS-python-lab-1-pdf-11-320.jpg)

![# opening file using with() method
# so that file get closed
# after completing work
with open(fname) as file:
# loop to read iterate
# last n lines and print it
for line in (file.readlines() [-N:]):
print(line, end ='')
# Driver Code:
if __name__ == '__main__':
fname = 'myfile.txt'
N = 5
try:
LastNlines(fname, N)
except:
print('File not found')](https://image.slidesharecdn.com/iiimcspythonlab1-240121074903-0d4c0700/85/III-MCS-python-lab-1-pdf-13-320.jpg)


![print(random.randint(0, 5))
# print random floating point number between 0 and 1
print(random.random())
# random number between 0 and 100
print(random.random() * 100)
List = [1, 4, True, 800, "python", 27, "hello"]
# using choice function in random module for choosing
# a random element from a set such as a list
print(random.choice(List))
# importing built in module datetime
import datetime
from datetime import date
import time
# Returns the number of seconds since the
# Unix Epoch, January 1st 1970
print(time.time())
# Converts a number of seconds to a date object
print(date.fromtimestamp(454554))](https://image.slidesharecdn.com/iiimcspythonlab1-240121074903-0d4c0700/85/III-MCS-python-lab-1-pdf-16-320.jpg)


![15. Write a Python function that takes two lists and returns True if they
have at least one common member.
def test_includes_any(nums, lsts):
for x in lsts:
if x in nums:
return True
return False
def underline(text):
print("u0332".join(text))
underline("Case - I : No Common Elements")
print(test_includes_any([10, 20, 30, 40, 50, 60], [22, 42]))
def underline(text):
print("u0332".join(text))
underline("Case - II : At least one Common Element")
print(test_includes_any([10, 20, 30, 40, 50, 60], [20, 80]))](https://image.slidesharecdn.com/iiimcspythonlab1-240121074903-0d4c0700/85/III-MCS-python-lab-1-pdf-32-320.jpg)

![16. Write a Python program to print a specified list after removing the
0th,2nd,4th and 5th elements.
color = ['Red', 'Green', 'White', 'Black', 'Pink', 'Yellow','Orange','Blue']
color = [x for (i,x) in enumerate(color) if i not in (0,2,4,5)]
print(color)
OUTPUT](https://image.slidesharecdn.com/iiimcspythonlab1-240121074903-0d4c0700/85/III-MCS-python-lab-1-pdf-34-320.jpg)


![18. Write a python program to change background color of Tkinter Option Menu
widget
# Python program to change menu background
# color of Tkinter's Option Menu
# Import the library tkinter
from tkinter import *
# Create a GUI app
app = Tk()
# Give title to your GUI app
app.title("DRW App")
# Construct the label in your app
l1 = Label(app, text="Choose the week day here")
# Display the label l1
l1.grid()
# Construct the Options Menu widget in your app
text1 = StringVar()
# Set the value you wish to see by default
text1.set("Choose here")
# Create options from the Option Menu
w = OptionMenu(app, text1, "Sunday", "Monday", "Tuesday",
"Wednesday", "Thursday", "Friday", "Saturday")
# Se the background color of Options Menu to green
w.config(bg="GREEN", fg="WHITE")
# Set the background color of Displayed Options to Red
w["menu"].config(bg="RED")](https://image.slidesharecdn.com/iiimcspythonlab1-240121074903-0d4c0700/85/III-MCS-python-lab-1-pdf-37-320.jpg)