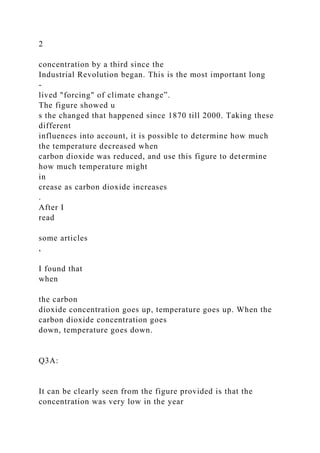
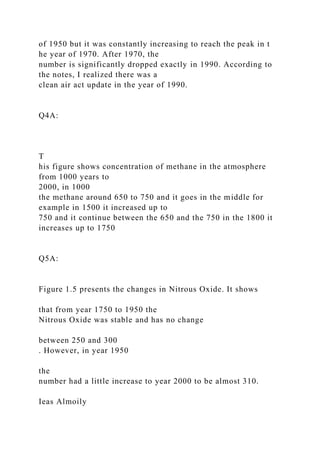
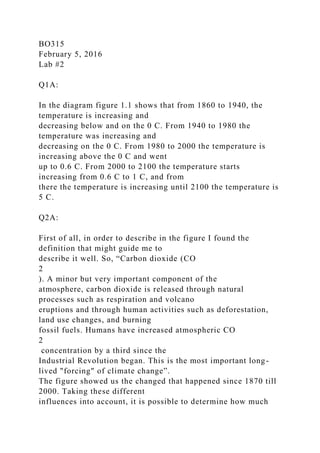
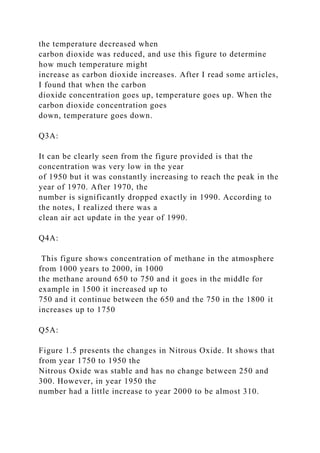
Ieas Almoily
GO315
Mar 23, 2016
Lab #6
Q1A: Lake management is a process. A lake manager displays a
willingness to study a lake, to assess its status and its needs,
and to determine how best to maximize the
lake’s potential as a thriving ecosystem. Lake management can
be as simple as fostering the practices of stewardship among
lake homeowners and other interested individuals. It can also
include taking an active role in altering specific ecological
relationships within the lake and its watershed to make a lake
healthy and keep it healthy. Lake management can also include
protecting the health of a lake ecosystem through a plan of
preventive action. Lake management, to be effective, requires
the coordinated efforts of a group of individuals in the form of a
lake association, sporting or conservation club, or another
organization or group of stewards.
Q2A: Many freshwater lakes, streams, and ponds are polluted.
The causes of pollution depend on many different factors. These
factors vary in different parts of the world. Farming chemicals
can cause algae to bloom. These microscopic organisms can
take over a freshwater habitat like this pond. For example, in
parts of the US, fertilizers and pesticides are two major sources
of pollution. In many farms, chemicals are sprayed on crops to
help them grow and to prevent bugs. When it rains, the extra
fertilizers and pesticides flow into streams.
Q3A: Water pollution affects the health of the waterway, the
health of the organisms living in and around the waterway, and,
eventually, the health of humans. The effects of water pollution
can range from aquatic deformities to contaminated fish to
"dead" lakes. Here are some examples:
1) Aquatic diseases and deformities.
2) Human health issues.
Ieas Almoily
BO315
February 26, 2016
Lab #5
Q1A:
Biotic; the living parts of an ecosystem, the animals, plants and
microorganisms.
B. Abiotic; the non-living parts of ecosystem.
In this image all biotic; fish, plants, sun, animals.
Q2A:
Habitats; have many features or factors that important to the
organisms living there. The two major; physical factor and
biotic factor.
Niche; the adaptive roles of the organism in the system how to
make it live in the environment.
According to university of Arkansas, flamingos lives on coastal
or heavily salted seas. They eat the brine shrimp and brine-flies
that live in the place like salt lake in Utah.
Q3A:
Consumer: wedge tailed eagle, snake, grasshopper, mouse,
rabbit, and kookaburra.
Decomposer: Non
Producers: grass.
Q4A:
The picture could be classified as organism: several of fishes
and other animals living in their environment “water”. Also,
showing a bird having its own environment of food and
producer, which are eggs. The other part of the picture is not
obvious to be described.
Q5A:
The lowest trophic level is the first trophic level. The reason is
that set of organisms that can manufacture their energy and
biomass using only sunlight, drawing inorganic nutrients from
the soil or water. The highest trophic level is the last trophic
level. The reason is that the size of the portion of the diagram
associated with each trophic level is intended to depict the
amount of energy, biomass, or number of individuals found in
each trophic level. There are three numbers represents energy.
10,000 represents the last trophic level, 100 represents the
middle trophic level, and 1 represents the first trophic level.
Q6A:
1st Trophic Level: Producer and it Makes its own food example
of the 1st trophic level
Plants make food.
2nd Trophic level: primary consumer and it consumes producers
example of the 2nd trophic level mice eat plant seeds
3rd Trophic Level: Secondary Consumer and it Consumes
primary consumers example of the 3rd Trophic Level Snakes eat
mice.
4th Trophic level: tertiary consumer and it consumes
secondary consumers example of the 4th Trophic level Hawks
eats snakes
Q7A:
Plants
Animals
Buffalo grass
Barn owl
cattalls
Alligator
Halimeda plant
Green turtle
ocotillo
Camel
Pasque flower
arctic fox
Q8A:
I realized how the term of “ecosystem” is very important to
every individual existence. Ecosystem is very reliable in
keeping individuals alive by ensuring the food supply. We all
know that every species is reliable on others. For instance, if
you take a look to “food chain” you can notice that birds are
relied on plants to be alive, and wild animals are relied on other
animals, and so on. In another word, we have two types of
consumers one is primary consumer, and the other one is
secondary consumers.
Ieas Almoily
BO315
February 26
, 2016
Lab #5
Q1
A:
Biotic; the living parts of an
ecosystem,
th
e animals, plants and
microorganisms.
B. Abiotic; the non
-
living parts of ecosystem.
In this image all biotic; fish, plants, sun, animals.
Q2A:
Habitats; have
many features or factors that important to the organisms living
there. The
two major; physical factor and biotic factor.
Niche; the adaptive roles of the organism in the system how to
make it live in the
environment.
According to university of
Arkansas,
flamingos lives on coastal or heavily salted seas.
They eat the brine shrimp and brine
-
flies that live in the place like salt lake in Utah.
Q3A:
Consumer: wedge tailed eagle, snake, grasshopper, mouse,
rabbit, and kookaburra.
Decomposer: Non
Producers: gr
ass.
Q4
A:
The picture could be classified as organism: several of fishes
and other animals living in
their environment “water”. Also, showing a bird having its own
environment of food and
producer, which are eggs. The other part of the picture is not
obviou
s to be described.
Q5A:
The lowest trophic level is the first trophic level. The reason is
that set of organisms that
can manufacture their energy and biomass using only sunlight,
drawing inorganic
nutrients from the soil or water. The highest trophic
level is the last trophic level. The
reason is that the size of the portion of the diagram associated
with each trophic level is
intended to depict the amount of energy, biomass, or number of
individuals found in each
trophic level. There are three number
s represents energy. 10,000 represents the last
trophic level, 100 represents the middle trophic level, and 1
represents the first trophic
level.
Q6
A:
1st Trophic Level: Producer and it Makes its own food example
of the 1st trophic level
Plants make
food.
Ieas Almoily
BO315
February 26, 2016
Lab #5
Q1A:
Biotic; the living parts of an ecosystem, the animals, plants and
microorganisms.
B. Abiotic; the non-living parts of ecosystem.
In this image all biotic; fish, plants, sun, animals.
Q2A:
Habitats; have many features or factors that important to the
organisms living there. The
two major; physical factor and biotic factor.
Niche; the adaptive roles of the organism in the system how to
make it live in the
environment.
According to university of Arkansas, flamingos lives on coastal
or heavily salted seas.
They eat the brine shrimp and brine-flies that live in the place
like salt lake in Utah.
Q3A:
Consumer: wedge tailed eagle, snake, grasshopper, mouse,
rabbit, and kookaburra.
Decomposer: Non
Producers: grass.
Q4A:
The picture could be classified as organism: several of fishes
and other animals living in
their environment “water”. Also, showing a bird having its own
environment of food and
producer, which are eggs. The other part of the picture is not
obvious to be described.
Q5A:
The lowest trophic level is the first trophic level. The reason is
that set of organisms that
can manufacture their energy and biomass using only sunlight,
drawing inorganic
nutrients from the soil or water. The highest trophic level is the
last trophic level. The
reason is that the size of the portion of the diagram associated
with each trophic level is
intended to depict the amount of energy, biomass, or number of
individuals found in each
trophic level. There are three numbers represents energy. 10,000
represents the last
trophic level, 100 represents the middle trophic level, and 1
represents the first trophic
level.
Q6A:
1st Trophic Level: Producer and it Makes its own food example
of the 1st trophic level
Plants make food.
Ieas Almoily
BO315
February 5, 2016
Lab #2
Q1A:
In the diagram figure 1.1 shows that from 1860 to 1940, the
temperature is increasing and decreasing below and on the 0 C.
From 1940 to 1980 the temperature was increasing and
decreasing on the 0 C. From 1980 to 2000 the temperature is
increasing above the 0 C and went up to 0.6 C. From 2000 to
2100 the temperature starts increasing from 0.6 C to 1 C, and
from there the temperature is increasing until 2100 the
temperature is 5 C.
Q2A:
First of all, in order to describe in the figure I found the
definition that might guide me to describe it well. So, “Carbon
dioxide (CO2). A minor but very important component of the
atmosphere, carbon dioxide is released through natural
processes such as respiration and volcano eruptions and through
human activities such as deforestation, land use changes, and
burning fossil fuels. Humans have increased atmospheric
CO2 concentration by a third since the Industrial Revolution
began. This is the most important long-lived "forcing" of
climate change”. The figure showed us the changed that
happened since 1870 till 2000. Taking these different influences
into account, it is possible to determine how much the
temperature decreased when carbon dioxide was reduced, and
use this figure to determine how much temperature might
increase as carbon dioxide increases. After I read some articles,
I found that when the carbon dioxide concentration goes up,
temperature goes up. When the carbon dioxide concentration
goes down, temperature goes down.
Q3A:
It can be clearly seen from the figure provided is that the
concentration was very low in the year of 1950 but it was
constantly increasing to reach the peak in the year of 1970.
After 1970, the number is significantly dropped exactly in 1990.
According to the notes, I realized there was a clean air act
update in the year of 1990.
Q4A:
This figure shows concentration of methane in the atmosphere
from 1000 years to 2000, in 1000 the methane around 650 to
750 and it goes in the middle for example in 1500 it increased
up to 750 and it continue between the 650 and the 750 in the
1800 it increases up to 1750
Q5A:
Figure 1.5 presents the changes in Nitrous Oxide. It shows that
from year 1750 to 1950 the Nitrous Oxide was stable and has no
change between 250 and 300. However, in year 1950 the number
had a little increase to year 2000 to be almost 310.
Q6A:
In the past 1000 years it was in the middle it goes up and down
but when it reached 1900 it increases about 0.8 in the graph.
However, in the 1250 it increased up to 0.1. In 1900 it starts to
increase up to 0.6 in 2000.
Q7A:
Each of these greenhouse gases affects climate differently.
Some gases can trap the sun’s energy better than others. The
degree to which a gas traps solar energy is called its radiative
forcing value. Radiative forcing values are indicated on the
right axis of the graphs. The higher the radiative forcing value,
the stronger its effect on global warming.
Q8A:
By 2100, the range of temperature increase is expected to be
between 1.4 and 5.6.
Q9A:
North hemisphere appears to have experienced the most
significant temperature changes. Because the northern
hemisphere is warming faster than the southern hemisphere,
with some of the most rapid warming rates on earth located in
the Arctic. Northern hemisphere is winning now and projections
show that, largely due to the influence of manmade greenhouse
gas emissions. Also, the northern hemisphere has led the
southern hemisphere in its rate of warming since about 1980,
largely because the northern hemisphere has more land and less
ocean than the southern hemisphere, and oceans warm relatively
slowly.
Q10A:
AS it’s mentioned in the link “Climate changes affect ecological
systems, and changes in ecological systems influence the
processes of disease transmission. Changes in temperature and
precipitation, as well as extreme climate events such as floods
or droughts, are capable of changing ecological systems. For
example, research links increases in diarrheal disease to
flooding, and cholera outbreaks to warmer sea surface
temperatures. Different weather conditions are known to affect
vector-borne diseases such as malaria and dengue”. The key fact
that I got from this articles the climate change affects the social
and environmental determinants of health – clean air, safe
drinking water such what happened in flint Michigan as you
mentioned in last lecture.
Ieas Almoily
BO315
February 5, 2016
Lab #2
Q1A:
In the diagram figure 1.1 shows that from 1860 to 1940, the
temperature is increasing and
decreasing below and on the 0 C. From 1940 to 1980 the
temperature was increasing and
decreasing on the 0 C. From 1980 to 2000 the temperature is
increasing
above the 0 C and went
up to 0.6 C. From 2000 to 2100 the temperature starts
increasing from 0.6 C to 1 C, and from
there the temperature is increasing until 2100 the temperature is
5 C.
Q2A:
First of all, i
n order to describe in the figure I found the def
inition that might guide me to
describe it well. So, “Carbon dioxide (CO
2
). A minor but very important component of the
atmosphere, carbon dioxide is released through natural
processes such as respiration and volcano
eruptions and through human activities
such as deforestation, land use changes, and burning
fossil fuels. Humans have increased atmospheric CO
2
concentration by a third since the
Industrial Revolution began. This is the most important long
-
lived "forcing" of climate change”.
The figure showed u
s the changed that happened since 1870 till 2000. Taking these
different
influences into account, it is possible to determine how much
the temperature decreased when
carbon dioxide was reduced, and use this figure to determine
how much temperature might
in
crease as carbon dioxide increases
.
After I
read
some articles
,
I found that
when
the carbon
dioxide concentration goes up, temperature goes up. When the
carbon dioxide concentration goes
down, temperature goes down.
Q3A:
It can be clearly seen from the figure provided is that the
concentration was very low in the year
of 1950 but it was constantly increasing to reach the peak in t
he year of 1970. After 1970, the
number is significantly dropped exactly in 1990. According to
the notes, I realized there was a
clean air act update in the year of 1990.
Q4A:
T
his figure shows concentration of methane in the atmosphere
from 1000 years to
2000, in 1000
the methane around 650 to 750 and it goes in the middle for
example in 1500 it increased up to
750 and it continue between the 650 and the 750 in the 1800 it
increases up to 1750
Q5A:
Figure 1.5 presents the changes in Nitrous Oxide. It shows
that from year 1750 to 1950 the
Nitrous Oxide was stable and has no change
between 250 and 300
. However, in year 1950
the
number had a little increase to year 2000 to be almost 310.
Ieas Almoily
BO315
February 5, 2016
Lab #2
Q1A:
In the diagram figure 1.1 shows that from 1860 to 1940, the
temperature is increasing and
decreasing below and on the 0 C. From 1940 to 1980 the
temperature was increasing and
decreasing on the 0 C. From 1980 to 2000 the temperature is
increasing above the 0 C and went
up to 0.6 C. From 2000 to 2100 the temperature starts
increasing from 0.6 C to 1 C, and from
there the temperature is increasing until 2100 the temperature is
5 C.
Q2A:
First of all, in order to describe in the figure I found the
definition that might guide me to
describe it well. So, “Carbon dioxide (CO
2
). A minor but very important component of the
atmosphere, carbon dioxide is released through natural
processes such as respiration and volcano
eruptions and through human activities such as deforestation,
land use changes, and burning
fossil fuels. Humans have increased atmospheric CO
2
concentration by a third since the
Industrial Revolution began. This is the most important long-
lived "forcing" of climate change”.
The figure showed us the changed that happened since 1870 till
2000. Taking these different
influences into account, it is possible to determine how much
the temperature decreased when
carbon dioxide was reduced, and use this figure to determine
how much temperature might
increase as carbon dioxide increases. After I read some articles,
I found that when the carbon
dioxide concentration goes up, temperature goes up. When the
carbon dioxide concentration goes
down, temperature goes down.
Q3A:
It can be clearly seen from the figure provided is that the
concentration was very low in the year
of 1950 but it was constantly increasing to reach the peak in the
year of 1970. After 1970, the
number is significantly dropped exactly in 1990. According to
the notes, I realized there was a
clean air act update in the year of 1990.
Q4A:
This figure shows concentration of methane in the atmosphere
from 1000 years to 2000, in 1000
the methane around 650 to 750 and it goes in the middle for
example in 1500 it increased up to
750 and it continue between the 650 and the 750 in the 1800 it
increases up to 1750
Q5A:
Figure 1.5 presents the changes in Nitrous Oxide. It shows that
from year 1750 to 1950 the
Nitrous Oxide was stable and has no change between 250 and
300. However, in year 1950 the
number had a little increase to year 2000 to be almost 310.
Ieas Almoily
January 25, 2016
GO315
Lab#1
1. Describe the temperature and pressure patterns in the figure
E-1?
In the layer troposphere the temperature decreased, because it
starts from 2c and decreased to -4c. In the layer stratosphere the
temperature increased from -41c to -39c and from -39c
increased to 2c. In the layer mesosphere decreased from 2c to -
50c. In the layer thermosphere increased from -50c to 122c.
The pressure in the layer troposphere started decreasing from 40
to 0. In the layer stratosphere still decreasing from 0 to -40, and
for the mesosphere and thermosphere stays at the -40c.
2. How thick would 200 DU of ozone be?
The thick would be 2.
3. How is ozone formed naturally?
It is formed naturally by chemical reactions.
4. How is ozone destroyed and destructed naturally?
Stratospheric ozone is destroyed by the chlorine contained in
certain chemicals (other substance also “eat” ozone, but
chlorine is the most important). Many of these chemicals, called
chlorofluorocarbons.
5. What was the Montreal Protocol (1987)?
The Montreal protocol on substance that deplete the ozone layer
was designed to reduce the production and consumptions of
ozone.
6. Explain the Arctic Ozone?
Area that may affected by formation of arctic ozone is the
yellow area within the red circle.
7. Explain the history of the ozone hole from 1980 to 2012?
Give your idea about what happening?
In the 1980's the first measurements of this loss were actually
documented. In 1984, when the British first reported their
findings, October ozone levels were about 35 percent lower than
the average for the 1960s. When the first measurements were
taken the drop in ozone levels in the stratosphere was so
dramatic that at first the scientists thought their instruments
were faulty. The ozone hole reached its maximum size Sept. 22,
2012 covering 8.2 million square miles (21.2 million square
kilometers), or the area of the United States, Canada and
Mexico combined. The average size of the 2012 ozone hole was
6.9 million square miles (17.9 million square kilometers).
8. How does the Sun’s Effect on the ozone layer?
As in the pressure from layer troposphere is high and decreased
when it goes up to the space.
Ieas
Almoily
January 25, 2016
GO315
Lab#1
1.
Describe the temperature and pressure patterns in the figure E
-
1?
In the layer troposphere the temperature decreased, because it
starts from 2c and
decreased to
-
4c.
In
the layer
stratosphere
the temperature increa
sed from
-
41c to
-
39c
and from
-
39c increased to 2c.
In
the layer
mesosphere
decreased from
2c to
-
50c.
In
the
layer
thermosphere
increased from
-
50c to 122c.
The
pressure in the layer
troposphere
started decreasing from 40 to 0. In the layer
stratosphere
still decreasing from 0 to
-
40,
and for the
mesosphere
and thermosphere stays at the
-
40c.
2.
How thick would 200 DU of ozone be?
The thick would be 2.
3.
How is ozone formed naturally?
It is formed naturally by chemical reactions
.
4.
How is ozone destroyed and destructed naturally?
Stratospheric ozone is destroyed by the chlorine contained in
certain
chemicals
(
other
substance
also “eat” ozone, but chlorine is the most important). Many of
these
chemicals
,
called
chlorofluorocarbons
.
5.
What was the Montreal P
rotocol (1987)?
The
Montreal
protocol on substance that deplete the ozone layer was designed
to reduce
the production and consumptions of ozone
.
Ieas Almoily
January 25, 2016
GO315
Lab#1
1. Describe the temperature and pressure patterns in the figure
E-1?
In the layer troposphere the temperature decreased, because it
starts from 2c and
decreased to -4c. In the layer stratosphere the temperature
increased from -41c to -39c
and from -39c increased to 2c. In the layer mesosphere
decreased from 2c to -50c. In the
layer thermosphere increased from -50c to 122c. The pressure
in the layer troposphere
started decreasing from 40 to 0. In the layer stratosphere still
decreasing from 0 to -40,
and for the mesosphere and thermosphere stays at the -40c.
2. How thick would 200 DU of ozone be?
The thick would be 2.
3. How is ozone formed naturally?
It is formed naturally by chemical reactions.
4. How is ozone destroyed and destructed naturally?
Stratospheric ozone is destroyed by the chlorine contained in
certain chemicals (other
substance also “eat” ozone, but chlorine is the most important).
Many of these chemicals,
called chlorofluorocarbons.
5. What was the Montreal Protocol (1987)?
The Montreal protocol on substance that deplete the ozone layer
was designed to reduce
the production and consumptions of ozone.

Ieas AlmoilyGO315Mar 23, 2016.docx

  • 1.
    Ieas Almoily GO315 Mar 23,2016 Lab #6 Q1A: Lake management is a process. A lake manager displays a willingness to study a lake, to assess its status and its needs,
  • 2.
    and to determinehow best to maximize the lake’s potential as a thriving ecosystem. Lake management can be as simple as fostering the practices of stewardship among lake homeowners and other interested individuals. It can also include taking an active role in altering specific ecological relationships within the lake and its watershed to make a lake healthy and keep it healthy. Lake management can also include protecting the health of a lake ecosystem through a plan of preventive action. Lake management, to be effective, requires the coordinated efforts of a group of individuals in the form of a lake association, sporting or conservation club, or another organization or group of stewards. Q2A: Many freshwater lakes, streams, and ponds are polluted. The causes of pollution depend on many different factors. These factors vary in different parts of the world. Farming chemicals can cause algae to bloom. These microscopic organisms can take over a freshwater habitat like this pond. For example, in parts of the US, fertilizers and pesticides are two major sources of pollution. In many farms, chemicals are sprayed on crops to help them grow and to prevent bugs. When it rains, the extra fertilizers and pesticides flow into streams. Q3A: Water pollution affects the health of the waterway, the health of the organisms living in and around the waterway, and, eventually, the health of humans. The effects of water pollution can range from aquatic deformities to contaminated fish to "dead" lakes. Here are some examples: 1) Aquatic diseases and deformities. 2) Human health issues. Ieas Almoily BO315 February 26, 2016
  • 3.
    Lab #5 Q1A: Biotic; theliving parts of an ecosystem, the animals, plants and microorganisms. B. Abiotic; the non-living parts of ecosystem. In this image all biotic; fish, plants, sun, animals. Q2A: Habitats; have many features or factors that important to the organisms living there. The two major; physical factor and biotic factor. Niche; the adaptive roles of the organism in the system how to make it live in the environment. According to university of Arkansas, flamingos lives on coastal or heavily salted seas. They eat the brine shrimp and brine-flies that live in the place like salt lake in Utah. Q3A: Consumer: wedge tailed eagle, snake, grasshopper, mouse, rabbit, and kookaburra. Decomposer: Non Producers: grass. Q4A: The picture could be classified as organism: several of fishes and other animals living in their environment “water”. Also, showing a bird having its own environment of food and producer, which are eggs. The other part of the picture is not obvious to be described. Q5A: The lowest trophic level is the first trophic level. The reason is that set of organisms that can manufacture their energy and biomass using only sunlight, drawing inorganic nutrients from the soil or water. The highest trophic level is the last trophic
  • 4.
    level. The reasonis that the size of the portion of the diagram associated with each trophic level is intended to depict the amount of energy, biomass, or number of individuals found in each trophic level. There are three numbers represents energy. 10,000 represents the last trophic level, 100 represents the middle trophic level, and 1 represents the first trophic level. Q6A: 1st Trophic Level: Producer and it Makes its own food example of the 1st trophic level Plants make food. 2nd Trophic level: primary consumer and it consumes producers example of the 2nd trophic level mice eat plant seeds 3rd Trophic Level: Secondary Consumer and it Consumes primary consumers example of the 3rd Trophic Level Snakes eat mice. 4th Trophic level: tertiary consumer and it consumes secondary consumers example of the 4th Trophic level Hawks eats snakes Q7A: Plants Animals Buffalo grass Barn owl cattalls Alligator Halimeda plant Green turtle ocotillo Camel Pasque flower arctic fox Q8A: I realized how the term of “ecosystem” is very important to
  • 5.
    every individual existence.Ecosystem is very reliable in keeping individuals alive by ensuring the food supply. We all know that every species is reliable on others. For instance, if you take a look to “food chain” you can notice that birds are relied on plants to be alive, and wild animals are relied on other animals, and so on. In another word, we have two types of consumers one is primary consumer, and the other one is secondary consumers. Ieas Almoily BO315 February 26 , 2016 Lab #5 Q1 A: Biotic; the living parts of an ecosystem, th e animals, plants and microorganisms. B. Abiotic; the non - living parts of ecosystem. In this image all biotic; fish, plants, sun, animals.
  • 6.
    Q2A: Habitats; have many featuresor factors that important to the organisms living there. The two major; physical factor and biotic factor. Niche; the adaptive roles of the organism in the system how to make it live in the environment. According to university of Arkansas, flamingos lives on coastal or heavily salted seas. They eat the brine shrimp and brine - flies that live in the place like salt lake in Utah. Q3A: Consumer: wedge tailed eagle, snake, grasshopper, mouse, rabbit, and kookaburra. Decomposer: Non Producers: gr ass. Q4 A:
  • 7.
    The picture couldbe classified as organism: several of fishes and other animals living in their environment “water”. Also, showing a bird having its own environment of food and producer, which are eggs. The other part of the picture is not obviou s to be described. Q5A: The lowest trophic level is the first trophic level. The reason is that set of organisms that can manufacture their energy and biomass using only sunlight, drawing inorganic nutrients from the soil or water. The highest trophic level is the last trophic level. The reason is that the size of the portion of the diagram associated with each trophic level is intended to depict the amount of energy, biomass, or number of individuals found in each trophic level. There are three number s represents energy. 10,000 represents the last trophic level, 100 represents the middle trophic level, and 1 represents the first trophic level. Q6 A: 1st Trophic Level: Producer and it Makes its own food example of the 1st trophic level Plants make
  • 8.
    food. Ieas Almoily BO315 February 26,2016 Lab #5 Q1A: Biotic; the living parts of an ecosystem, the animals, plants and microorganisms. B. Abiotic; the non-living parts of ecosystem. In this image all biotic; fish, plants, sun, animals. Q2A: Habitats; have many features or factors that important to the organisms living there. The two major; physical factor and biotic factor. Niche; the adaptive roles of the organism in the system how to make it live in the environment. According to university of Arkansas, flamingos lives on coastal or heavily salted seas. They eat the brine shrimp and brine-flies that live in the place like salt lake in Utah. Q3A: Consumer: wedge tailed eagle, snake, grasshopper, mouse, rabbit, and kookaburra. Decomposer: Non Producers: grass. Q4A: The picture could be classified as organism: several of fishes and other animals living in their environment “water”. Also, showing a bird having its own environment of food and
  • 9.
    producer, which areeggs. The other part of the picture is not obvious to be described. Q5A: The lowest trophic level is the first trophic level. The reason is that set of organisms that can manufacture their energy and biomass using only sunlight, drawing inorganic nutrients from the soil or water. The highest trophic level is the last trophic level. The reason is that the size of the portion of the diagram associated with each trophic level is intended to depict the amount of energy, biomass, or number of individuals found in each trophic level. There are three numbers represents energy. 10,000 represents the last trophic level, 100 represents the middle trophic level, and 1 represents the first trophic level. Q6A: 1st Trophic Level: Producer and it Makes its own food example of the 1st trophic level Plants make food. Ieas Almoily BO315 February 5, 2016 Lab #2 Q1A: In the diagram figure 1.1 shows that from 1860 to 1940, the temperature is increasing and decreasing below and on the 0 C. From 1940 to 1980 the temperature was increasing and decreasing on the 0 C. From 1980 to 2000 the temperature is
  • 10.
    increasing above the0 C and went up to 0.6 C. From 2000 to 2100 the temperature starts increasing from 0.6 C to 1 C, and from there the temperature is increasing until 2100 the temperature is 5 C. Q2A: First of all, in order to describe in the figure I found the definition that might guide me to describe it well. So, “Carbon dioxide (CO2). A minor but very important component of the atmosphere, carbon dioxide is released through natural processes such as respiration and volcano eruptions and through human activities such as deforestation, land use changes, and burning fossil fuels. Humans have increased atmospheric CO2 concentration by a third since the Industrial Revolution began. This is the most important long-lived "forcing" of climate change”. The figure showed us the changed that happened since 1870 till 2000. Taking these different influences into account, it is possible to determine how much the temperature decreased when carbon dioxide was reduced, and use this figure to determine how much temperature might increase as carbon dioxide increases. After I read some articles, I found that when the carbon dioxide concentration goes up, temperature goes up. When the carbon dioxide concentration goes down, temperature goes down. Q3A: It can be clearly seen from the figure provided is that the concentration was very low in the year of 1950 but it was constantly increasing to reach the peak in the year of 1970. After 1970, the number is significantly dropped exactly in 1990. According to the notes, I realized there was a clean air act update in the year of 1990. Q4A:
  • 11.
    This figure showsconcentration of methane in the atmosphere from 1000 years to 2000, in 1000 the methane around 650 to 750 and it goes in the middle for example in 1500 it increased up to 750 and it continue between the 650 and the 750 in the 1800 it increases up to 1750 Q5A: Figure 1.5 presents the changes in Nitrous Oxide. It shows that from year 1750 to 1950 the Nitrous Oxide was stable and has no change between 250 and 300. However, in year 1950 the number had a little increase to year 2000 to be almost 310. Q6A: In the past 1000 years it was in the middle it goes up and down but when it reached 1900 it increases about 0.8 in the graph. However, in the 1250 it increased up to 0.1. In 1900 it starts to increase up to 0.6 in 2000. Q7A: Each of these greenhouse gases affects climate differently. Some gases can trap the sun’s energy better than others. The degree to which a gas traps solar energy is called its radiative forcing value. Radiative forcing values are indicated on the right axis of the graphs. The higher the radiative forcing value, the stronger its effect on global warming. Q8A: By 2100, the range of temperature increase is expected to be between 1.4 and 5.6.
  • 12.
    Q9A: North hemisphere appearsto have experienced the most significant temperature changes. Because the northern hemisphere is warming faster than the southern hemisphere, with some of the most rapid warming rates on earth located in the Arctic. Northern hemisphere is winning now and projections show that, largely due to the influence of manmade greenhouse gas emissions. Also, the northern hemisphere has led the southern hemisphere in its rate of warming since about 1980, largely because the northern hemisphere has more land and less ocean than the southern hemisphere, and oceans warm relatively slowly. Q10A: AS it’s mentioned in the link “Climate changes affect ecological systems, and changes in ecological systems influence the processes of disease transmission. Changes in temperature and precipitation, as well as extreme climate events such as floods or droughts, are capable of changing ecological systems. For example, research links increases in diarrheal disease to flooding, and cholera outbreaks to warmer sea surface temperatures. Different weather conditions are known to affect vector-borne diseases such as malaria and dengue”. The key fact that I got from this articles the climate change affects the social and environmental determinants of health – clean air, safe drinking water such what happened in flint Michigan as you mentioned in last lecture. Ieas Almoily BO315
  • 13.
    February 5, 2016 Lab#2 Q1A: In the diagram figure 1.1 shows that from 1860 to 1940, the temperature is increasing and decreasing below and on the 0 C. From 1940 to 1980 the temperature was increasing and decreasing on the 0 C. From 1980 to 2000 the temperature is increasing above the 0 C and went up to 0.6 C. From 2000 to 2100 the temperature starts increasing from 0.6 C to 1 C, and from there the temperature is increasing until 2100 the temperature is 5 C. Q2A: First of all, i n order to describe in the figure I found the def inition that might guide me to describe it well. So, “Carbon dioxide (CO 2 ). A minor but very important component of the atmosphere, carbon dioxide is released through natural processes such as respiration and volcano eruptions and through human activities such as deforestation, land use changes, and burning fossil fuels. Humans have increased atmospheric CO
  • 14.
    2 concentration by athird since the Industrial Revolution began. This is the most important long - lived "forcing" of climate change”. The figure showed u s the changed that happened since 1870 till 2000. Taking these different influences into account, it is possible to determine how much the temperature decreased when carbon dioxide was reduced, and use this figure to determine how much temperature might in crease as carbon dioxide increases . After I read some articles , I found that when the carbon dioxide concentration goes up, temperature goes up. When the carbon dioxide concentration goes down, temperature goes down. Q3A: It can be clearly seen from the figure provided is that the concentration was very low in the year
  • 15.
    of 1950 butit was constantly increasing to reach the peak in t he year of 1970. After 1970, the number is significantly dropped exactly in 1990. According to the notes, I realized there was a clean air act update in the year of 1990. Q4A: T his figure shows concentration of methane in the atmosphere from 1000 years to 2000, in 1000 the methane around 650 to 750 and it goes in the middle for example in 1500 it increased up to 750 and it continue between the 650 and the 750 in the 1800 it increases up to 1750 Q5A: Figure 1.5 presents the changes in Nitrous Oxide. It shows that from year 1750 to 1950 the Nitrous Oxide was stable and has no change between 250 and 300 . However, in year 1950 the number had a little increase to year 2000 to be almost 310. Ieas Almoily
  • 16.
    BO315 February 5, 2016 Lab#2 Q1A: In the diagram figure 1.1 shows that from 1860 to 1940, the temperature is increasing and decreasing below and on the 0 C. From 1940 to 1980 the temperature was increasing and decreasing on the 0 C. From 1980 to 2000 the temperature is increasing above the 0 C and went up to 0.6 C. From 2000 to 2100 the temperature starts increasing from 0.6 C to 1 C, and from there the temperature is increasing until 2100 the temperature is 5 C. Q2A: First of all, in order to describe in the figure I found the definition that might guide me to describe it well. So, “Carbon dioxide (CO 2 ). A minor but very important component of the atmosphere, carbon dioxide is released through natural processes such as respiration and volcano eruptions and through human activities such as deforestation, land use changes, and burning fossil fuels. Humans have increased atmospheric CO 2 concentration by a third since the Industrial Revolution began. This is the most important long- lived "forcing" of climate change”. The figure showed us the changed that happened since 1870 till 2000. Taking these different influences into account, it is possible to determine how much
  • 17.
    the temperature decreasedwhen carbon dioxide was reduced, and use this figure to determine how much temperature might increase as carbon dioxide increases. After I read some articles, I found that when the carbon dioxide concentration goes up, temperature goes up. When the carbon dioxide concentration goes down, temperature goes down. Q3A: It can be clearly seen from the figure provided is that the concentration was very low in the year of 1950 but it was constantly increasing to reach the peak in the year of 1970. After 1970, the number is significantly dropped exactly in 1990. According to the notes, I realized there was a clean air act update in the year of 1990. Q4A: This figure shows concentration of methane in the atmosphere from 1000 years to 2000, in 1000 the methane around 650 to 750 and it goes in the middle for example in 1500 it increased up to 750 and it continue between the 650 and the 750 in the 1800 it increases up to 1750 Q5A: Figure 1.5 presents the changes in Nitrous Oxide. It shows that from year 1750 to 1950 the Nitrous Oxide was stable and has no change between 250 and 300. However, in year 1950 the number had a little increase to year 2000 to be almost 310.
  • 18.
    Ieas Almoily January 25,2016 GO315 Lab#1 1. Describe the temperature and pressure patterns in the figure E-1? In the layer troposphere the temperature decreased, because it starts from 2c and decreased to -4c. In the layer stratosphere the temperature increased from -41c to -39c and from -39c increased to 2c. In the layer mesosphere decreased from 2c to - 50c. In the layer thermosphere increased from -50c to 122c. The pressure in the layer troposphere started decreasing from 40 to 0. In the layer stratosphere still decreasing from 0 to -40, and for the mesosphere and thermosphere stays at the -40c. 2. How thick would 200 DU of ozone be? The thick would be 2. 3. How is ozone formed naturally? It is formed naturally by chemical reactions. 4. How is ozone destroyed and destructed naturally? Stratospheric ozone is destroyed by the chlorine contained in certain chemicals (other substance also “eat” ozone, but chlorine is the most important). Many of these chemicals, called chlorofluorocarbons. 5. What was the Montreal Protocol (1987)? The Montreal protocol on substance that deplete the ozone layer was designed to reduce the production and consumptions of ozone. 6. Explain the Arctic Ozone? Area that may affected by formation of arctic ozone is the yellow area within the red circle. 7. Explain the history of the ozone hole from 1980 to 2012? Give your idea about what happening? In the 1980's the first measurements of this loss were actually documented. In 1984, when the British first reported their findings, October ozone levels were about 35 percent lower than the average for the 1960s. When the first measurements were
  • 19.
    taken the dropin ozone levels in the stratosphere was so dramatic that at first the scientists thought their instruments were faulty. The ozone hole reached its maximum size Sept. 22, 2012 covering 8.2 million square miles (21.2 million square kilometers), or the area of the United States, Canada and Mexico combined. The average size of the 2012 ozone hole was 6.9 million square miles (17.9 million square kilometers). 8. How does the Sun’s Effect on the ozone layer? As in the pressure from layer troposphere is high and decreased when it goes up to the space. Ieas Almoily January 25, 2016 GO315 Lab#1 1. Describe the temperature and pressure patterns in the figure E - 1? In the layer troposphere the temperature decreased, because it starts from 2c and decreased to - 4c. In the layer stratosphere
  • 20.
    the temperature increa sedfrom - 41c to - 39c and from - 39c increased to 2c. In the layer mesosphere decreased from 2c to - 50c. In the layer thermosphere increased from - 50c to 122c. The pressure in the layer troposphere started decreasing from 40 to 0. In the layer stratosphere
  • 21.
    still decreasing from0 to - 40, and for the mesosphere and thermosphere stays at the - 40c. 2. How thick would 200 DU of ozone be? The thick would be 2. 3. How is ozone formed naturally? It is formed naturally by chemical reactions . 4. How is ozone destroyed and destructed naturally? Stratospheric ozone is destroyed by the chlorine contained in certain chemicals ( other substance
  • 22.
    also “eat” ozone,but chlorine is the most important). Many of these chemicals , called chlorofluorocarbons . 5. What was the Montreal P rotocol (1987)? The Montreal protocol on substance that deplete the ozone layer was designed to reduce the production and consumptions of ozone . Ieas Almoily January 25, 2016 GO315 Lab#1 1. Describe the temperature and pressure patterns in the figure E-1? In the layer troposphere the temperature decreased, because it starts from 2c and decreased to -4c. In the layer stratosphere the temperature increased from -41c to -39c and from -39c increased to 2c. In the layer mesosphere decreased from 2c to -50c. In the layer thermosphere increased from -50c to 122c. The pressure in the layer troposphere started decreasing from 40 to 0. In the layer stratosphere still
  • 23.
    decreasing from 0to -40, and for the mesosphere and thermosphere stays at the -40c. 2. How thick would 200 DU of ozone be? The thick would be 2. 3. How is ozone formed naturally? It is formed naturally by chemical reactions. 4. How is ozone destroyed and destructed naturally? Stratospheric ozone is destroyed by the chlorine contained in certain chemicals (other substance also “eat” ozone, but chlorine is the most important). Many of these chemicals, called chlorofluorocarbons. 5. What was the Montreal Protocol (1987)? The Montreal protocol on substance that deplete the ozone layer was designed to reduce the production and consumptions of ozone.